

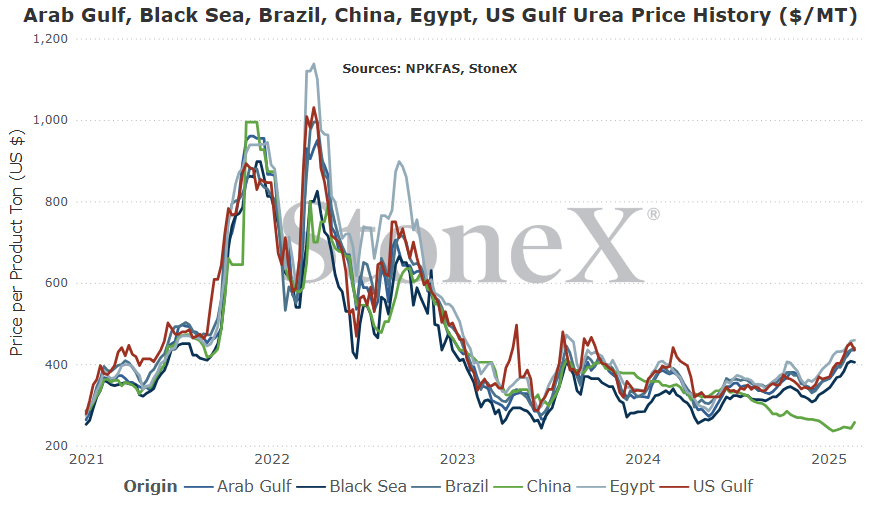
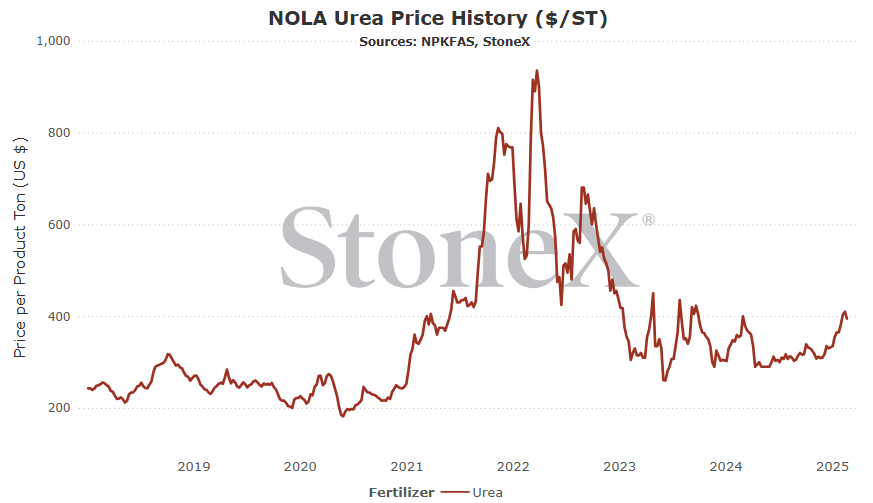
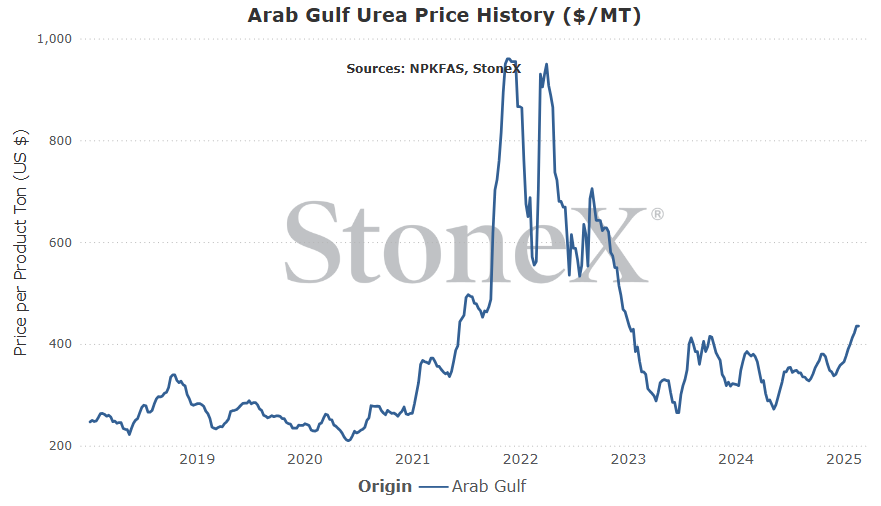
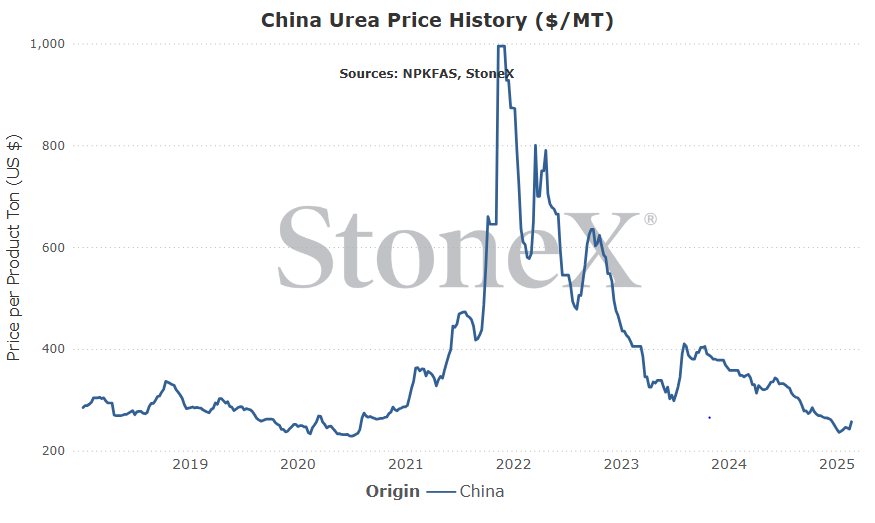
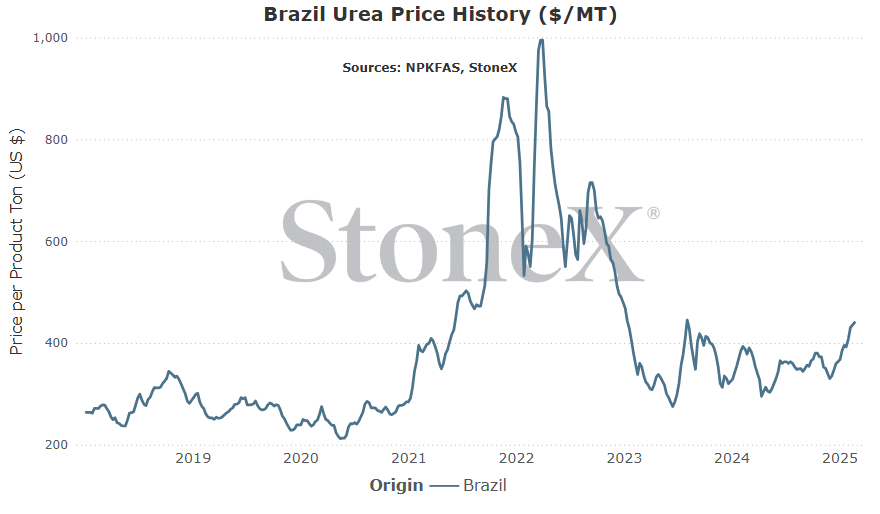
The intention of the below graphs are not to use to say "my price should be X based on this graph". These prices are derived from an FOB price point average. The intent is to show major global price movement trends. Your values will likely have significant basis difference (similar to your local grain price being different than the traded market price).
This graph is labeled as MT in USD currency.
Where do we go from here?
We finally saw the bullishness we had been looking for. Tight supplies finally met demand that stepped forward and the markets got hot. Well, since that happened, things have slowed down. India has been dragging their feet on their anticipated purchase tender and other global buyers have gone silent. Values have dipped a bit, though they are still higher than last edition.
My fear is that buyers are now backed into a corner. We are nearly certain (I would say I am certain, but compliance does not like that talk!!!) that India needs to step in. They fell significantly short of their tonnage goal in their December tender. They fell significantly short of their tonnage goal in their January tender. Demand I heard to be solid. They can drag their feet a week or two, but that should be about it.
Other global buyers must make last preparations for their spring season. North America is no different.
On the supply side:
- Iranian production is still offline
- Chinese exports still do not exist
- European production is still 75% of normal
That is a HUGE hole in the global S&D.
With all of these, I still think higher prices are on the horizon. I just do not think there are enough pages left in the calendar for buyers to slip their way around it. When the buying starts, I’m afraid the outcome will be higher prices.
One last point, when I look at today’s S&D, I think it is in worse shape than in late 2021/early 2022 when prices were significantly higher. This is not to say I think prices are going back to those levels, but I do believe the actual S&D is tighter.
It “feels” like February imports are better than we though they would be. When I say I thought they would be poor, I say that due to NOLA values being a discount to the world for a while. The global S&D remains tight enough that it should not have had to force tons to N.A. if it were a discount. However, there has been enough activity/trade that it makes me think vessels are arriving. That is good news.
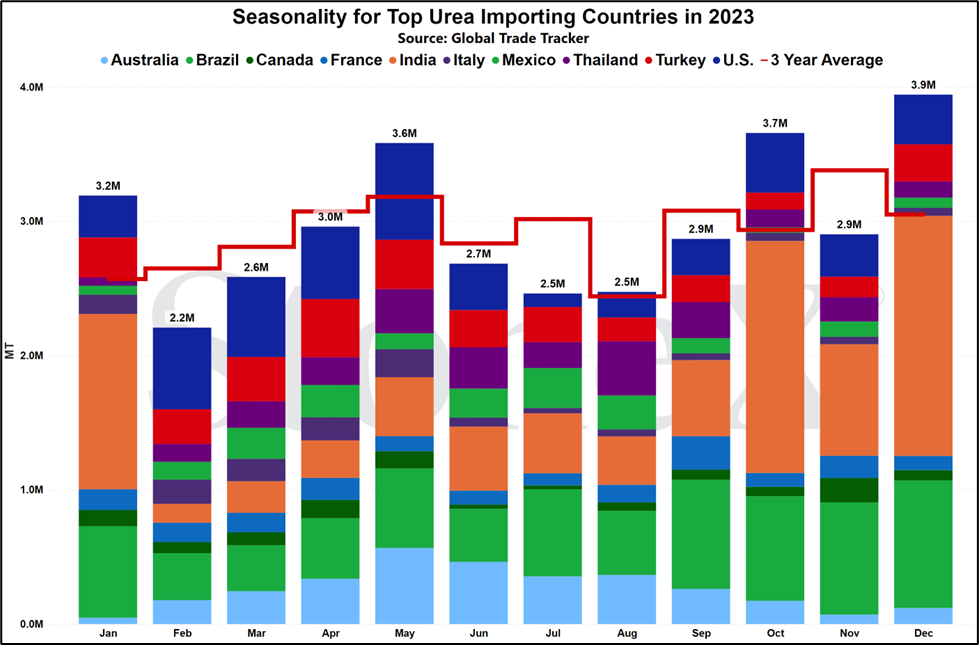
However, I’m still not sure if it is enough to be comfortable. The first half of the fertilizer year saw imports lower than average. Even if Jan/Feb see’s imports at their normal 1M ton range and June averages around 300K tons, March/April/May will need to average 1M tons…each.
Is that possible? Certainly.
Is that going to be more difficult given global supply issues? I think so.
Don’t get me started on what happens if spring NH3 falls short…
All of this to say that I’m still on the bullish side, but I am not as confident as I have been the last couple months. The market seems weary/scared/reluctant. It is an odd thing when considering all the product that is missing in addition to larger demand, but it just “feels” that way. Knowing the farmer economics are poor certainly doesn’t help anything.
Iranian production stays offline longer than expected
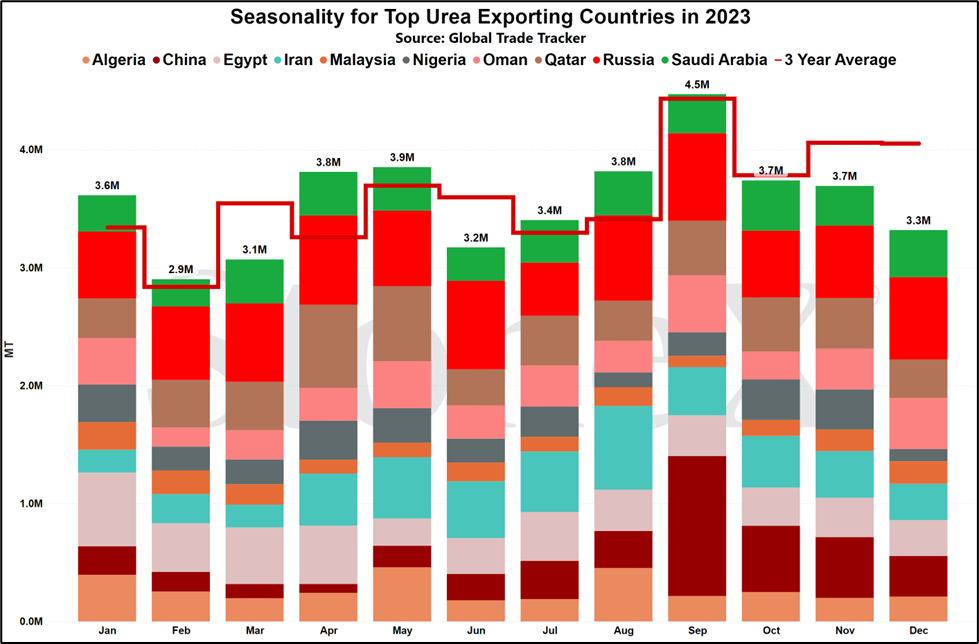
Our story surrounding global urea markets has been that of tight supplies. Europe continues to produce at approximately 75% of normal which is removing 3+ million tons of production from the global S&D. The Chinese government continues to largely ban urea exports to raise domestic urea stockpiles as well as lowering domestic urea values. Fortunately for Chinese farmers, this strategy has worked well. Unfortunately for global famers, this strategy has worked well. Chinese exports are historically normal around 5 to 5.5M tons per year. 2024 saw them at a grand total of 266K.
Now, the world is having to contend with Iran having issues.
The global urea market puts a lot of weight on Chinese participation. Their 5 – 5.5M tons typically equates to roughly 10% of the global export marketplace. When they are participating, it creates a sense of dread and nervousness that helps to drive price ideas lower. When they are not participating, it allows the market to rally higher.
Rarely discussed are Iranian tons. They have been the subject of strict tariffs that have seen many major global buyers refusing to do business. When an Iranian price goes up or down, the market generally shrugs it off as “it’s just Iran. It doesn’t matter.” From a direct POV, they are correct. However, what is missing from that approach is the fact that Iranian tons STILL affect the global S&D.
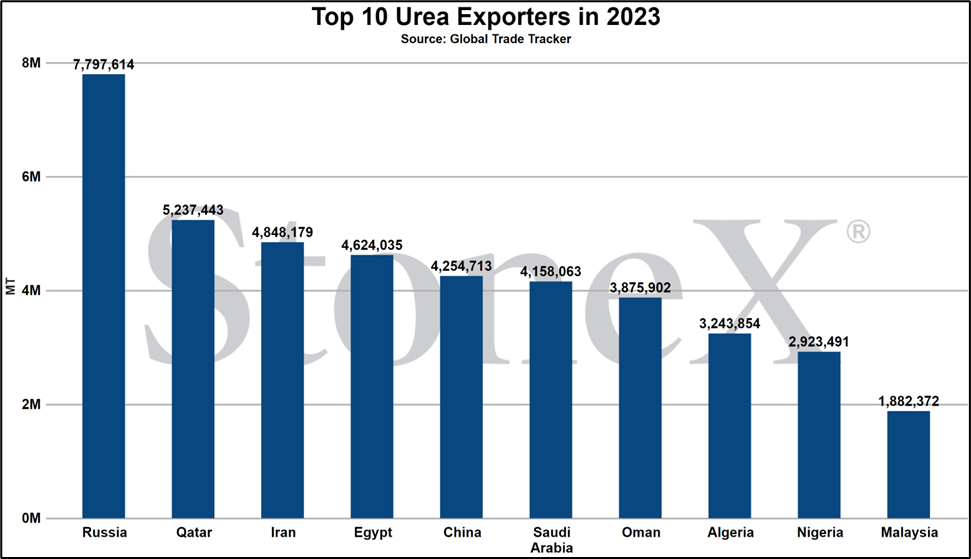
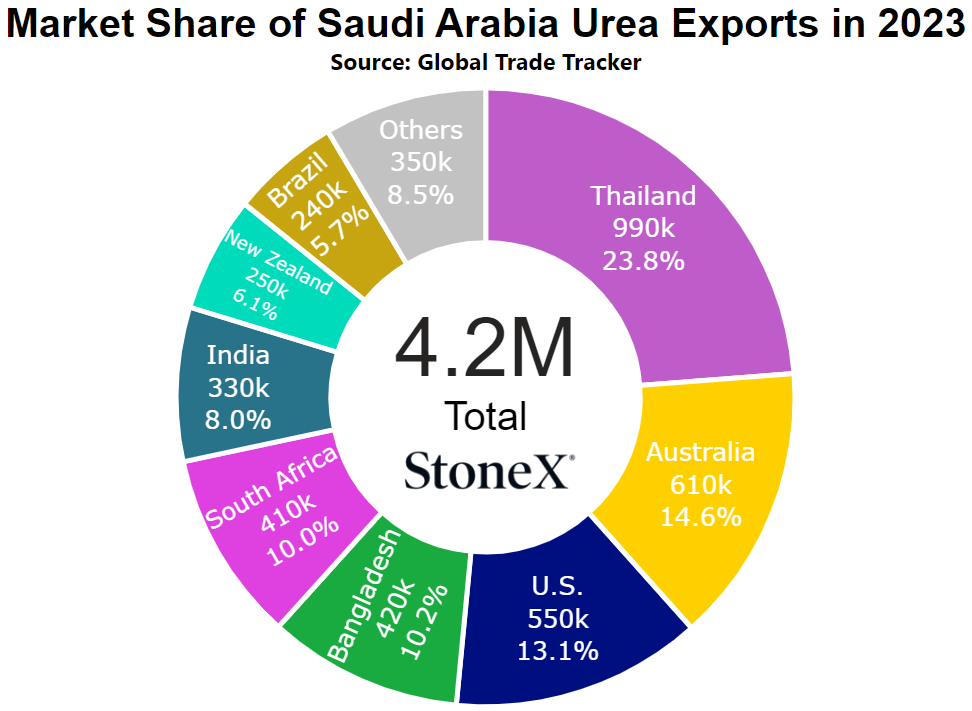
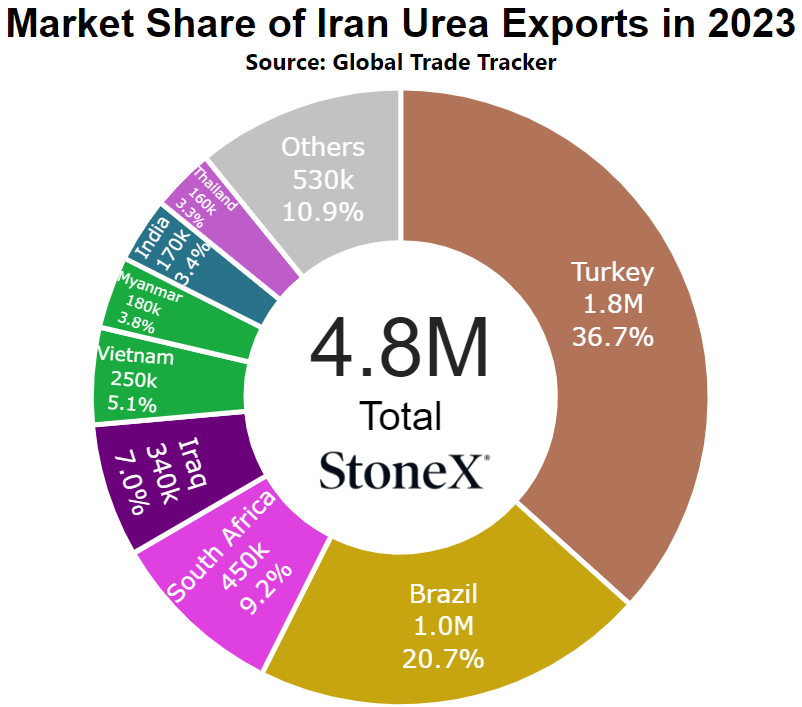
In 2024, Iran accounted for roughly 4.8M tons of urea exports. That is VERY near the same total that China would export on a normal basis.
We started 2025 with Iranian production suffering due to gas supply issues. These were seen as relatively short term and we, as well as many in the market, believed it would be short lived. However, as I write this, their production STILL has not been heard returning. As a result, approximately 400K tons are lost ever 30 days on top of losses from European and Chinese sources.
I still do not believe this will be a long-term issue…but damage is being done that will not be made up before many spring seasons. When combined with European and Chinese shortfalls, over 1M tons of supply are being lost. The world does not have excessive production as it has in the past so when these issues pop up, prices increase rapidly as has been seen in the last month. Now, I do not believe we will see supply shortfalls/outages. That is a story that has been talked out too many times in the past. Rather, this puts the market more on edge and with higher prices.
With spring fast approaching, this makes a hard situation much harder.
Update: Between starting this and sending it out, it appears things are finally changing for Iran. There have been a couple vessels of urea sold with manufacturers expecting to be back online at the start of March. This is very welcome news for the global urea market, but damage has already been done. With production already going as hard as it can under current circumstances, their production losses will remain as a hole in the global S&D. It helps to place a bit of a cap on the market, fundamentally should not do more than stop the rise based on it, but emotionally could see prices slide a bit as the market breathes a sigh of relief.
What does this mean for farmers?
Higher prices. Plain and simple.
It does not matter where you are reading this from. If you use any form of nitrogen, this affects you. Much of the European and Chinese stories were expected at the beginning of the fertilizer year (July 1) and so were “baked in” to most S&D’s. However, Iran was not factored in for many in the market. If global production was running normally, then this situation could much more easily be handled with little price movement. That is not the case. China fell short over 5M tons of their typically exports in 2024. European continues to create a 3+ million-ton shortfall due to high natural gas prices.
For now, urea prices have rallied and are likely to stay elevated for the short term. Hopefully we will see Iranian production back online which would help to alleviate at least some of the stress.
NOLA/New Orleans, Louisiana
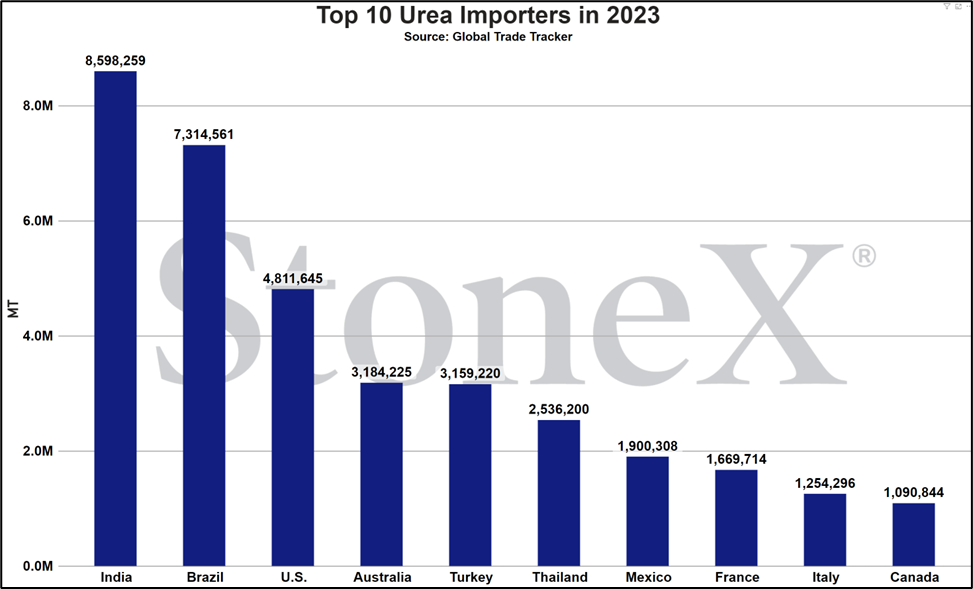
Number 3 global importer in 2022
Price comparisons
Vs 30 days ago - 8% or approximately $30 higher
Vs 90 days ago - 27% or approximately $83 higher
Vs 6 months ago - 27% or approximately $85 higher
Vs 1 year ago - 10% or approximately $38 higher
U.S. Midwest Average
Vs 30 days ago - 16% or approximately $66 higher
Vs 90 days ago - 28% or approximately $107 higher
Vs 6 months ago - 33% or approximately $120 higher
Vs 1 year ago - 21% or approximately $84 higher
U.S. Southern Plains Average
Vs 30 days ago - 13% or approximately $58 higher
Vs 90 days ago - 28% or approximately $105 higher
Vs 6 months ago - 31% or approximately $115 higher
Vs 1 year ago - 15% or approximately $65 higher
U.S. Northern Plains Average
Vs 30 days ago - 6% or approximately $23 higher
Vs 90 days ago - 15% or approximately $55 higher
Vs 6 months ago - 17% or approximately $61 higher
Vs 1 year ago - 1% or approximately $6 higher
Middle East
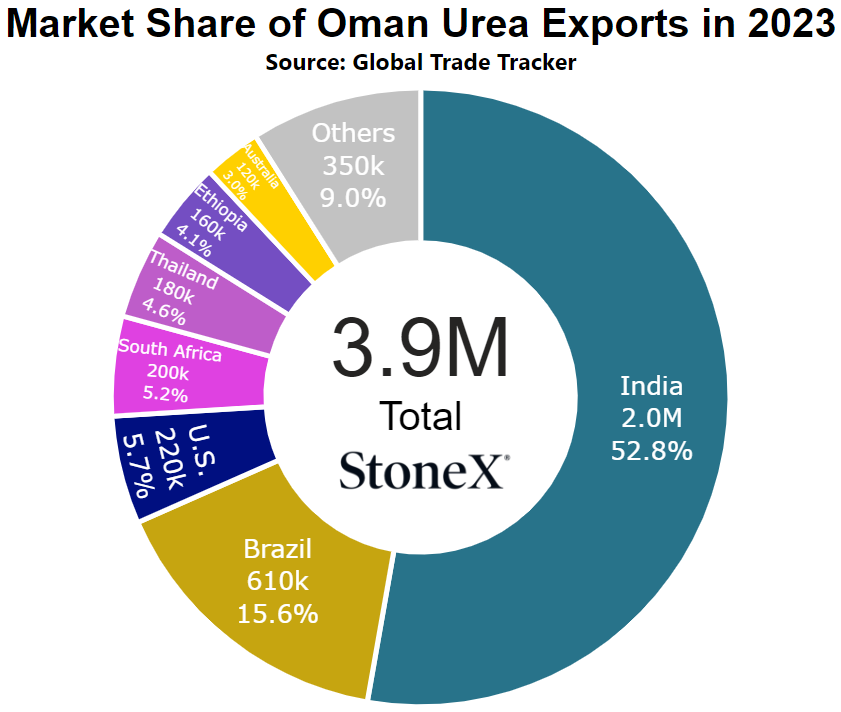
Number 1 exporter (as a region, not as individual nations)
Vs 30 days ago - 9% or approximately $35 higher
Vs 90 days ago - 25% or approximately $87 higher
Vs 6 months ago - 30% or approximately $100 higher
Vs 1 year ago - 16% or approximately $59 higher
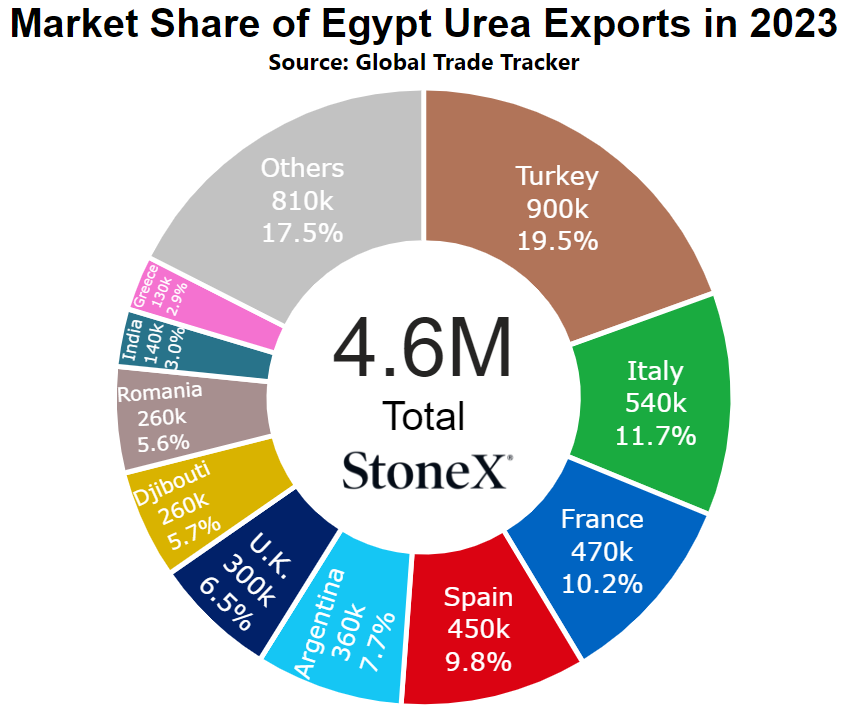
Egypt
Number 4 global exporter in 2022
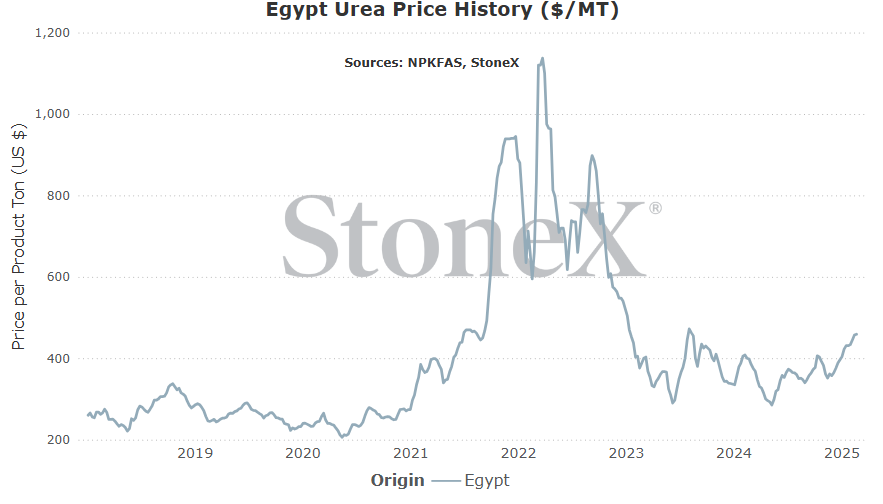
Price comparisons
Vs 30 days ago - 6% or approximately $28 higher
Vs 90 days ago - 31% or approximately $108 higher
Vs 6 months ago - 31% or approximately $108 higher
Vs 1 year ago - 15% or approximately $61 higher
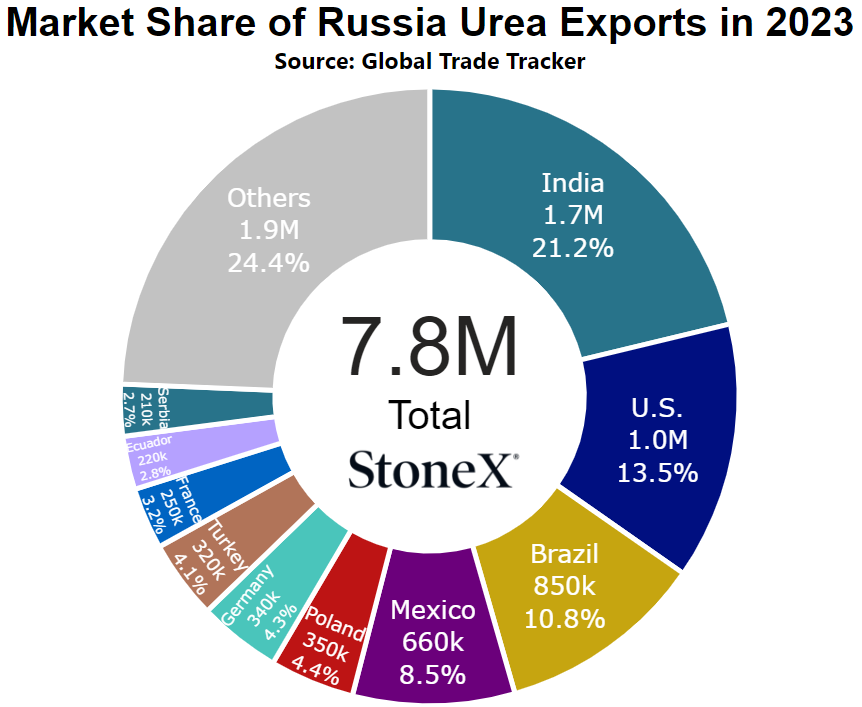
Black Sea
Number 1 global exporter in 2022
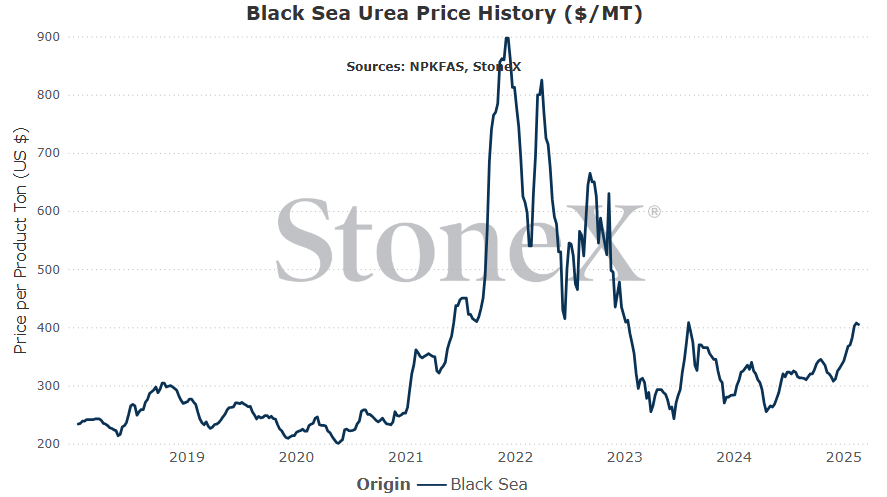
Price comparisons
Vs 30 days ago - 9% or approximately $35 higher
Vs 90 days ago - 27% or approximately $85 higher
Vs 6 months ago - 30% or approximately $93 higher
Vs 1 year ago - 24% or approximately $78 higher
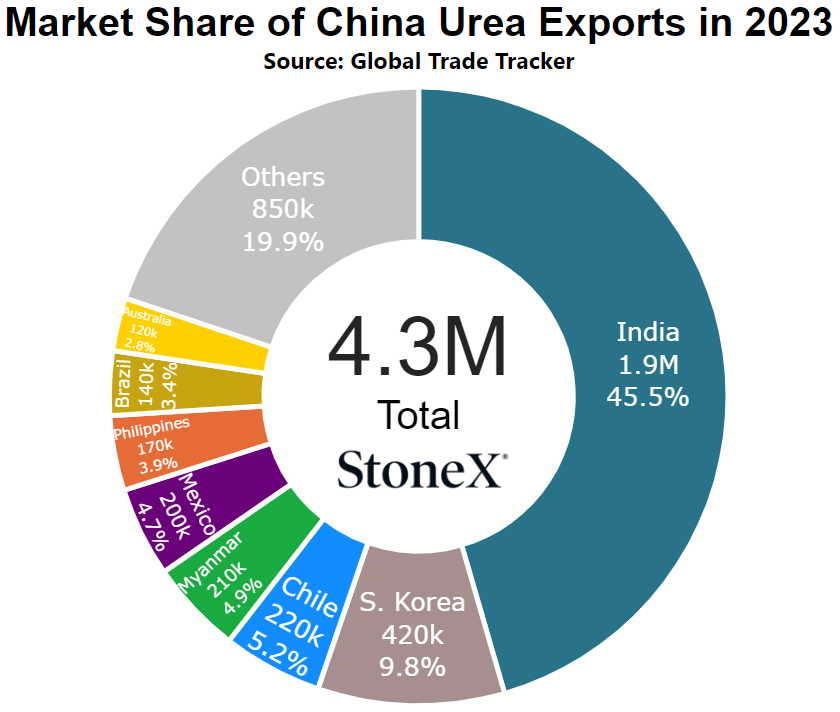
China
Number 9 global exporter in 2022
Price comparisons
Vs 30 days ago - 6% or approximately $16 higher
Vs 90 days ago - -4% or approximately $10 lower
Vs 6 months ago - -16% or approximately $48 lower
Vs 1 year ago - -26% or approximately $88 lower
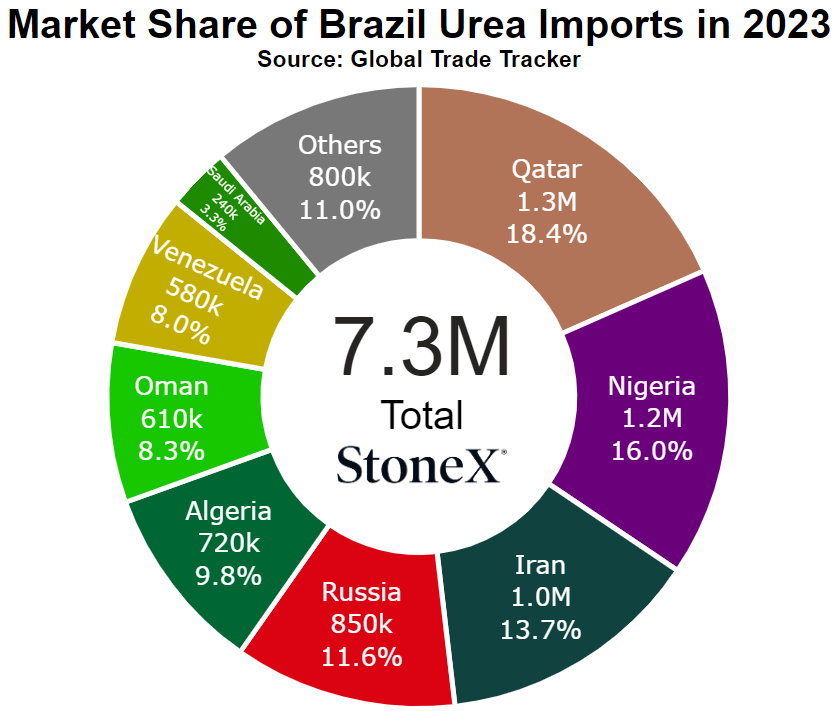
Brazil
Number 2 global importer in 2022
Price comparisons
Vs 30 days ago - 12% or approximately $48 higher
Vs 90 days ago - 26% or approximately $90 higher
Vs 6 months ago - 26% or approximately $91 higher
Vs 1 year ago - 17% or approximately $63 higher
- Iranian production remains offline - 1st, we didn't expect Iranian nitrogen production to go offline. 2nd, after coming to terms with their going offline, we didn't expect them to be offline for as long as they have been. This is the supply loss that was not expected. Every 30 days that their production is down, the world loses a further 400K tons that the world will struggle to make up. The global S&D is already tight. Iran is making that worse.
- India finally steps in to purchase - India has done a fantastic job of getting the market excited with rumors of their purchase tender, and then ripping the carpet out from under the markets feet by delaying. That has caused a lot of angst amongst "players". However, they cannot do this forever. Their December tender fell very short of tonnage goals. Their follow up January tender once again fell very short of tonnage goals. India needs to buy...just a matter of when.
- Chinese exports continue thin - the rumors that the Chinese government was going to allow exports to begin caused domestic values to spike. No doubt government officials saw that and will use that information in their decision making process. To start allowing exports to occur right before their spring season would fly in the face of the strategy they have used for over a year. It makes sense to believe that if they allow exports, it will not be until late Q2/Q3. That would mean nearby exports remain very thin, leading to a much tighter global S&D.
- India continues to drag their feet, causing an uncomfortable quiet - right now, it seems more of a "when" India announces their tender rather than "if". However, we could be wrong. Maybe India is doing much better on stockpiles than we believe. Maybe demand has slowed significantly, allowing imports to wait. I do not think so, but I do not work in a world of certainty. The longer India drags their feet, the more pressure it puts on the market.
- Iran/China exports return - Chinese exports returning seems a very low probability situation to me short term (thru spring), but it is possible. More possible is Iranian production returning, causing companies there to start selling product once again. Iran returning is likely more a "taking the worst case scenario off the table" situation, meaning prices shouldn't fall (should slow the rise). China returning would likely be seen as a very bearish event. Again, doesn't look likely, but it would be a major disrupter.
- Mother nature delays spring - this is something that can completely change the outlook of the market. The market has to plan for a whole host of possibilities. We can have a lead up to spring where everything looks extremely tightly supplied. If spring were to start normally, serious supply concerns could pop up commonplace. We have been there before...and then mother nature saves us. Wet conditions for a time allows the market to move product into place that wouldn't otherwise make it in time. I would say the market is planning for a normal spring start (as it usually does). If it stays cold and wet which keeps fieldwork from happening, supplies can start to back up and create a lot of pressure in a short time.
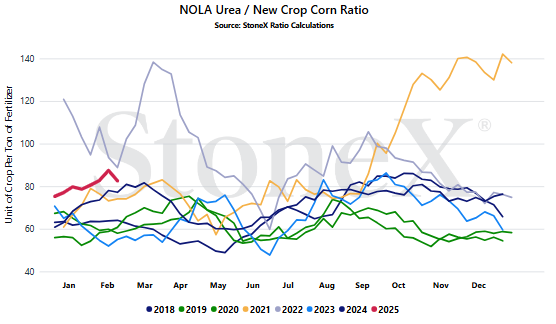
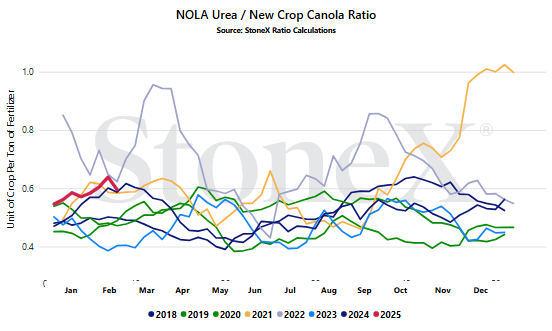
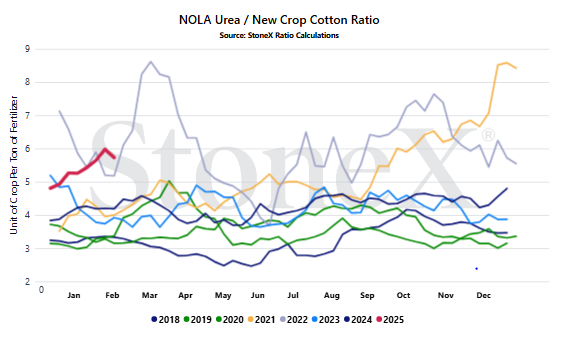
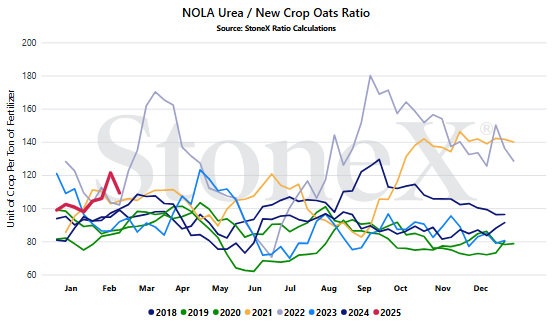
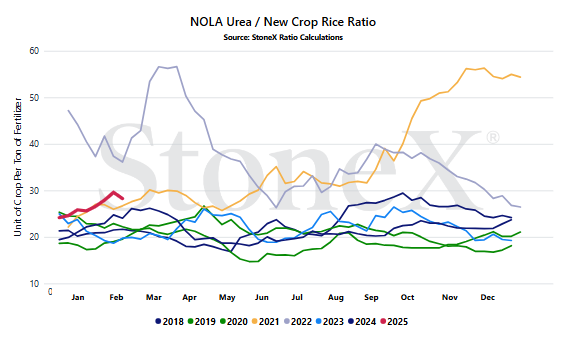
We believe that only looking at the flat price of either grains or fertilizer can be misleading:
- Only selling grain can hurt you if fertilizer prices rise substantially
- Only buying fertilizer can hurt you if grain prices fall
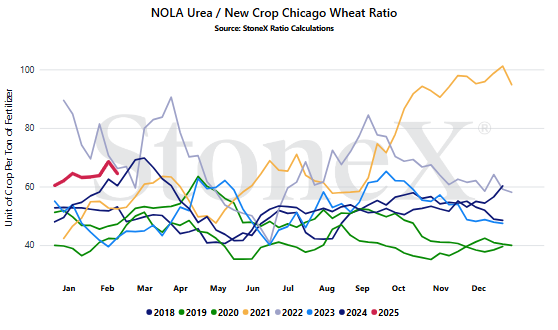
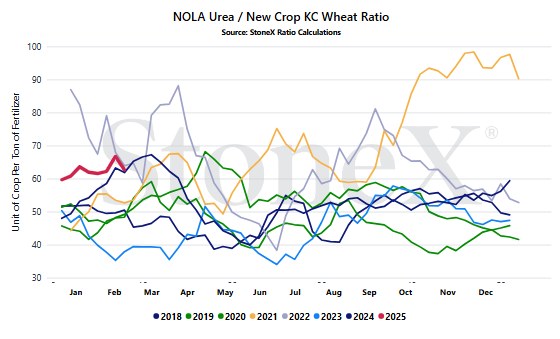
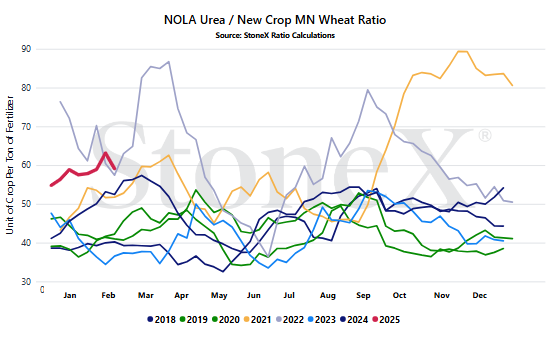
We look at the ratio "value" to get a better indication of where we are or how many bushels of X does it take to pay for 1 ton of fertilizer.
Would you rather:
- Spend 135 bushels to pay for 1 ton of urea
- Spend 55 bushels to pay for 1 ton of urea
When we compare the current ratio value against recent years, we start to see if we are high or low.
YOUR VALUES WILL LOOK DIFFERENT
This graph looks at the NOLA urea price vs the flat grain price. There are no logistics on either product. Your location will look different due to fertilizer logistical costs, grain basis, etc.
- Iran (since they should be first to come back) - Iran is the piece that we didn't expect. While it isn't crazy that Iranian production stopped, the fact that it has gone this long is. An even that we thought would be a couple week ordeal has now been going a month plus. Iran exported almost 5M tons in 2023, making it very near the same size as China who we talk a lot about. While many around the world will not do business with Iran, their exported ton counts just as much as everyone else's for the global S&D. The longer their production is down, the tighter supplies get.
- China (largest missing piece, rising questions of export programs) - it seems China is getting to a decision point. On the one hand, their stockpiles are heard to be at record levels. Production cannot continue at their current paces without exports being allowed. However, even the rumor that Chinese exports would be allowed caused domestic Chinese values to rise which is completely against the governments strategy. I do not believe exports will be allowed before their spring season, but it is China. We never truly know. Given how the world reacts to their exports (or lack of), what the Chinese government allows or disallows will matter significantly to the world.
- Europe (likely lower production rate for a while, gas costs worry me) - unfortunately, I do not list Europe as a "possible ramp up in production rates". Rather, we started to fear that we would lose MORE production. Gas values spiked and we heard that nitrate values were rising on the fear that if they didn't, further production stoppages would occur. Since that time, gas prices have calmed...but winter is not over. If prices start to spike again, we need to keep watch...
- India (market knows it is coming...but when) - talk about a head fake! It looked all but guaranteed that we would have heard India's much anticipated urea purchase tender by now. However, they have drug their feet and surprised the world. Unfortunately for them, they still need to buy and the world knows it. I am concerned for what values do when they finally do step in to purchase. Their purchase will be in direct conflict with a lot of other buyers.
- Proximity to spring (lot of demand still to come) - time is running out for the Northern Hemisphere. Spring season is rapidly approaching and most markets appear to be dragging their feet in high hopes that prices will slide. Every day the calendar turns a page is another day closer to farmers hitting the fields and while farmers do not like high prices, they dislike a lack of supply significantly more. The time for waiting games is over...
StoneX Ratio Calculation
The ratio calculation is derived from Bloomberg historical grains values as well as fertilizer values from StoneX, NPKFAS, and Argus.
The calculation is simply dividing the fertilizer price by each grain price.
All data was sourced from StoneX unless otherwise noted.




