May Seasonality Key Points
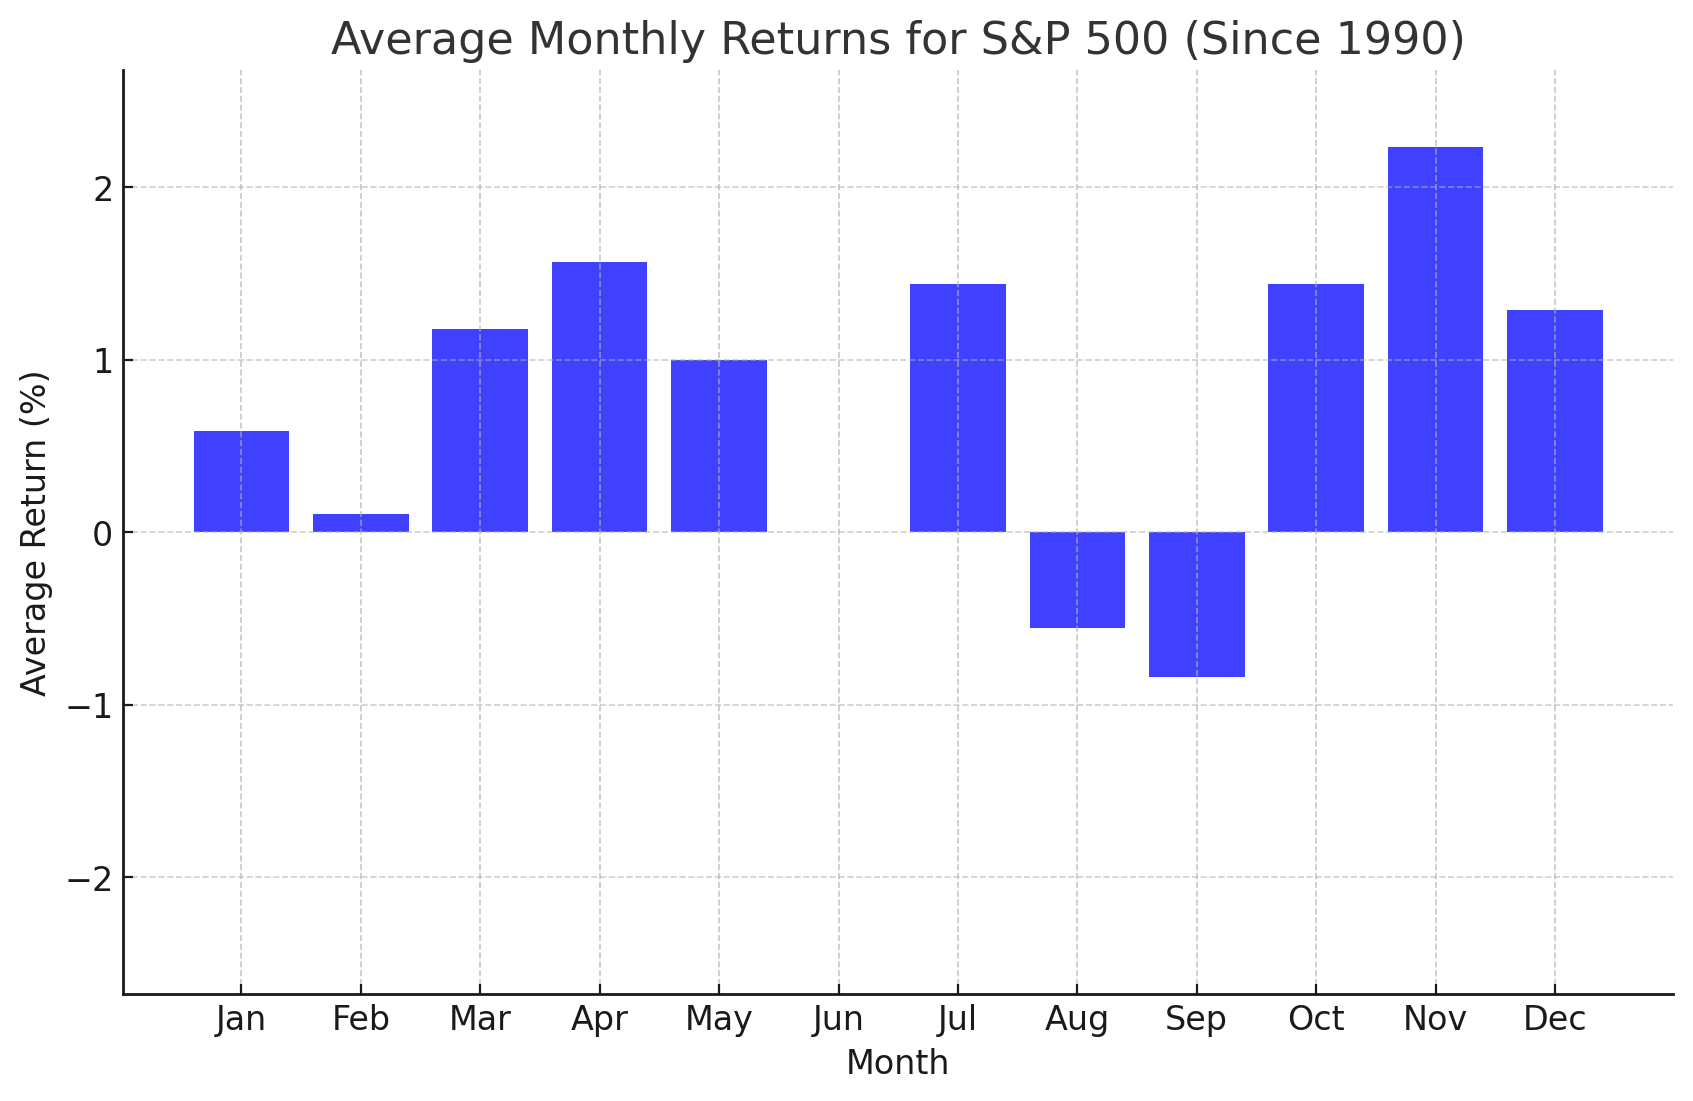
- Historically, May has been a solid if unremarkable month for US stocks, with the broad S&P 500 index sporting an average (price-only) return of +1.0% over the last 35 years.
- Gold traders are torn between viewing the metal as more of a “risk asset” vs. its more traditional “safe haven” role.
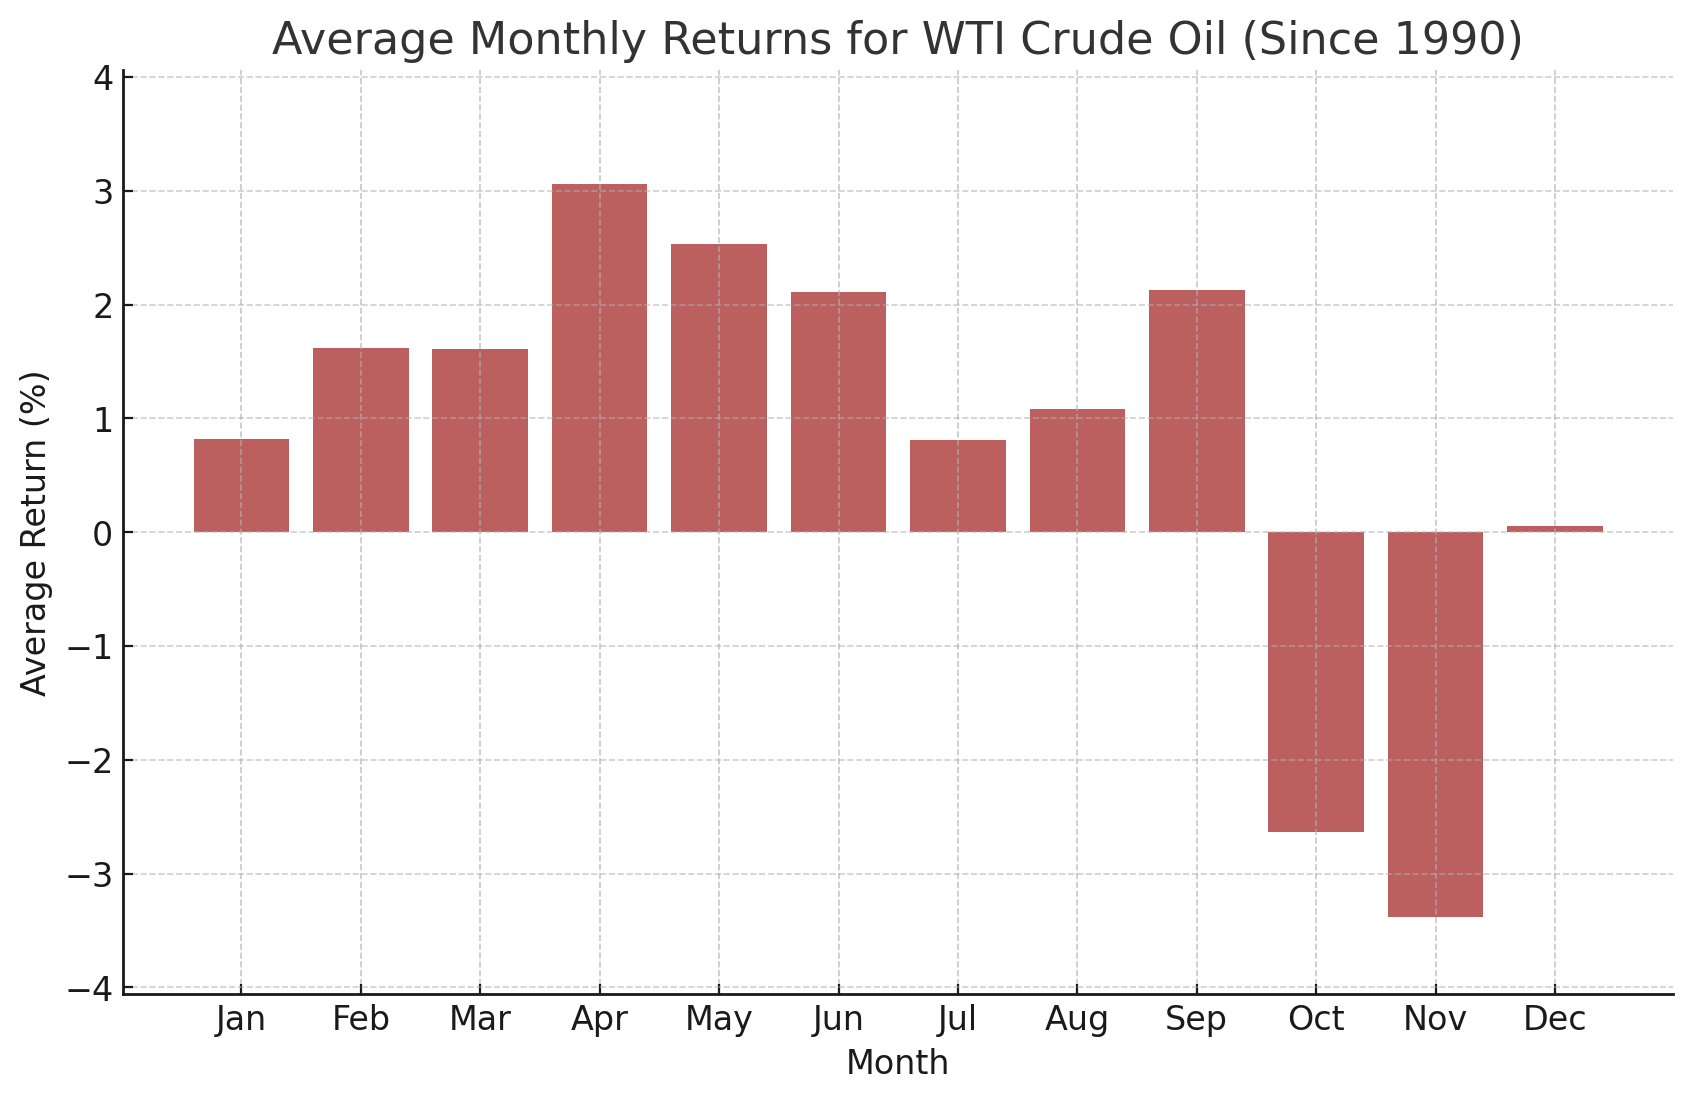
- WTI Crude Oil has historically seen positive performance in May, with an average gain of +2.5% over the last 35 years, though the status of the Strait of Hormuz is a far more significant driver in the current environment
The beginning of a new month marks a good opportunity to review the seasonal patterns that have influenced the markets since 1990.
As always, these seasonal tendencies are just historical averages, and any individual month or year may vary from the historic average, so it’s important to complement these seasonal leans with alternative forms of analysis to create a long-term successful trading strategy. In other words, past performance is not necessarily indicative of future results.
S&P 500 Seasonality – S&P 500 (Price-Only) Chart
 Source: TradingView, StoneX. Please note that past performance is not necessarily indicative of future results.
Historically, May has been a solid if unremarkable month for US stocks, with the broad S&P 500 index sporting an average (price-only) return of +1.0% over the last 35 years. The S&P 500 is coming off an incredible April, having gained +10.6% to hit fresh record highs as traders focused on strong earnings reports and guidance while ignoring the ongoing conflict in Iran. A small pullback or consolidation in May would be a healthy development heading into the summer doldrums, but the ongoing bullish momentum and back half of Q1 earnings season could keep any dips limited.
Nasdaq 100 Seasonality – NDX (Price-Only) Chart
Source: TradingView, StoneX. Please note that past performance is not necessarily indicative of future results.
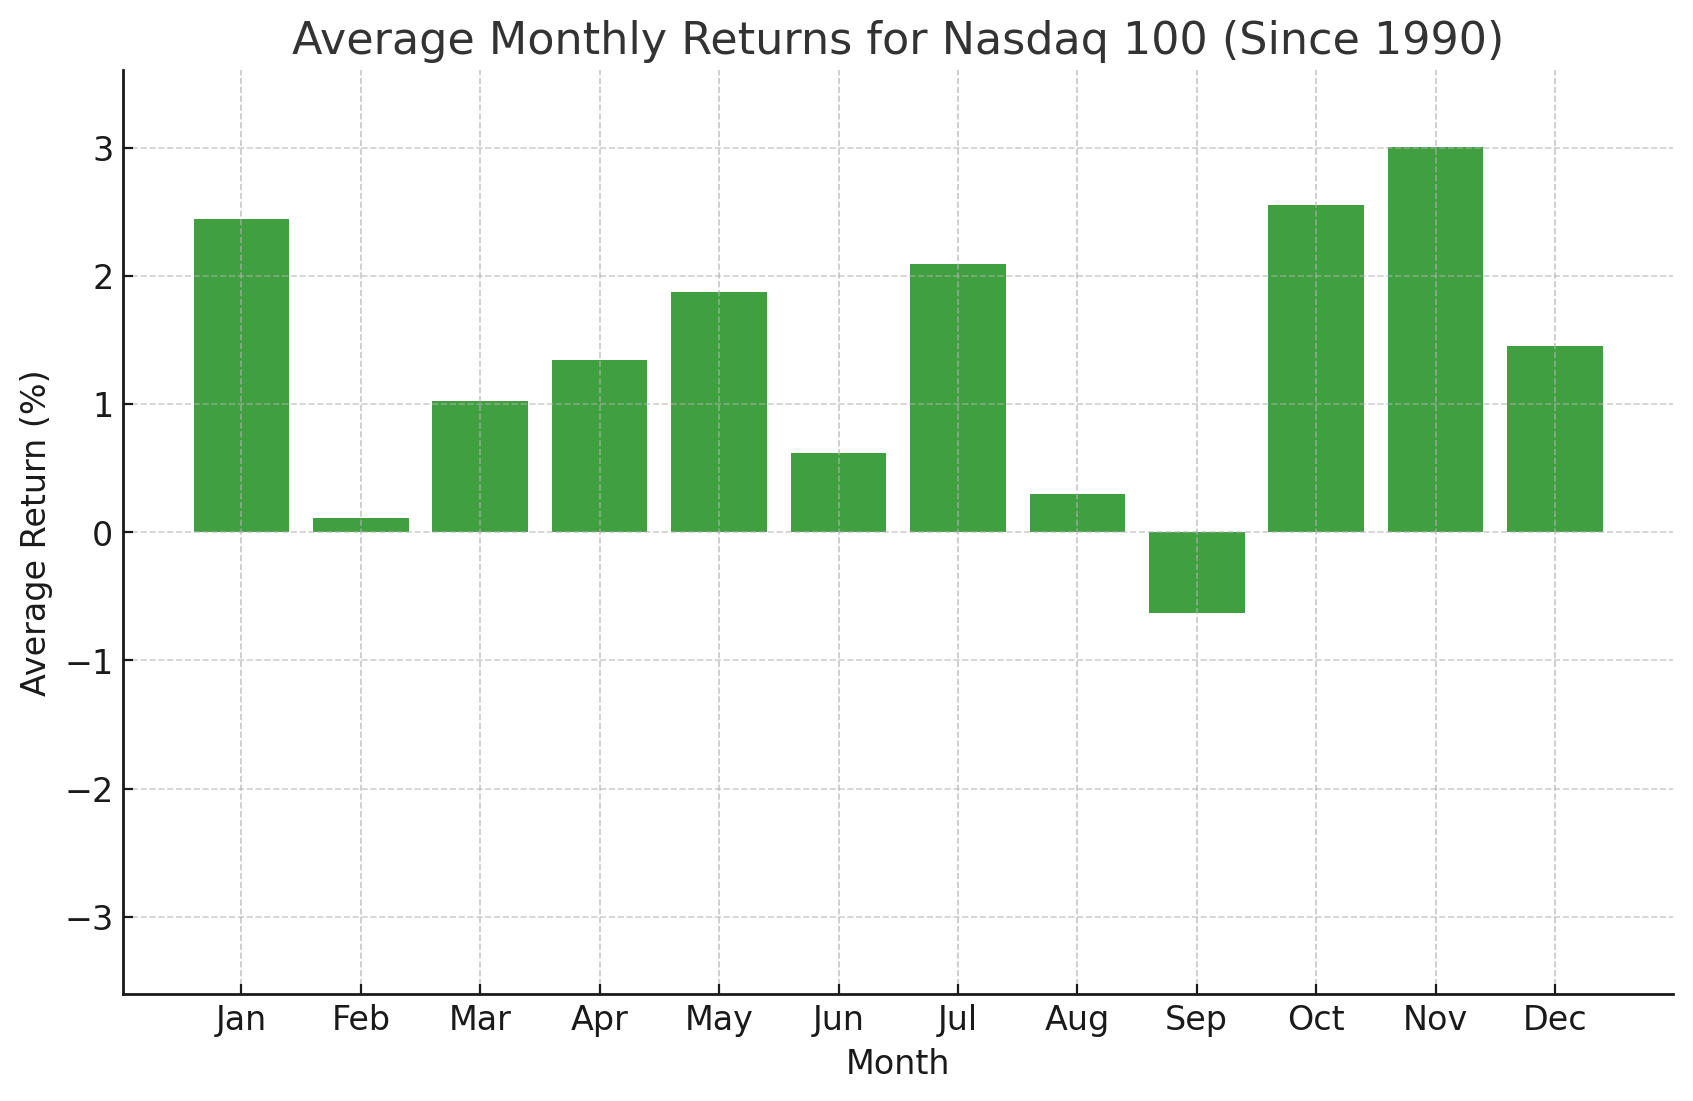
Looking at the above chart, the Nasdaq 100 has historically seen strong performance in May as well, to the tune of a +1.9% average gain since 1990. Like the S&P 500, the Nasdaq 100 rocketed to record highs last month, helped along by strong gains in Alphabet/Google (+34%) and Amazon (+27%) in particular. In addition to any consequential headlines out of the Middle East, Nvidia’s earnings on May 20 will be a major volatility catalyst to mark on your calendar later this month.
Volatility Index Seasonality – VIX Chart
Source: TradingView, StoneX. Please note that past performance is not necessarily indicative of future results.
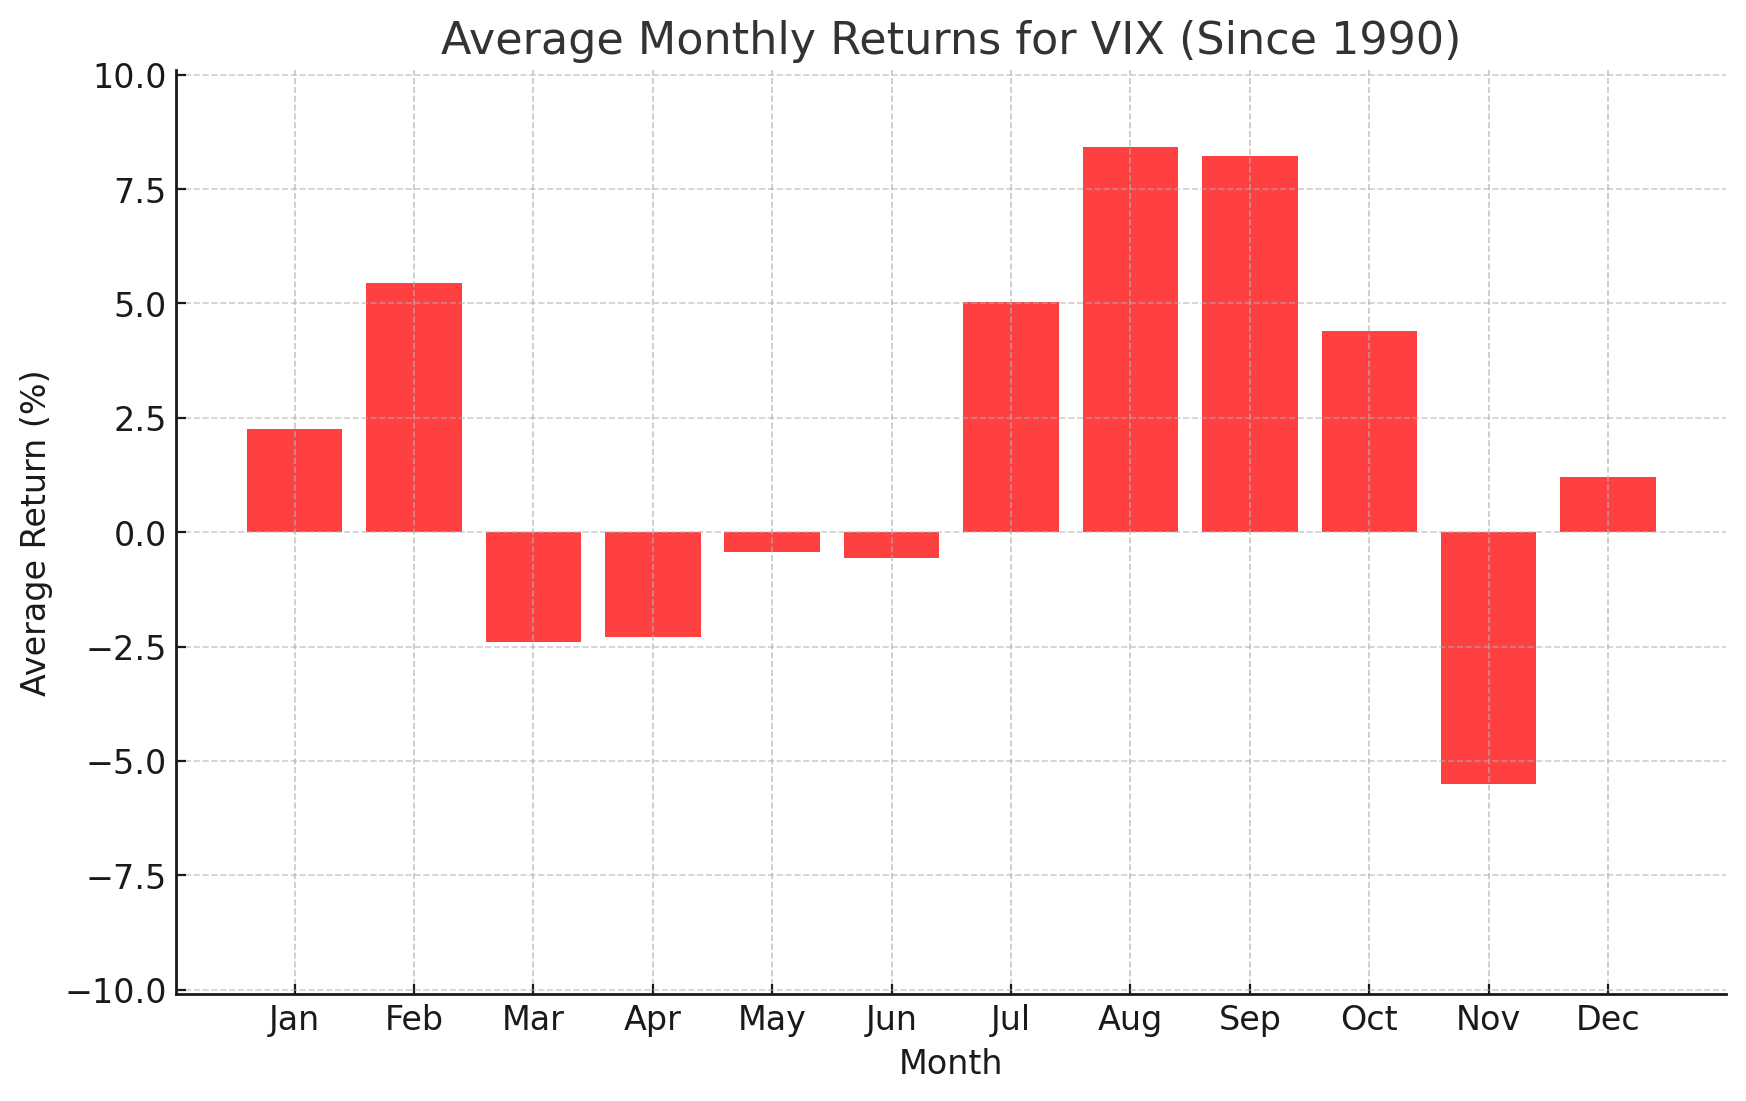
May has historically been a month where stock market volatility does not show a clear trend, with the VIX index falling by an average of -0.4% since 1990. The VIX fell 8 points across April as the hostilities in the Middle East simmered down, but the risk of escalation remains a wildcard that could lead to a spike in volatility as we navigate the month. In any event, it’s worth noting that markets have shown resilience in driving volatility back lower on any near-term surges as megacap earnings continue to grow at an impressive rate.
Gold Seasonality – XAU/USD Chart
Source: TradingView, StoneX. Please note that past performance is not necessarily indicative of future results.
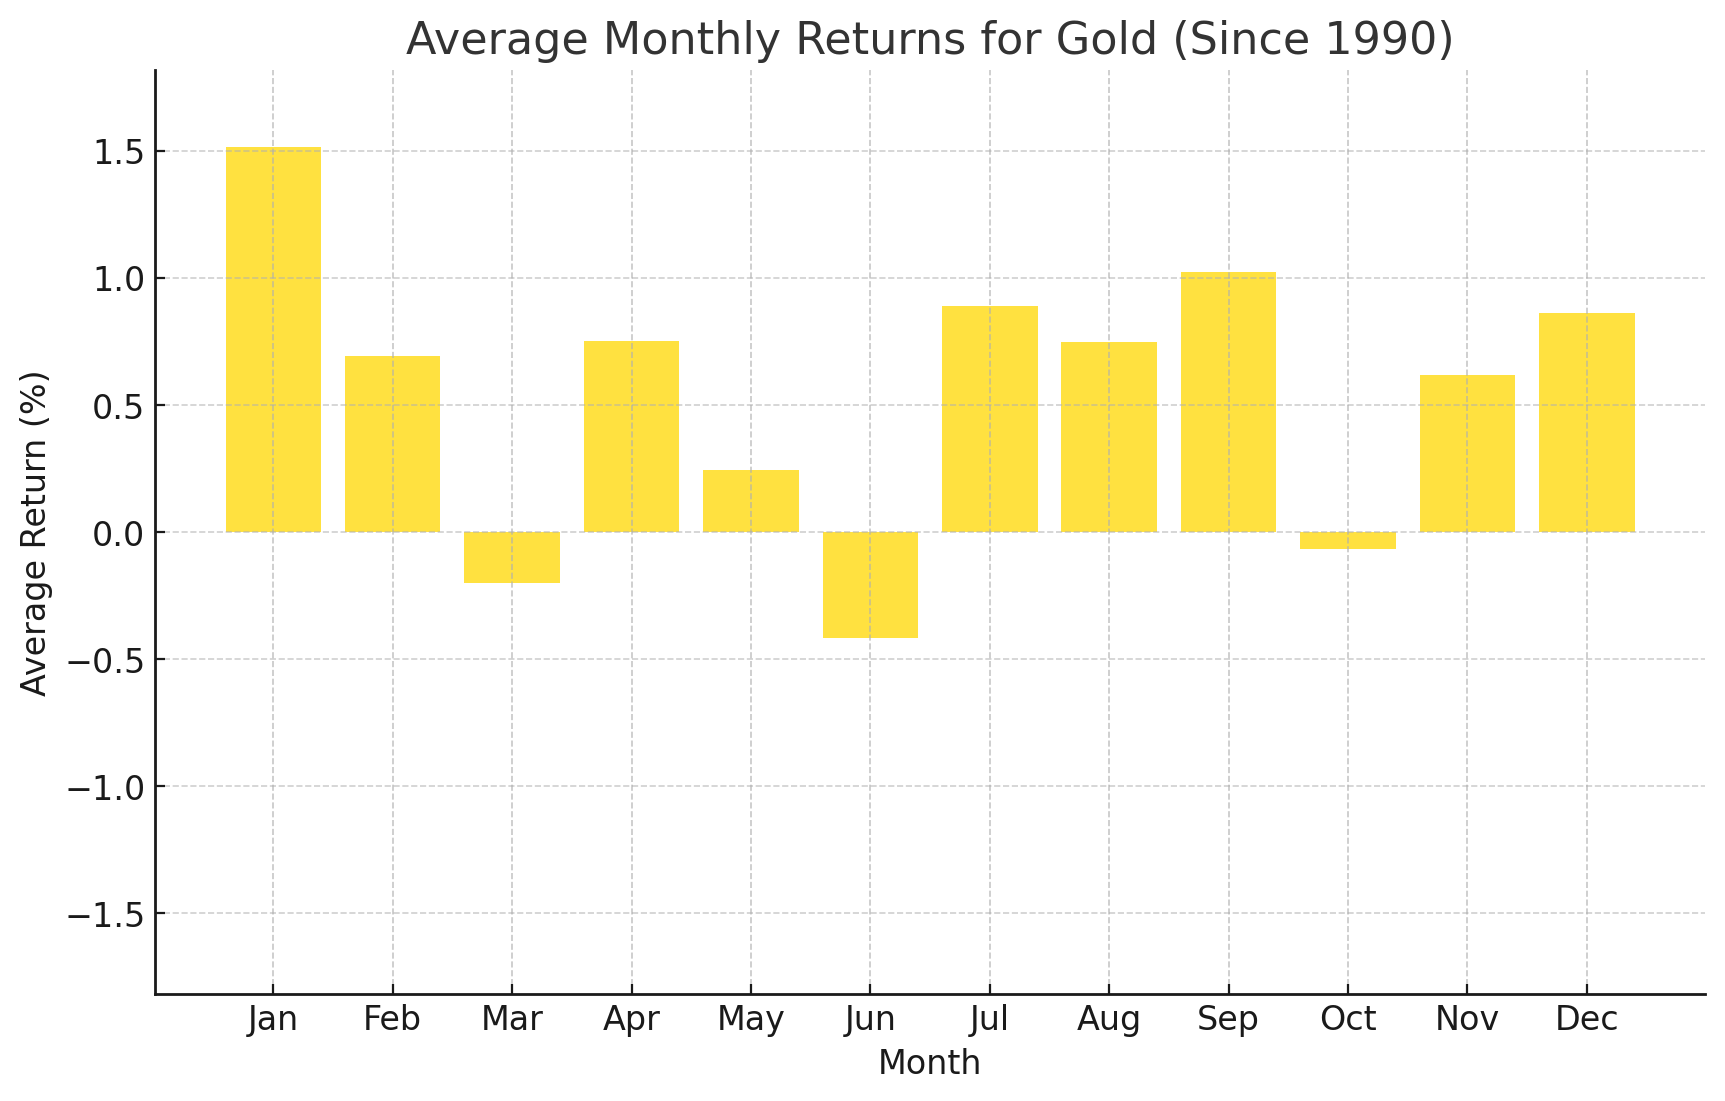
Turning our attention to commodities, May has historically been a modestly positive month for gold performance, with an average gain of +0.2% going back to 1990. Gold slipped a little over -1% in April as the prior bullish momentum dried up. After the big run higher throughout 2024 and 2025, traders are torn between considering it more of a “risk asset” that rallies along with rising sentiment or its more traditional “safe haven” role, and until a dominant framework emerges, gold may continue to march to the beat of its own drummer.
WTI Crude Oil Seasonality – WTI Chart
Source: TradingView, StoneX. Please note that past performance is not necessarily indicative of future results.
Last but not least, WTI Crude Oil has historically seen positive performance in May, with an average gain of +2.5% over the last 35 years. Oil was highly volatile in April, trading in a nearly $40 range between the mid-$70s and low $110s, ultimately finishing up a bit more than +3%. To be frank, the ongoing closure of the Strait of Hormuz is the dominant storyline for oil this month (and indeed, perhaps this whole decade), and the longer it remains functionally impassable, the higher oil prices are likely to go, regardless of the historical seasonal trends.
As always, we want to close this article by reminding readers that seasonal tendencies are not gospel so it’s important to complement this analysis with an examination of the current fundamental and technical backdrops for the major markets and the global economy.
-- Written by Matt Weller, Global Head of Research
Check out Matt’s Daily Market Update videos on YouTube and be sure to follow Matt on Twitter: @MWellerFX
StoneX TV content is created, produced, and distributed solely by StoneX Media Ltd (“StoneX TV”) and is provided for informational and educational purposes only. StoneX TV does not provide investment, financial, legal, or tax advice and does not make any recommendation or endorsement of any investment strategy, transaction, or financial instrument. Nothing in this content constitutes, or should be construed as, investment advice or a recommendation to buy, sell, or hold any financial instrument, including securities, futures, derivatives, digital assets, foreign exchange products, or CFDs. This content does not constitute an offer, invitation, or solicitation to engage in any investment activity. The information presented is general in nature and is not tailored to the financial situation, investment objectives, or risk tolerance of any specific person. You should not rely on this content as a substitute for independent professional advice. Investing and trading in financial instruments involves significant risk of loss and is not suitable for all investors. Past performance is not indicative of future results. Any views or opinions expressed are those of the presenter at the time of publication and are subject to change without notice. Such views may not necessarily reflect those of StoneX Media Ltd or its affiliates. StoneX Media Ltd and its affiliates, including StoneX Group Inc., may from time to time have positions in, or engage in transactions involving, the financial instruments referenced. This content may include general market commentary and opinion. It does not constitute independent investment research and has not been prepared in accordance with legal requirements designed to promote the independence of investment research. StoneX Media Ltd is not authorised or regulated to provide investment services and does not act in a fiduciary capacity. StoneX Media Ltd is incorporated in Ireland and operates in accordance with applicable Irish law. It is a wholly owned subsidiary of StoneX Group Inc. and is a separate legal entity from other subsidiaries within the StoneX Group, which may be regulated in various jurisdictions. StoneX Media Ltd does not act on behalf of, or provide services for, any regulated affiliate. This content is not directed at, and may not be distributed to, any person in any jurisdiction where such distribution would be contrary to local laws or regulations. Supporting documentation for any claims, comparisons, statistics, or technical data may be made available upon reasonable request, where applicable.