Rising geopolitical tensions linked to Trump’s renewed focus on Greenland saw gold and silver gap higher and push to fresh record highs during Asian trade. However, his threat to impose tariffs on countries blocking any move on Greenland opens a new chapter in the trade war — one primarily aimed at Europe, with serious implications for NATO. This rocky start to the year could continue to underpin demand for metals, and futures markets may eventually begin to reflect that risk rather than remain overly cautious.
View more of Matt’s analysis:
Commodity Futures Positioning: Gold, Silver, Copper, WTI Crude | COT Report
Cooling Inflation Isn’t Weakening the Dollar Yet
Why Diverging Rate Paths Put the Aussie in Focus
How Futures Positioning Is Shifting Across Metals and Oil
Gold Futures (GC)
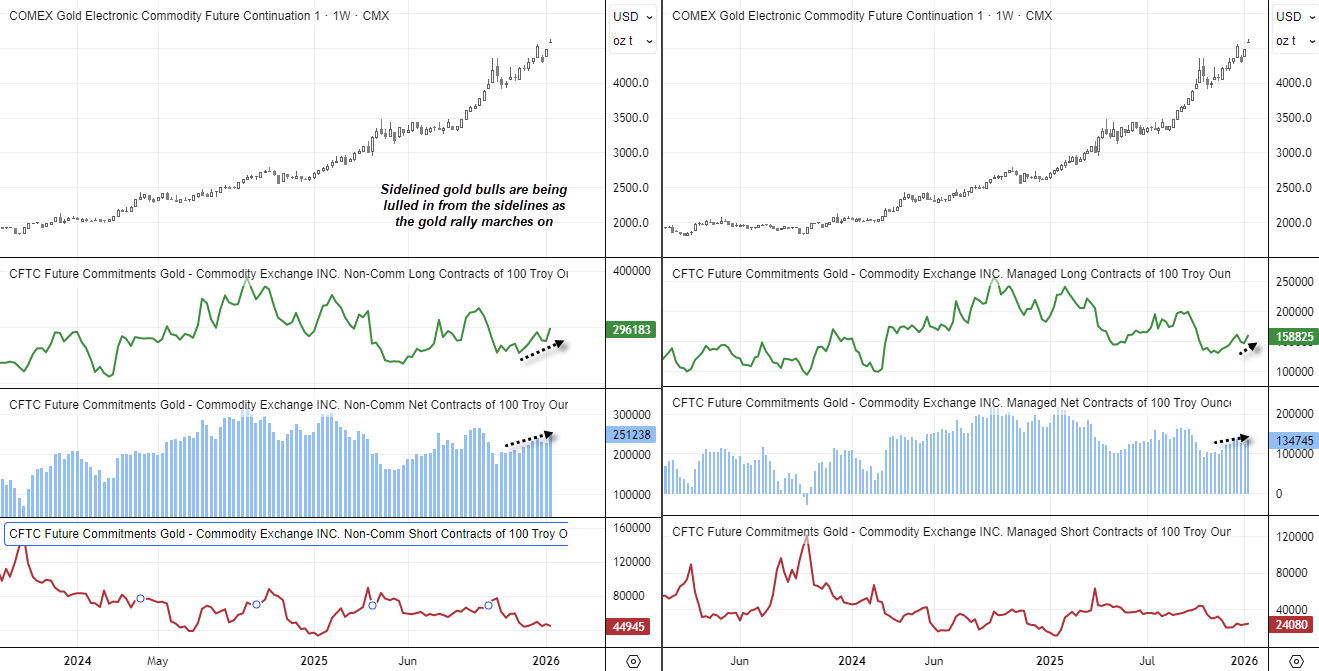
Managed funds increased net-long exposure by 11.5k contracts (9.4%) to push the 3-month percent rank of net exposure to range highs. Yet this is hardly a sentiment extreme given the lacklustre view form bulls, who risk reluctantly chasing prices higher unless price action says otherwise.
Silver Futures (SI)
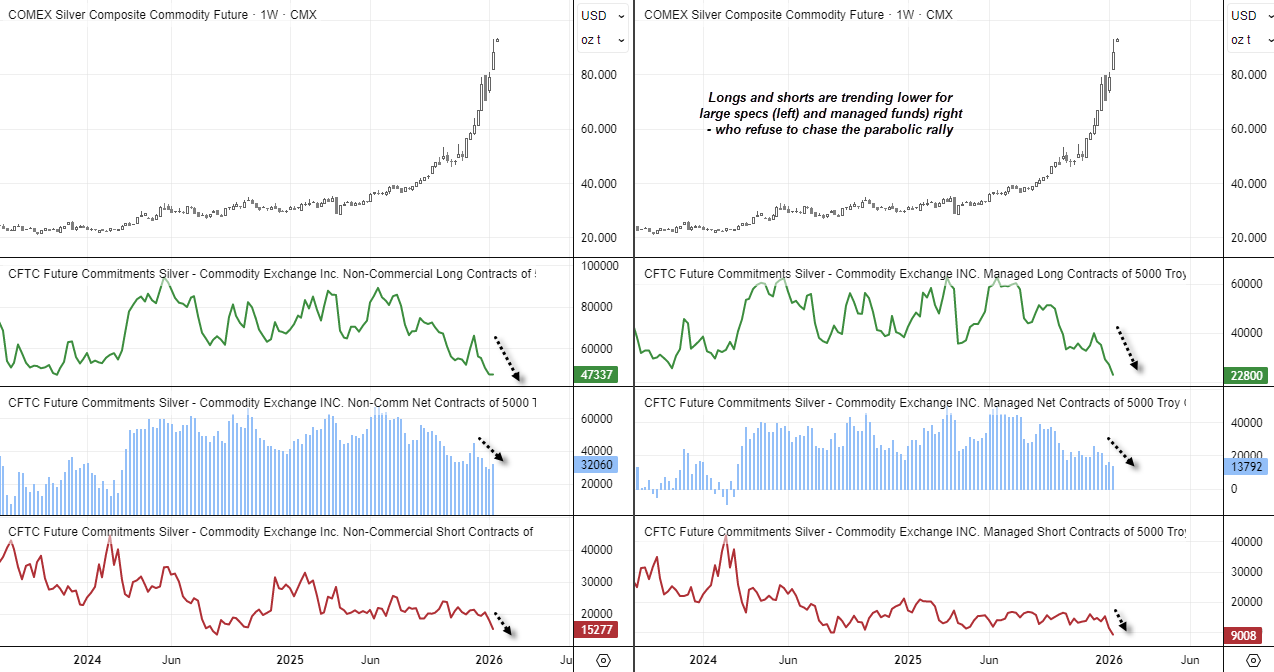
Net-long exposure fell to the least bullish level since February 2024 among managed funds, who are clearly in no mood to chase this parabolic rally on prices
Copper Futures (CI)
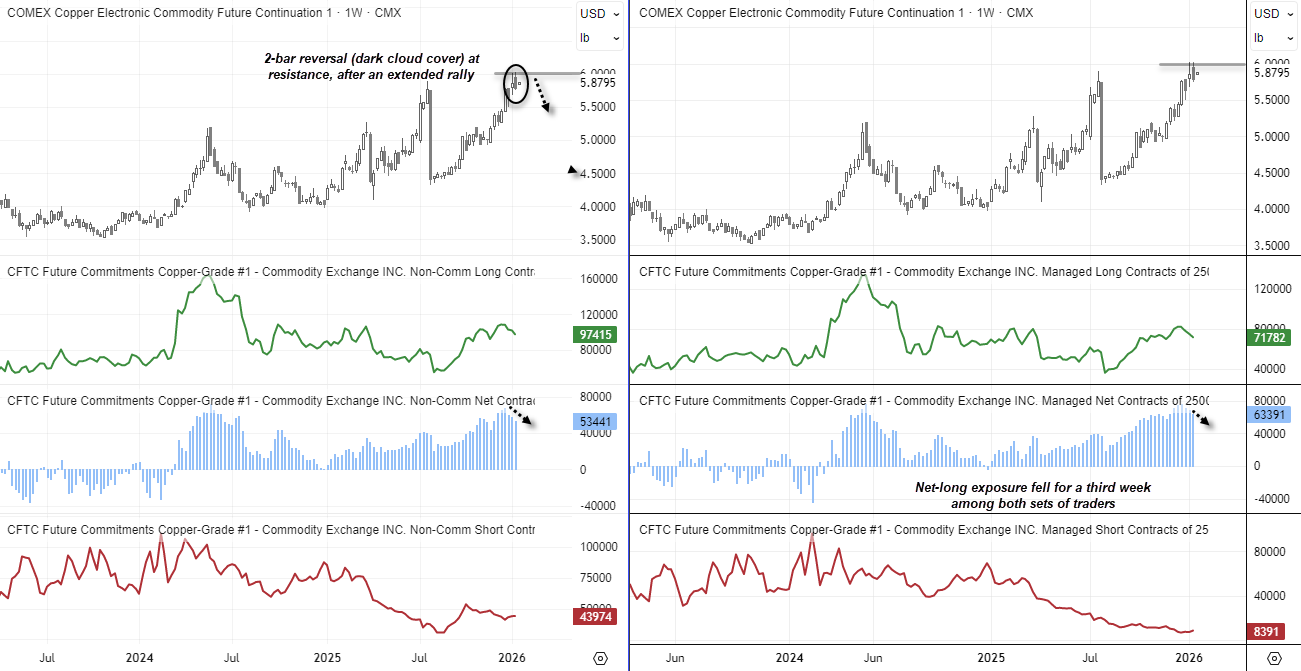
Managed funds decreased their net-long exposure to copper futures for a third week, down from its 5-year high. Price action also suggests its rally may have become too ‘long’ in the tooth.
WTI Crude Oil (CL)
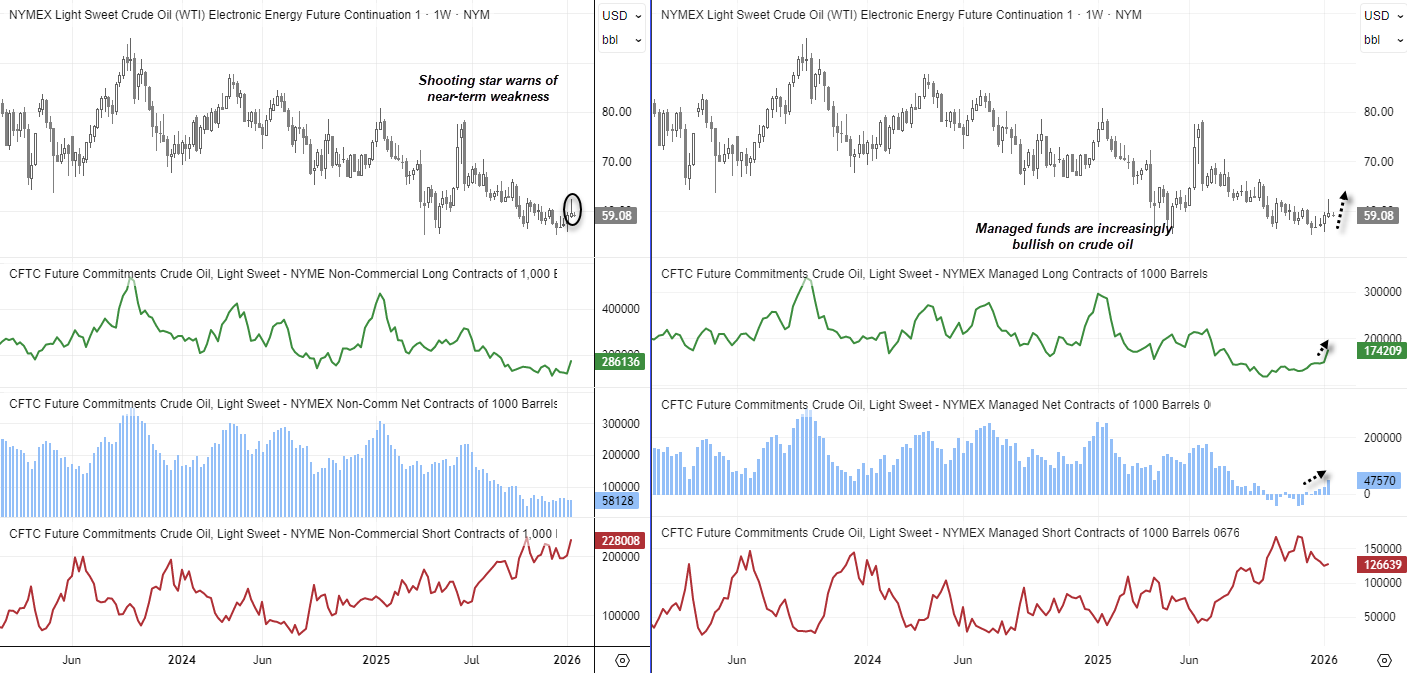
Managed funds increased their net-bullish exposure to a 23-week high, driven primarily by an increase of gross longs

Charts prepared by Matt Simpson – Data Source: CME, CFTC, LSEG
Gold (GC) Futures Positioning | COT Report
Net-long exposure rose by a combined 35.1k contracts between large speculators and managed funds last week. Primarily driven by a notable rise of gross-long exposure, large specs added 27.7k contracts (7.9%) and managed funds added 12.4k contracts (8.5%).
Gold bulls appear to be stepping in from the sidelines and chasing strength as the rally extends.
Unlike silver, gold volatility has not surged alongside prices, suggesting the move remains relatively orderly. And with geopolitical tensions rising, I suspect gold prices could continue higher and lull bulls from the sidelines.
Source: CME, CFTC, LSEG
Silver (CI) Futures Positioning | COT Report
Silver’s surge continues, with prices hitting another record high in early Asian trade following weekend headlines around Trump’s tariffs and Greenland. However, unlike gold, silver has already slipped back below its highs — an early sign that upside momentum may be tiring.
Trying to call a precise top in such a market is a mug’s game. Even so, the rally appears close to at least a pause, if not a corrective pullback. Net-long exposure among large speculators and managed funds has been trending lower since peaking in June, signalling a reluctance among futures traders to chase this parabolic move — even as they remain more comfortable doing so in gold.
Volumes among both large speculators and managed funds have also eased, reinforcing the view that this rally lacks fresh speculative commitment. From a positioning perspective, I am content to sit this one out. Bulls may well be waiting at lower levels after some consolidation, but markets rarely move in a straight line without inflicting some pain along the way.
Source: CME, CFTC, LSEG
Copper (HG) Futures Positioning | COT Report
Copper’s futures positioning is sending a relatively clean signal. Despite an extended rally in spot prices, net-long exposure has fallen for a third consecutive week from elevated levels among both large speculators and managed funds. That divergence suggests upside momentum may be tiring.
Adding to the caution, a two-bar bearish reversal pattern (dark cloud cover) has formed on the weekly chart near the 6,000 level, reinforcing the risk of a near-term pullback.
Source: CME, CFTC, LSEG
WTI Crude Oil (CL) Futures Positioning | COT report
Net-long exposure among large speculators is effectively flat, despite both gross longs and shorts rising — making positioning signals harder to interpret. Managed funds, however, are sending a clearer message. Net-long exposure has climbed to a 21-week high and has increased for a fourth consecutive week.
Importantly, this build has been driven by rising gross-long exposure while shorts remain flat and well below their highs. That suggests managed funds may be positioning to buy dips rather than chase strength. The shooting-star candle formed last week warns of a near-term inflection point, so they may soon get that opportunity.
Source: CME, CFTC, LSEG
Commitment of traders FAQs
What is the COT report?
The Commitments of Traders, or COT, report is a weekly publication that shows the aggregate holdings of different participants in the US futures market. It provides a snapshot of trading commitments as of Tuesday of that week in order to increase the transparency of exchanges.
COT reports are used across markets, so you’ll be able to obtain reports on forex, gold, indices and more.
How do you read the Commitments of Traders report?
The Commitments of Traders report is read in tables, in which each row will tell you the market and each column looks at the open interest, long positions and short positions. You’ll also be able to see which actors have taken positions, including dealers, institutions or funds.
The COT is a key data source for traders, as it can provide guidance on whether to go long or short on each market.
What is the COT report release time?
The COT report is released every Friday at 15:30 Eastern Time on the CFTC website. That’s 20:30 GMT or Saturday at 7:30 AEST. We provide up-to-date coverage of the COT report so that you can get expert analysis each week, as quickly as possible.