Consumer confidence and spending in the United States dropped last month according to Friday data, which poses a threat to confidence built on resurgent AI interest and rate throttling hopes. And yet, market seem comfortable with keeping to seasonal norms and weeks of steady sailing…
Talking Points:
US retail sales dropped in July while the UofM’s consumer sentiment survey dove on concerns of inflation…yet the S&P 500 closed just off record highs
Bulls are trying to hold on AI while bears see economic hardship from the ongoing US-Iran conflict, but the seasonal expectations seem to hold the greatest control
There is notable top event risk on tap over the coming week – like Japan GDP, multiple countries’ CPI updates, August PMIs and more – but none of it reads as a singular catalyst
Watch the Full Video
Conditions Continue to Pad ‘Confidence’ As We Enter a Well-Known Calm
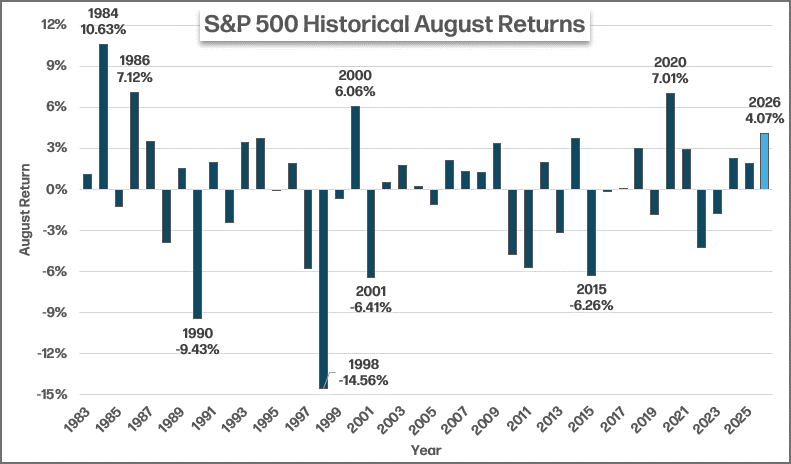
Sentiment is still firmly set in the ‘risk on’ camp. Whether you reference the S&P 500’s touch of a fresh record high this past week, a breadth of positive performance across assets on the return-seeking side of the spectrum, the CNN’s Fear & Greed Index in the ‘greed’ or any number of colloquial measures; the signal remains the same. That said, that bearing does not carry with it a quality of momentum. Progress remains notably restricted and tempo is broadly uneven – whether you are comparing close cousins like S&P 500 and Dow Jones Industrial Average or less standard fare like the EEM and Bitcoin. In part, that limit on conviction likely reflects the very uneven fundamental backdrop, but the throttling likely draws even more heavily from the limitations of participation. Volume on the S&P 500 this past week was the lowest since the week of December 29th. That is generally expected as August averages the quietest month of the year – though the 4 percent advance thus far in 2026 would put it on pace for the second best showing in a quarter of a century.
Chart of the S&P 500’s Month of August Performance 1983 to Present Source: Standard & Poor’s; John Kicklighter
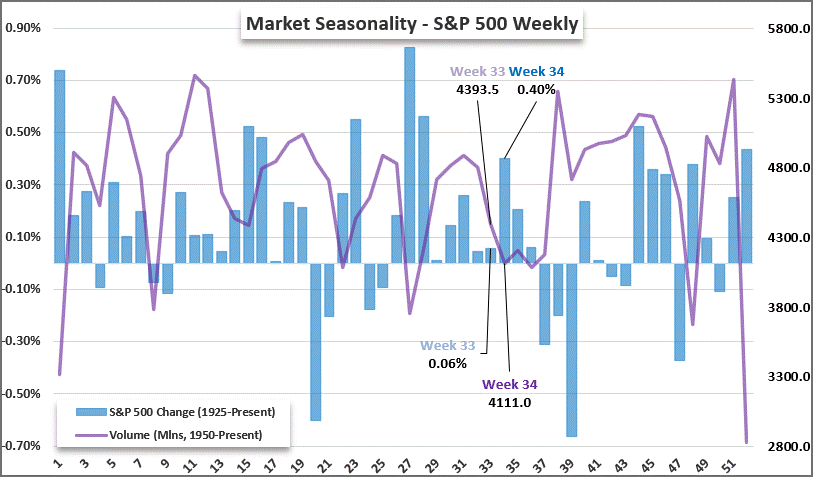
The seasonality factor that can fend off emergent or resurgent fundamental concerns can also restrict progress on a bullish bias. That is important to factor in when we see developments like the S&P 500’s break above 7,600 on August 4th or assume outlier preference on discounted semiconductor or hyperscaler benchmarks for example. It is not that these developments cannot attract more capital to buoy the markets further, but there will be a persistent headwind to contend with. This is particularly true as we move into the 34th week of the year. This week through the 37th week of the calendar year has averaged the extended doldrums that last longer than the brief holiday-capped periods for liquidity – such as the Independence Day, Thanksgiving or year-end holidays. However, as we watch the drift, it is worth watching the quality of exposure behind sentiment to see what we will deal with when market depth is fully restored. While there is some modest opening of breadth in sentiment, there is an even stronger shift in the speculative reach of the still-active trading part of the market. Options volume measured by the CBOE continues to trend persistently higher while FINRA’s investor credit has reported a record amount of leverage being used. These do not speak to a solid backdrop should trouble start to brew at the surface.
S&P 500 Historical Performance and Volume Averaged by Calendar Week Source: Standard & Poor’s; John Kicklighter
Taking Stock of the Top Two Fundamental Themes Waiting in the Wings
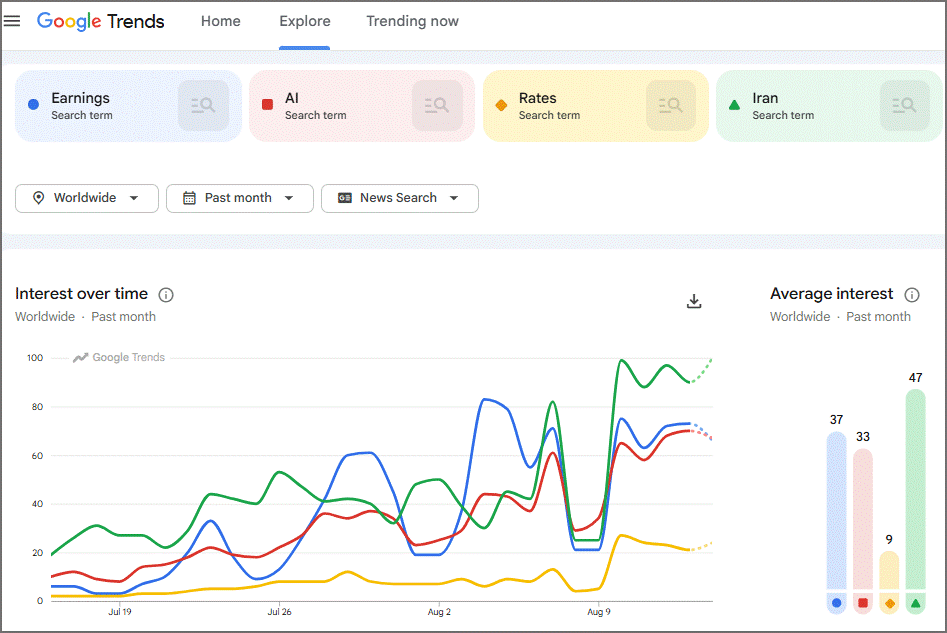
While the expectations of stability-through-seasonality are well founded, it is always possible that this is an outlier August such as 2020 (Pandemic liquidity), 2015 (China Yuan devaluation), 2000/2001 (Dot-com boom and bust) or 1998 (Asian Financial Crisis). There is always the possibility that key parts of the market – or the entire financial system – can find conviction through a uniquely influential fundamental driver. And, that high potential should encourage us to remain vigilant even against a lower probability. It is worth starting with the greater risk to a heavily skewed ‘bullish’ world, so what are the most prominent threats in the wings? Earnings disappointment is still a possibility, but we are well past the peak of the season. Concern over the effects of a feared interest rate hike epoch has been throttled as inflation data has wobbled and we are in a dry period for major central bank updates. Through scenario analysis, the US-Iran conflict has the greatest potential to cause more damage – though whether it turns into an active market driver remains to be seen. While the VIX remains low and WTI and Brent are holding below $90, energy prices closer to the consumer (gasoline, heating oil, etc) continue to rise. What’s more, the always-volatile rhetoric is once again taking a dive into the weekend. President Trump has threatened to take over the Strait of Hormuz and warned he would not take mid-terms into his calculus on whether to escalate against Iran again. From a quantitative perspective, Google News interest in ‘Iran’ are back up to their highest levels since June.
Worldwide News Search for Key Themes Via Google Trends Source: Google Trends; John Kicklighter
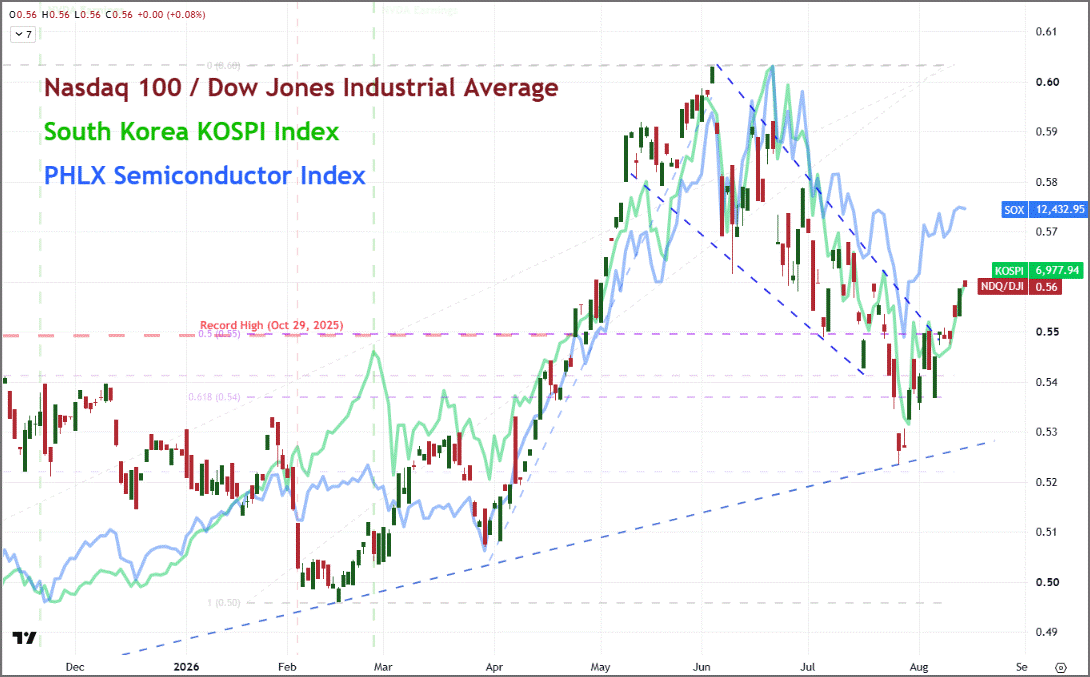
Not all scenarios are fodder for the bears to mull over. There are still potential lights to carry speculative appetite – particularly in already-active areas of the market. In particular, the rebound in AI-related measures these past few weeks has been a held out as evidence that there is untaped confidence still to carry us through a steadfast climb across August. While the spending habits on AI infrastructure are still extraordinary and discussion around the likelihood of energy bottlenecks are gaining more traction, there seems a willingness to indulge the ‘promise’ of the technology. There are many measures of this theme, but the SOX (PHLX Semiconductor Index), Korean KOSPI Index and Nasdaq 100 (particularly relative to the Dow) are all strong reflections of the drive. Comparing their performance relative to other traditional sentiment plays will help reflect on how deep the conviction actually runs.
Chart of Nasdaq 100-Dow Ratio, KOPSI Index and PHLX Semiconductor Index (Daily) Source: TradingView.com; John Kicklighter
Plenty of Important Data But No Standouts with Omnipotent Potential
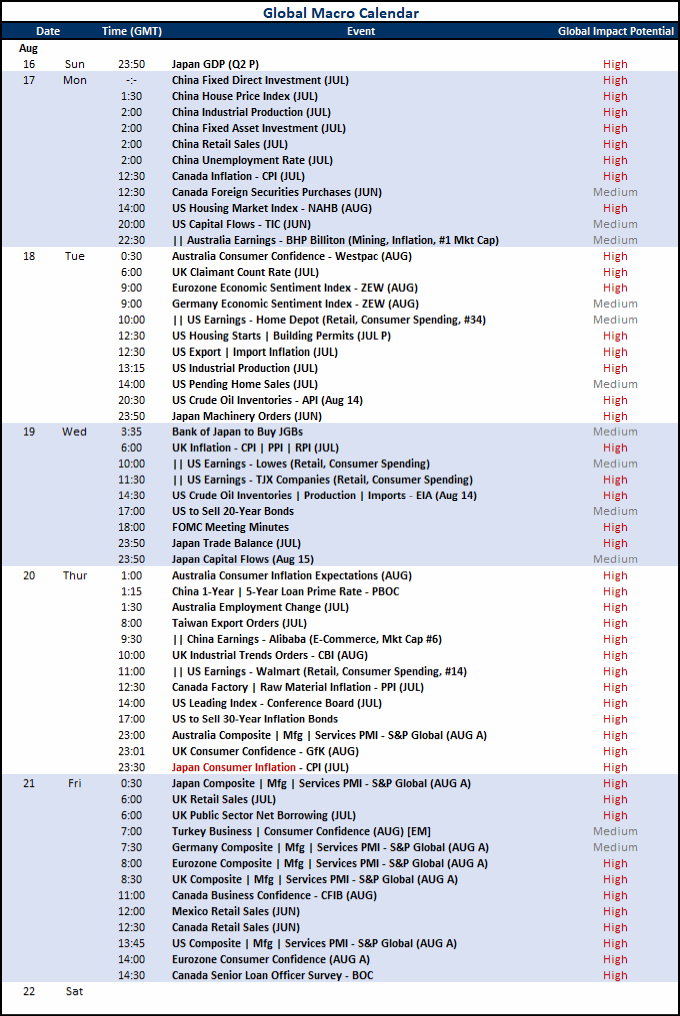
If we were to give a grade to the potential of the traditional global macro docket next week, I would set its capacity to jump start a worldwide sentiment trend at ‘low’. There are plenty of bright spots on the calendar with localized market-moving potential with certain outcomes, but there is no particular listing that could single-handedly change the weather patterns of the broader markets. Paired with a shifting preference in themes driven more by headlines than updates, and the bar for triggering a traditional fundamental-led move looks to be set exceptionally high. That said, there are certain segments that may find a well-placed update can translate into localized volatility. Japan’s docket is spread out with meaningful listings (GDP, trade, CPI) while the criticism of interventionist policies on the Yen continue to build. Flipping the technical cue seeking a capable event spark, the DXY Dollar Index has carved out its smallest 9-day range since February 2020 with the second lowest 9-day ATR (volatility) reading back to the same point. It is a scenario seemingly ripe for a break – direction dependent on the spark – but dated housing data, capital flow, industrial production stats among other fodder seems ill equipped for a definitive punch.
Calendar of Major Macro Economic Event Risk Source: John Kicklighter
With Consumers Struggling, Top Consumer Company Earnings Need Tending
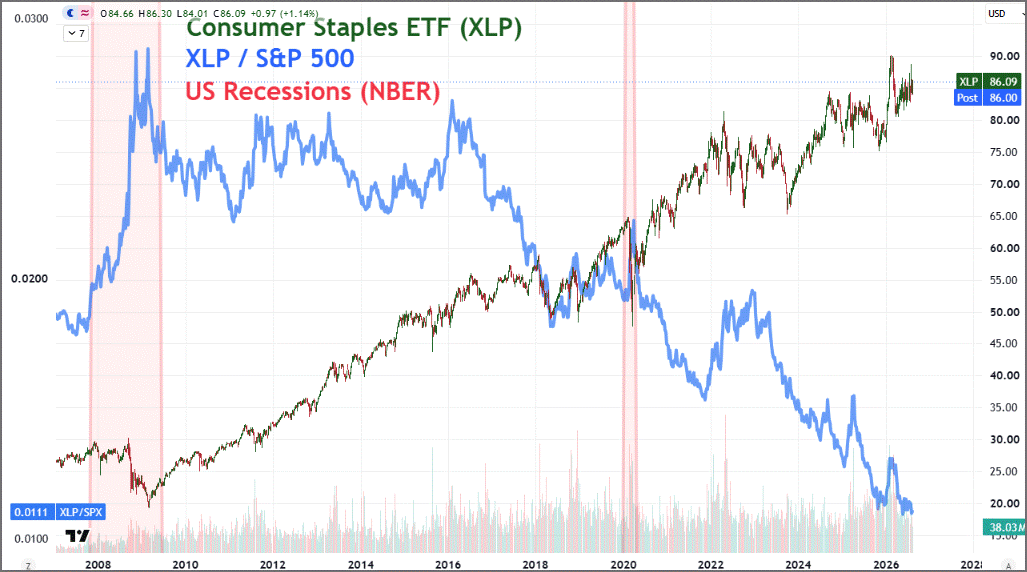
Highlighting the event risk that may potentially rise to the occasion of being a global axis shift, the US earnings season may offer one of its last universally-relevant updates until the cycle starts anew in mid-October. Before we cast our attention on the performance of the market’s favored AI apostle, Nvidia, this week’s calendar offers performance reports by some of the biggest names for on consumer spending. Following Friday’s report of the drop in US retail sales in July and the University of Michigan’s cut short recovery in consumer confidence from a record low just months before, there is a heightened awareness around the health of a group that accounts for approximately 18 percent of global GDP (comparing US personal consumption to global nominal GDP). On tap, we have Home Depot on Tuesday and TJX Companies, Target and Lowe’s on Wednesday. The weight of theme, however, sits with Walmart reporting on Thursday. And, as a bonus fundamental comparison, China’s largest retailer, Alibaba, will also be reporting that day. This can offer a useful assessment of how far along China is in its effort to shift from export-dependent growth to domestic stability.
Chart of SPDR Consumer Staples ETF, XLP-S&P 500 Ratio and US Recessions (Weekly) Source: TradingView.com; State Street; Standard & Poor’s; NBER; John Kicklighter
Across a Range of Inflation Figures – The UK and Japan’s Stats are Potent
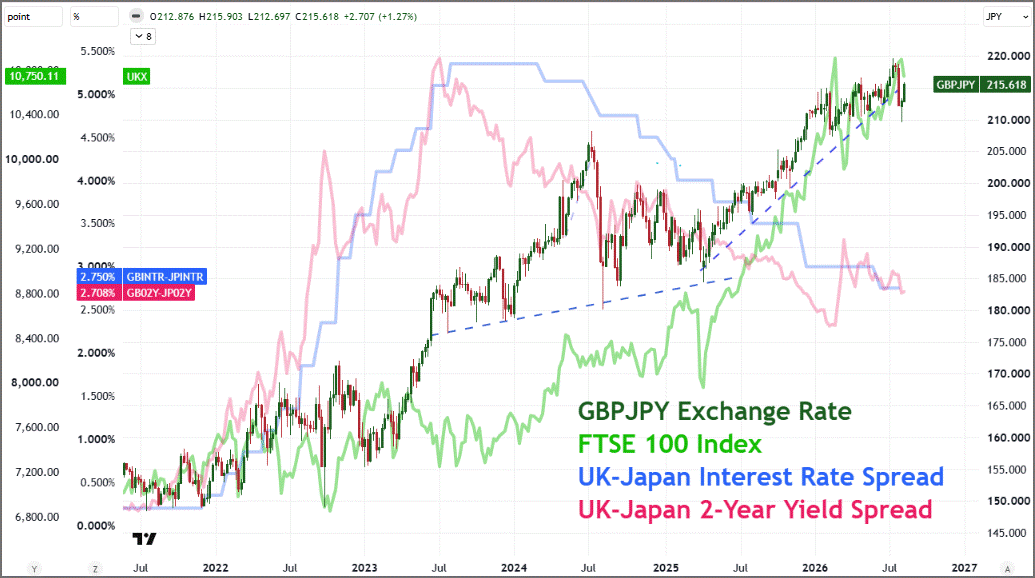
Another theme to highlight in the economic calendar is the further update around global inflation trends as the situation in the Strait of Hormuz threatens to ramp up downstream energy costs in August. Through the week, we have inflation readings due from Canada, New Zealand, Germany, Hong Kong, South Korea and even the US (inflation, export prices). All of it individually and collectively insightful, but less market moving – the US stats already discounted as extreme with added trade war pressure. The highlights from this run are the readings from the UK (Wednesday’s CPI, PPI and RPI) and Japan (Friday’s CPI). Both countries are at the mercy of foreign energy demands but there are some unique monetary policy factors. The BOE has not hiked rates in three years despite many of its global counterparts responding to resurgent price pressures this year. Yet, where the UK has headline readings consistently above 2 percent for the past two years, Japan’s dalliance with positive inflation throttled in 2026. And yet, amid failed intervention efforts on behalf of the yen, arguably, the only reliable solution the BOJ has in its arsenal is higher interest rates to reversal capital draining carry flows.
Chart of GBPJPY Overlaid with FTSE 100 and UK-Japan Rates, Yields (Weekly) Source: TradingView.com; John Kicklighter
Perhaps Now We Will Pay Closer Heed to Timely Economic Figures?
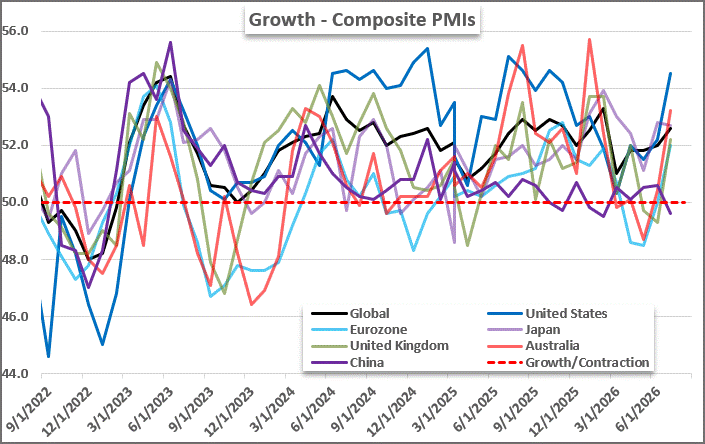
A final, rounded fundamental theme through the week ahead is the update on economic activity due on behalf of the largest developed world economies. As far as an insightful update, the S&P Global PMIs are timely (August estimates) and broadly indicative (collectively representing nearly 50 percent of global GDP even before China’s contributions are added a few weeks later). That said, the market-moving capabilities of this data run is more often ‘miss’ than it is ‘hit’. Assessments of the economy tend to move very slowly and there is a tendency to skew optimistic when evaluated from a market’s perspective. That said, if this past week’s US consumer data stirred deeper concern – which doesn’t seem the case in ‘recession’ predictions in yield spreads or prediction markets – then a scenario of meaningful declines across the board may add traction to a more traditional macro current.
Chart of Major Economies’ Composite PMI Figures (Monthly) Source: Standard & Poor’s; John Kicklighter
Access More Global Macro Insights, Forecasts and Tools
Stay connected to timely global macro analysis designed to help market participants navigate shifting economic conditions and evolving risk. Gain access to regular market commentary, updated quarterly forecasts, a comprehensive two-week forward economic event calendar, and specialized tools built to support informed trading and risk management decisions.
StoneX TV content is created, produced, and distributed solely by StoneX Media Ltd (“StoneX TV”) and is provided for informational and educational purposes only. StoneX TV does not provide investment, financial, legal, or tax advice and does not make any recommendation or endorsement of any investment strategy, transaction, or financial instrument. Nothing in this content constitutes, or should be construed as, investment advice or a recommendation to buy, sell, or hold any financial instrument, including securities, futures, derivatives, digital assets, foreign exchange products, or CFDs. This content does not constitute an offer, invitation, or solicitation to engage in any investment activity. The information presented is general in nature and is not tailored to the financial situation, investment objectives, or risk tolerance of any specific person. You should not rely on this content as a substitute for independent professional advice. Investing and trading in financial instruments involves significant risk of loss and is not suitable for all investors. Past performance is not indicative of future results. Any views or opinions expressed are those of the presenter at the time of publication and are subject to change without notice. Such views may not necessarily reflect those of StoneX Media Ltd or its affiliates. StoneX Media Ltd and its affiliates, including StoneX Group Inc., may from time to time have positions in, or engage in transactions involving, the financial instruments referenced. This content may include general market commentary and opinion. It does not constitute independent investment research and has not been prepared in accordance with legal requirements designed to promote the independence of investment research. StoneX Media Ltd is not authorised or regulated to provide investment services and does not act in a fiduciary capacity. StoneX Media Ltd is incorporated in Ireland and operates in accordance with applicable Irish law. It is a wholly owned subsidiary of StoneX Group Inc. and is a separate legal entity from other subsidiaries within the StoneX Group, which may be regulated in various jurisdictions. StoneX Media Ltd does not act on behalf of, or provide services for, any regulated affiliate. This content is not directed at, and may not be distributed to, any person in any jurisdiction where such distribution would be contrary to local laws or regulations. Supporting documentation for any claims, comparisons, statistics, or technical data may be made available upon reasonable request, where applicable.
Discover more insights
Our subscribers have access to comprehensive market analysis from StoneX spanning commodities, equities, currencies and more.
Our market expertise, advanced platforms, global reach, culture of full transparency and commitment to our clients’ success all set us apart in the financial marketplace.
Reach
With access to 40+ derivatives exchanges, 180+ foreign exchange markets, nearly every global securities marketplace and numerous bi-lateral liquidity venues, StoneX’s digital network and deep relationships can take clients anywhere they want to go.
Transparency
As a publicly traded company meeting the highest standards of regulatory compliance in the markets we serve; our financials and record of accomplishment are matters of public record. StoneX’s commitment to “doing the right thing over the easy thing” sets us apart in the industry and helps us build respect, client trust and new partnerships.
Expertise
From our proprietary Market Intelligence platform, to “boots on the ground” expertise from award-winning traders and professionals, we connect our clients directly to actionable insights they can use to make more informed decisions and achieve their goals in the global markets.