

The intention of the below graphs are not to use to say "my price should be X based on this graph". These prices are derived from an FOB price point average. The intent is to show major global price movement trends. Your values will likely have significant basis difference (similar to your local grain price being different than the traded market price).
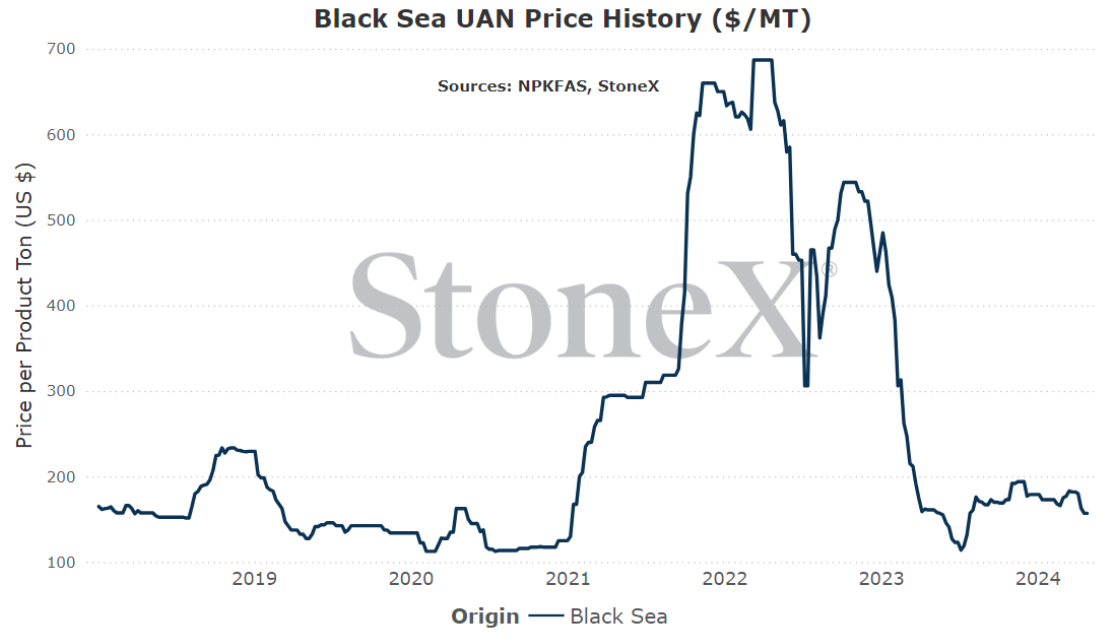
This graph is labeled as MT in USD currency.
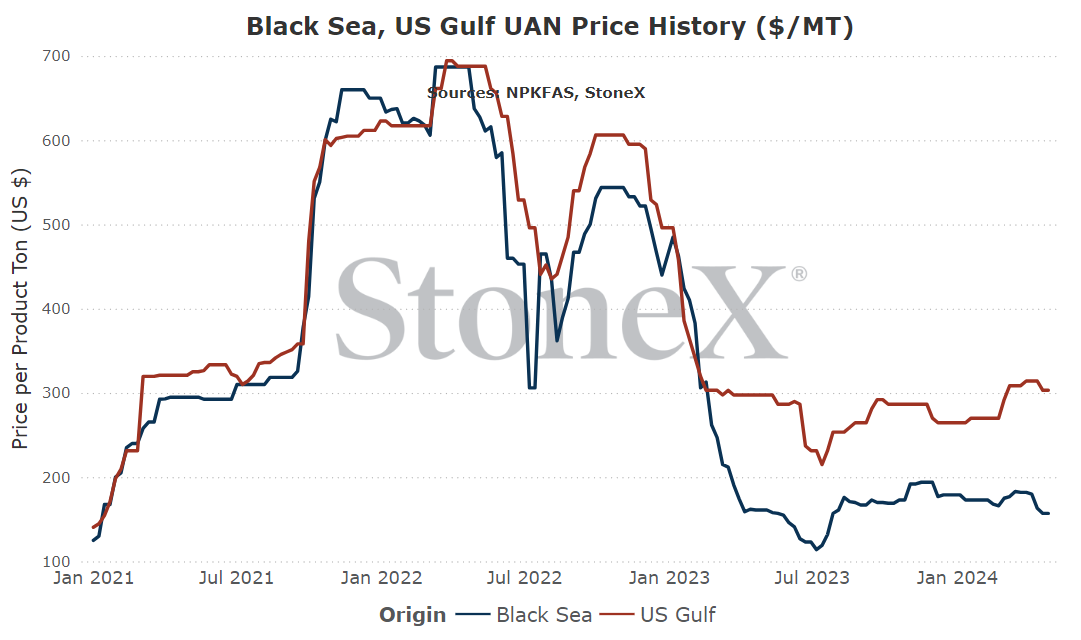
Global urea values have careened lower and the market still isn't to the summer period yet. While N.A. values have remained elevated, other points have dropped...but there is still a lot of space between today's values and last years low's.
We continue to expect lower UAN values around the world as urea continues to fall and summer looms. If we suddenly see remaining offline European production resume, it would only add to the bearishness.
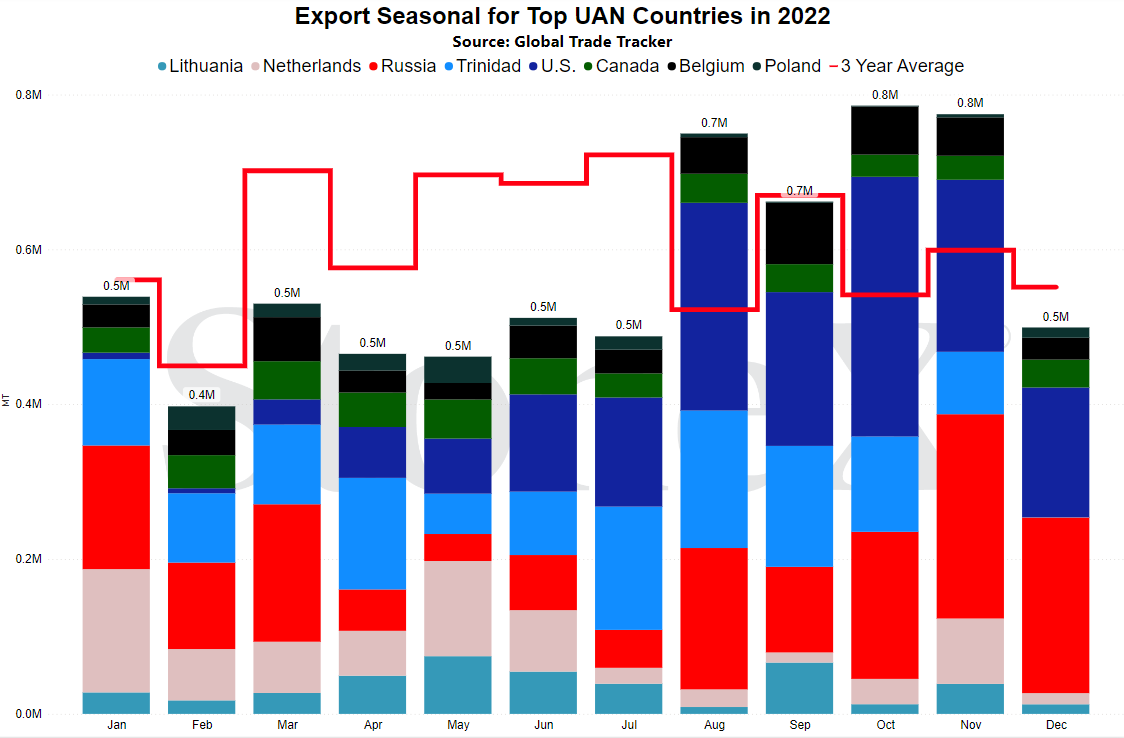
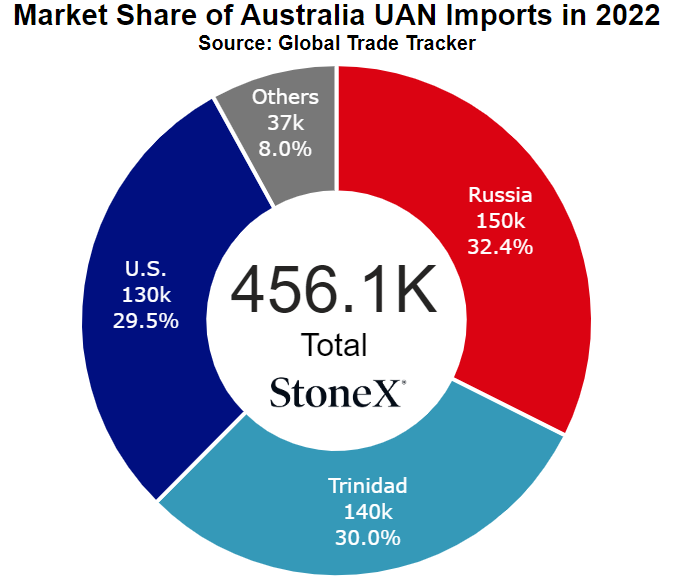
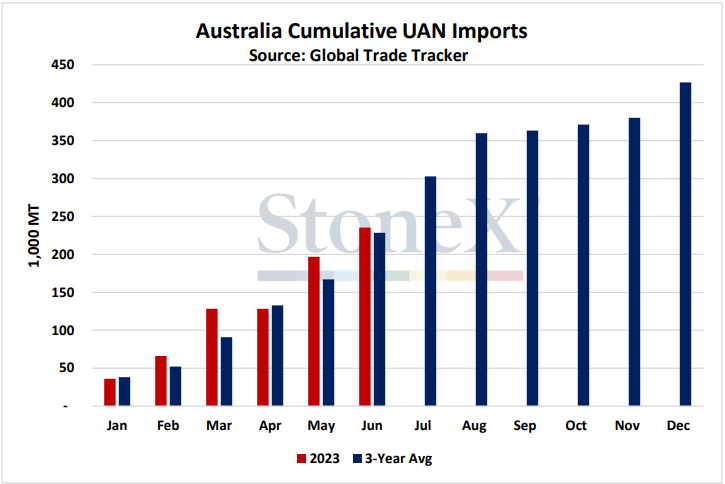
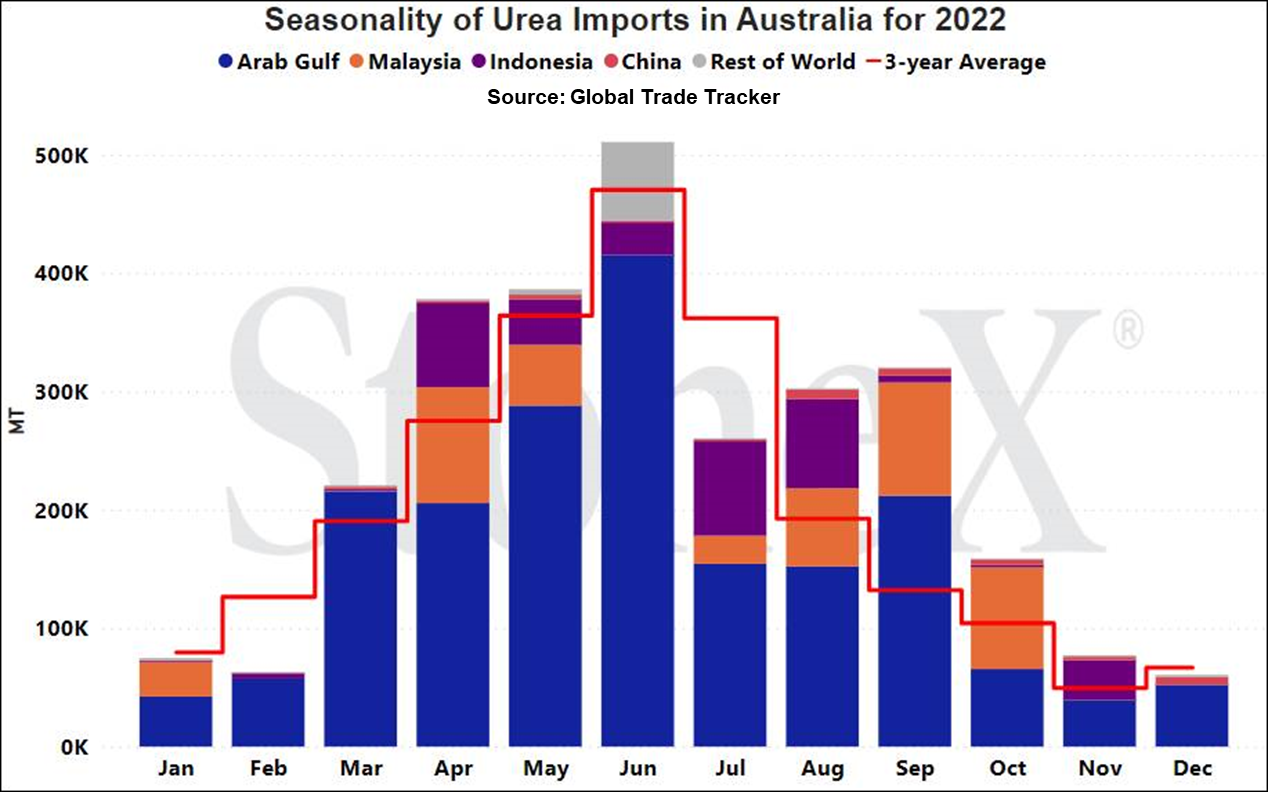
N.A. UAN moves to hefty premium vs urea on tight inventories
A story that we have been tracking for much of fertilizer year 2024 was how tightly supplied the N.A. UAN marketplace was going to be. After starting the year (July 1, 2023) very low on inventories due to a large spring that emptied the system, it felt as though things would remain snug.
...I believe we underestimated how tight it would be as other factors came to play...
First, while we anticipated some production issues, we did not expect how severe they would be. Some plant repairs that were expected ended up taking longer than previously believed. Then, while winter seemed short, we did see the period of excessively low temps that ultimately slowed/stopped production. While it is hard to put an exact value on how many produced tons were lost (companies are very skittish about sharing that intel), some have theorized it could be over 1M tons. Honestly, I struggle to poke holes in that value.
Next, we just haven't gained much in terms of the import/export balance. We have seen very good imports flowing in from Russia. That should have helped to boost supplies and lower price ideas. Unfortunately, production problems persist in Europe so for almost every ton imported from Russia, the same amount of tons flow out to Europe. There has been a bit of gain, but not hugely significant.
Now, we are hearing from multiple folks in the industry that it is tough to find resupply. Not tough as in "I do not want to pay that price" but more "they are telling me it will be weeks before I could pull a load".
Because of this, UAN values have been much more steadfast than what we have seen on the urea market...and rightfully so. If inventories are as tight as being described, the S&D of the N.A. market is out of balance. At this point on the calendar, little can be done about supply. It is what it is. That means the pressure must be placed on the demand side. How do you lower demand? You put the price at high enough level that demand goes elsewhere.
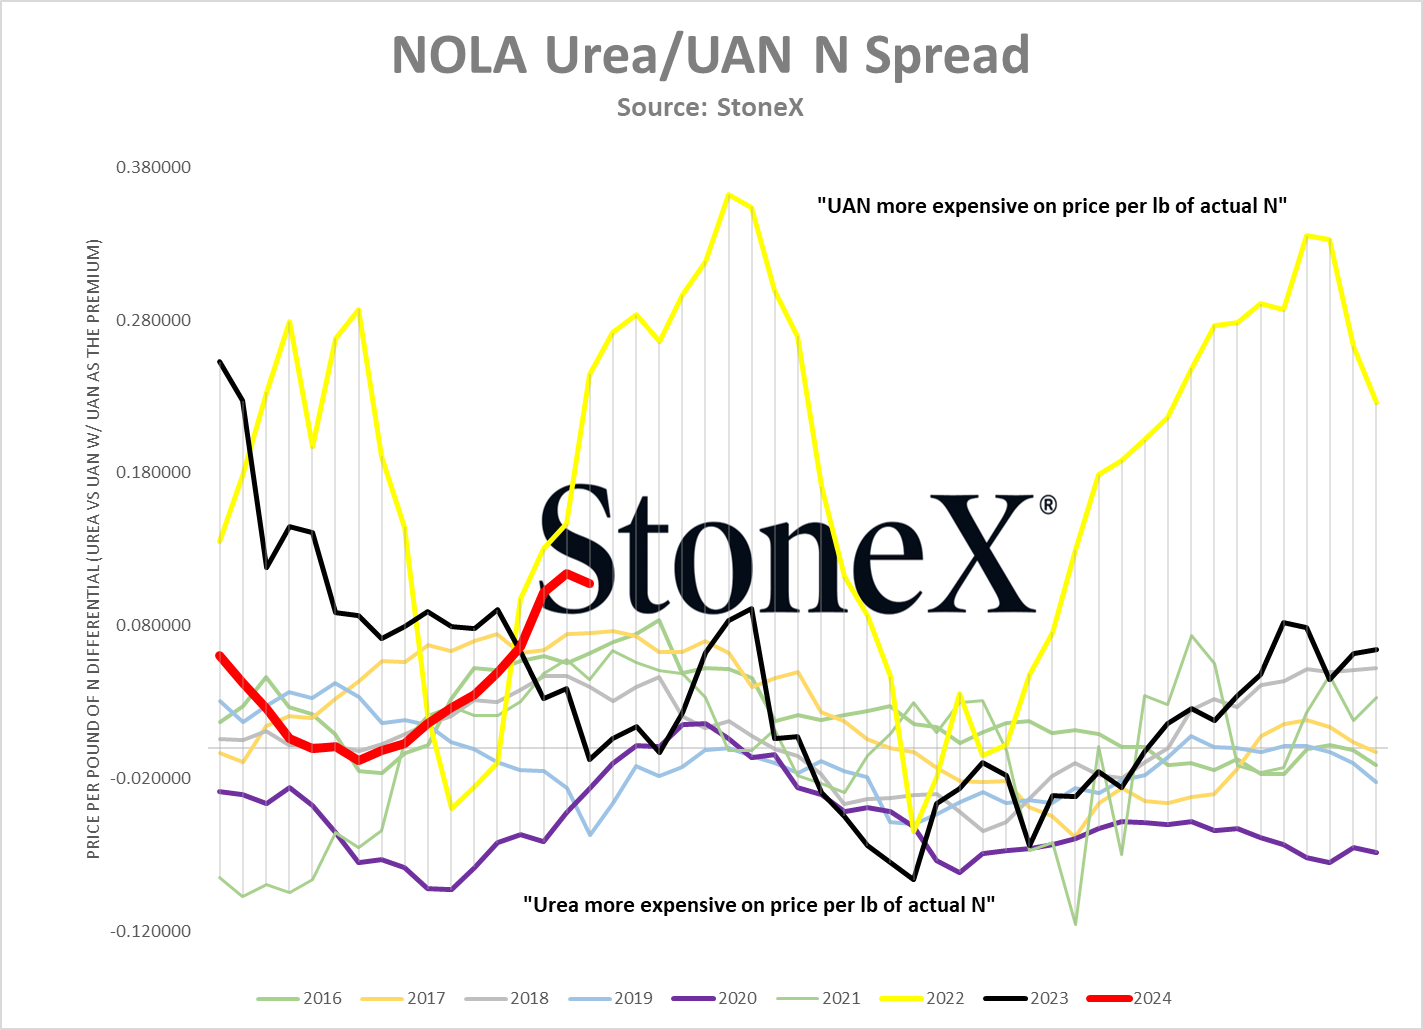
That is why we are starting to see such a disparity between urea and UAN today.
- NOLA urea @ $295 = $0.32/lb of actual N
- NOLA UAN @ $275 = $0.43/lb of actual N
So today, NOLA UAN is approximately 11-cents premium to urea. Glancing at the chart below, that is very high...but again, not unexpected.
Last, remember the difference between a place like NOLA and your local marketplace. These spreads can and will look different based on where you farm.
Why does this matter to Aussie farmers?
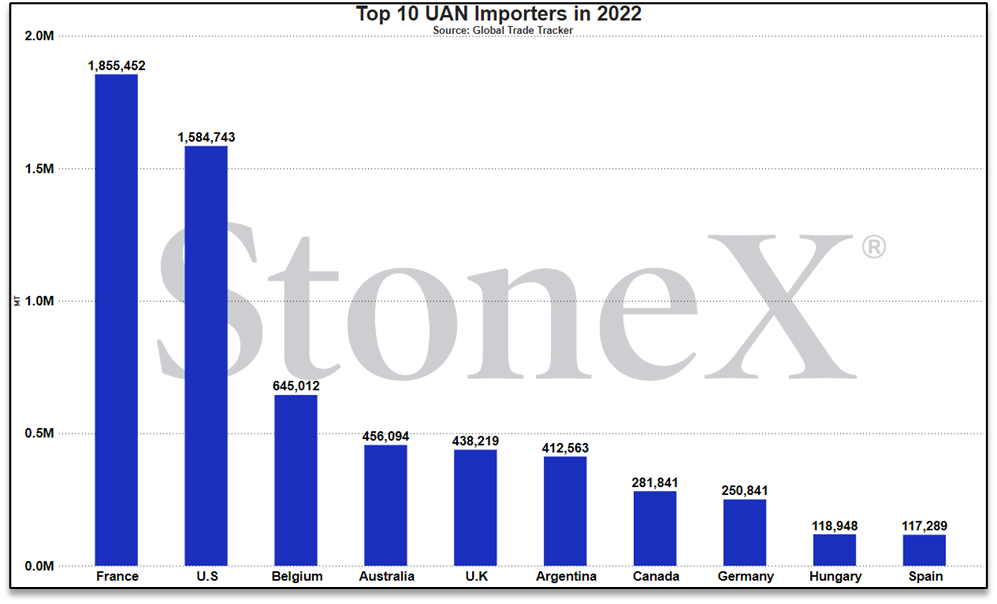
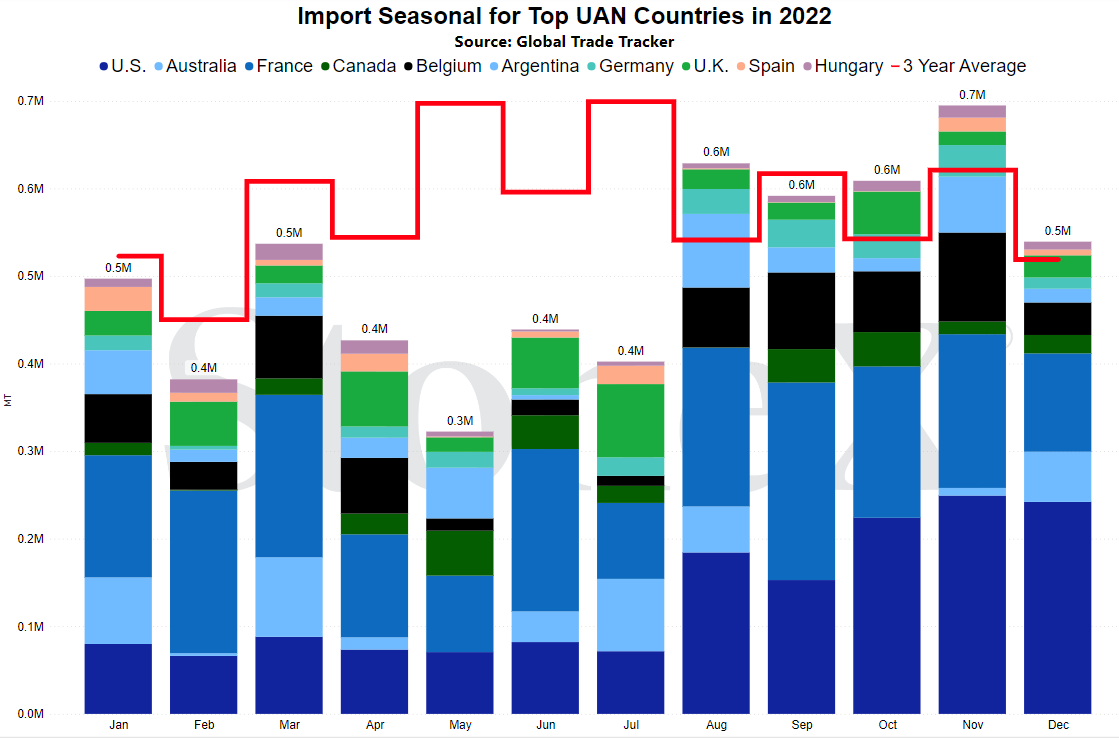
As mentioned in previous months, since the Australian government has blocked Russian fertilizer imports, UAN must largely come from the U.S. That means where U.S. values go, so to do Aussie replacement values.
NOLA/New Orleans, Louisiana
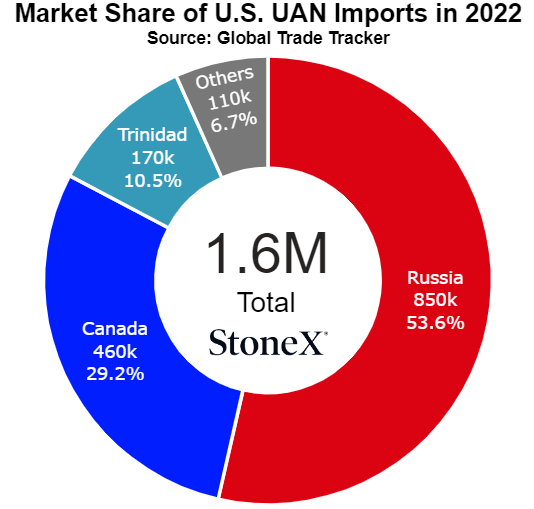
Number 2 global importer in 2022
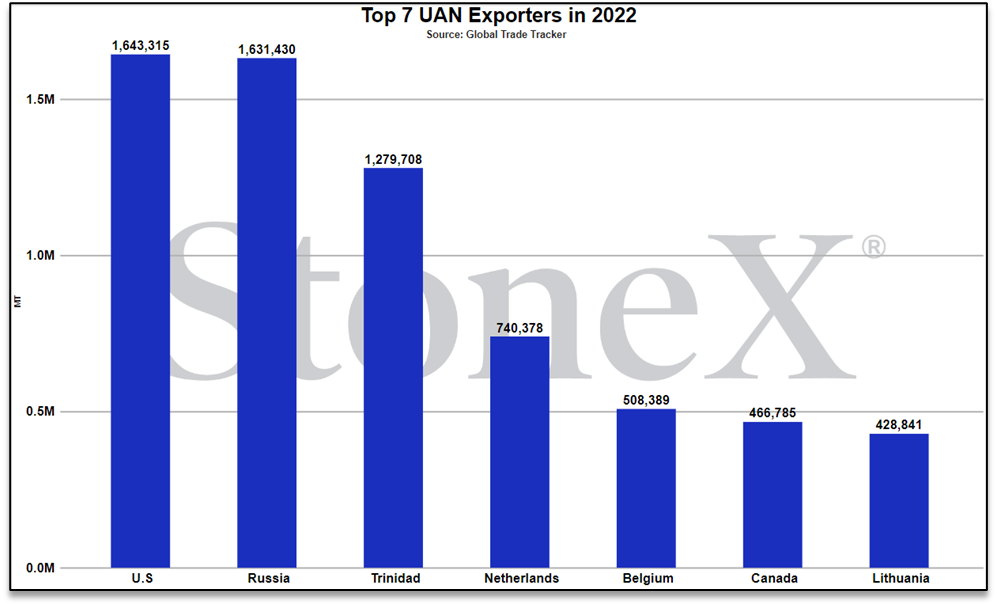
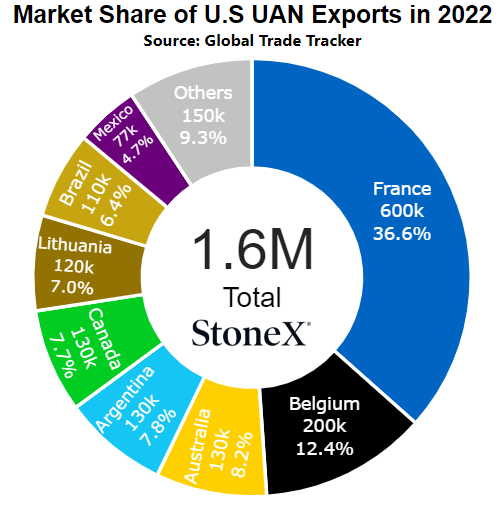
Number 1 global exporter in 2022
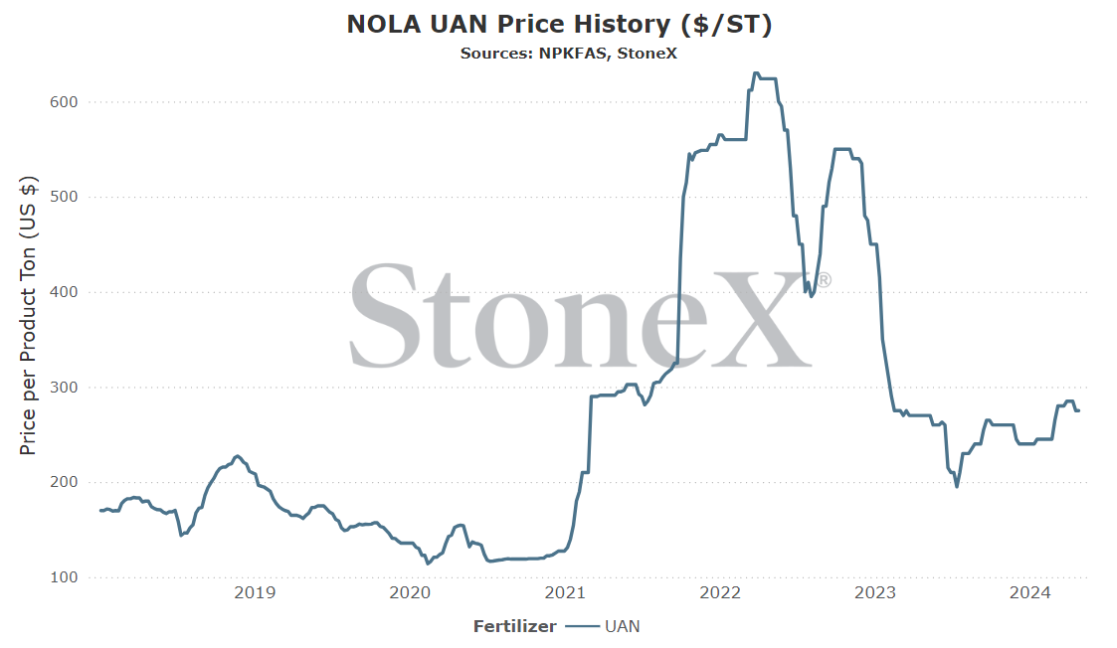
Price comparisons
Vs 30 days ago - -4% or approximately $10 lower
Vs 90 days ago - +12% or approximately $30 higher
Vs 6 months ago - +6% or approximately $15 higher
Vs 1 year ago - +2% or approximately $5 higher
Black Sea (Russia)
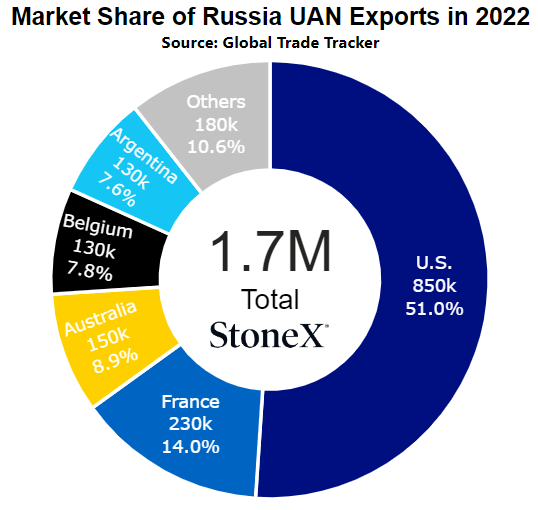
Number 2 global exporter in 2022
Price comparisons:
Vs 30 days ago - -14% or approximately $25 lower
Vs 90 days ago - -9% or approximately $16 lower
Vs 6 months ago - -9% or approximately $16 lower
Vs 1 year ago - -2% or approximately $4 lower
- European production remains offline – from my vantage point, Europe continues to be the linchpin in global UAN markets. Their production remaining at approximately 75% of normal means a large block of tons are not being produced. That makes them a larger global buyer which boost all global price ideas. There is still a chance they get back to 100%, but I wouldn't bet on it based on what is seen today.
- If U.S. seeks sanctions on Russian fertilizer – this is a bit of a stretch. A U.S. based UAN manufacturer tried this and failed a couple years back. However, that is not to say they could not try again. Heck, given how D.C. tends to work, I wouldn't put it out of possible that they might push for it to punish the Ukrainian invasion. If this were to happen, again a very low probability, inventories would go from tight to tighter. For Australia, if U.S. values start to spike due to blocking Russian imports, so to will Aussie replacement values.
- Urea values continue to fall, painting UAN in a premium light – as detailed above, UAN is moving to a large premium vs urea. Last year, we heard that N.A. manufacturers were not going to allow UAN to get "overpriced vs urea" and miss demand. That was a lesson sorely learned spring '23. With urea values continuing to fall, it makes us wonder if UAN price corrections are coming to keep it in line with urea. It is doubtful given the time of year (hard to make switches today) but is something that needs to be watched. This will certainly come into play this summer.
- Offline European restarts start to be announced – this is another "low probability" situation...but that probably is not 0. If we start to see the remaining offline European production restart, this would be a game changer. Not only would it mean that Europe would become largely self sufficient again, but it would also push tons back into markets like North America. Those tons being pushed back would then have to compete with Russian imports. More supply, unchanged demand, lower price ideas in theory.
We believe that only looking at the flat price of either grains or fertilizer can be misleading:
-
Only selling grain can hurt you if fertilizer prices rise substantially
-
Only buying fertilizer can hurt you if grain prices fall
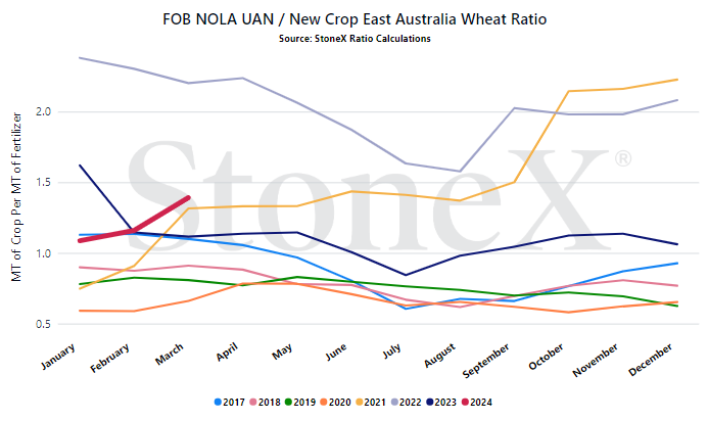
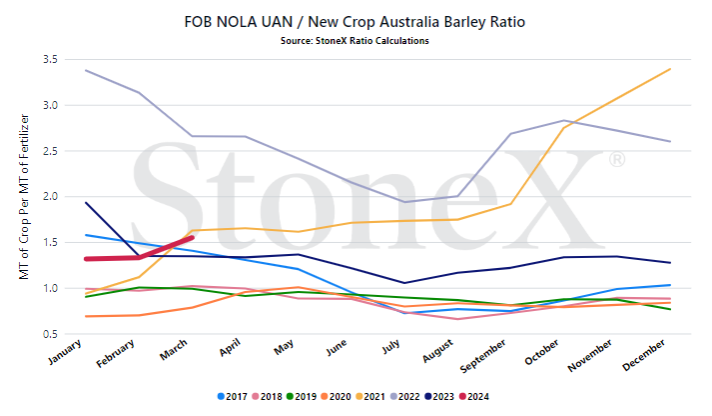
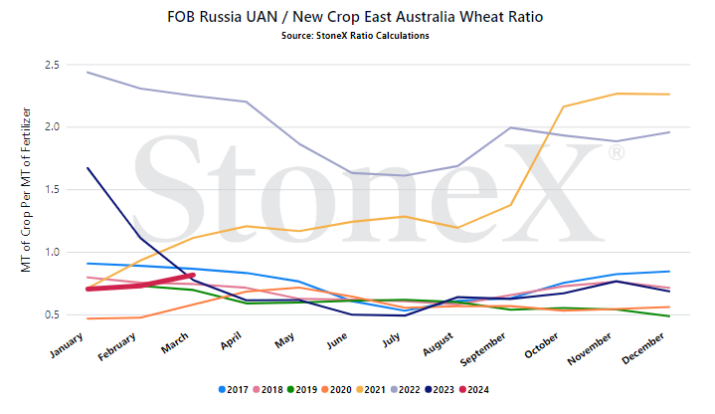
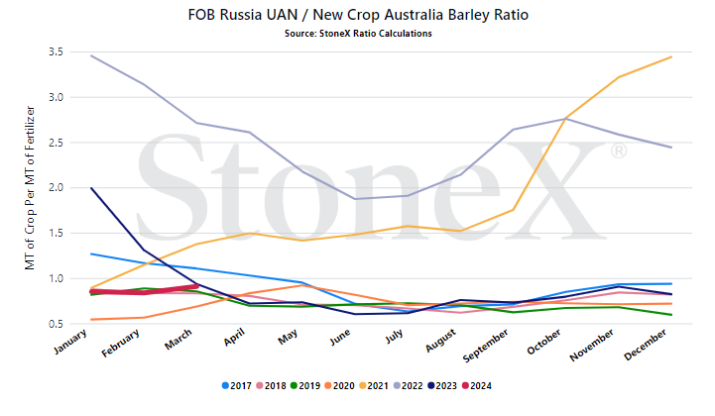
We look at the ratio "value" to get a better indication of where we are or how many bushels of X does it take to pay for 1 ton of fertilizer.
Would you rather:
-
Spend 100 bushels to pay for 1 ton of UAN
-
Spend 60 bushels to pay for 1 ton of UAN
When we compare the current ratio value against recent years, we start to see if we are high or low.
YOUR VALUES MAY LOOK DIFFERENT
This graph looks at the NOLA UAN price vs the flat grain price. There are no logistics on either product. Your location will look different due to fertilizer logistical costs, grain basis, etc.
- European production rates - unfortunately, it does not appear that rates will change anytime soon. The perfect scenario has already come and gone as Dutch TTF values fell and global nitrogen values rose. Dutch values remain in the single digit region but global nitrogen prices are back under pressure and the outlook isn't overly positive. There is always the chance that restarts begin, but it doesn't look likely today.
- Tight N.A. inventories vs falling urea values - if inventories across N.A. were not so tight, we would be singing a very bearish tune today. Unfortunately, that is not reality. It seems as though the market is going to continue to be price supported on tight inventory levels for most of spring. This is certainly something I would be happy to be wrong on for June...
- Continued lack of sources with Russia largely blocked - Australia is out of options for where to source product. It used to be able to leverage Russian producers against U.S. producers. Now, the Aussie government has blocked Russia. Aussie farmers know that. Aussie importers know that. Guess who else knows that...U.S. manufacturers. However, if this blockage were to change...
StoneX Ratio Calculation
The ratio calculation is derived from Bloomberg historical grains values as well as fertilizer values from StoneX, NPKFAS, and Argus.
The calculation is simply dividing the fertilizer price by each grain price.
All data was sourced from StoneX unless otherwise noted.




