

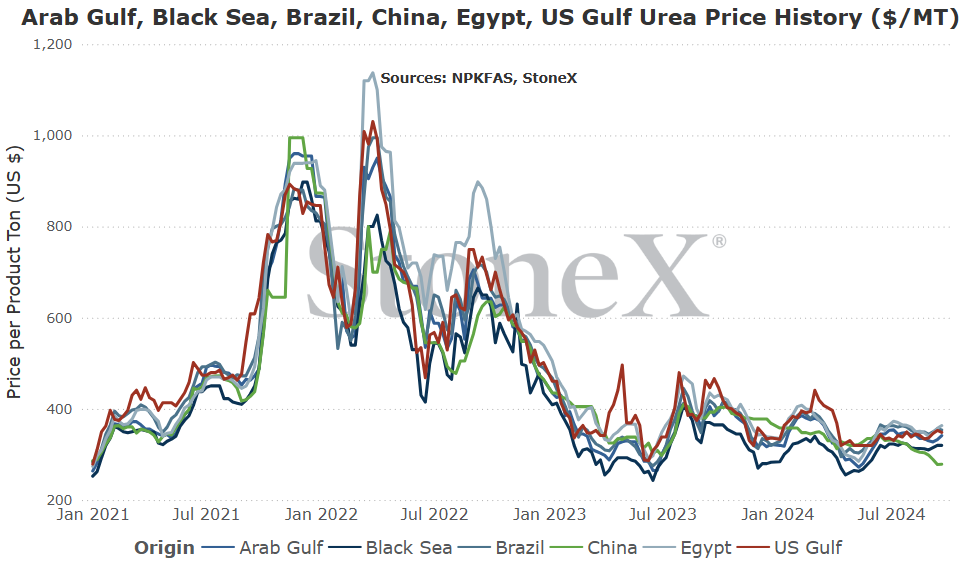
Global values have been holding even though things have been relatively quiet. That doesn't paint a bearish picture for when demand returns.
There is a lot of supply issues in the world with Chinese exports dismal, EU production rates still 75% of normal, Brazil remaining offline and Egypt having its summer production hiccups.
Now, India has announced a purchase tender that "should" have manufacturers around the world saying that they are relatively sold out for the remainder of 2024.
So, to recap:
- Supplies are low
- Demand is still in front of us
- Manufacturers are about to sell out for the rest of the year
From my vantage point, it is really hard to paint a picture where urea values fall anytime soon. The biggest thing that could cause it is if Chinese exports return with a surge...but at this point it looks more likely that they keep exports low.
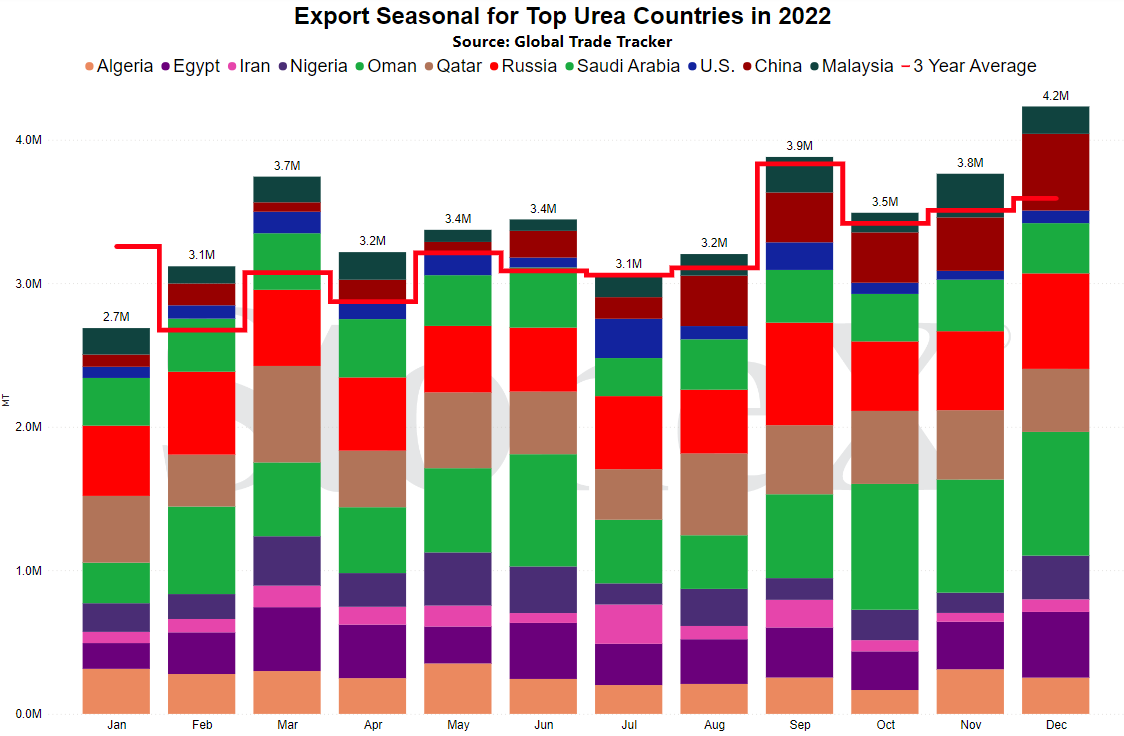
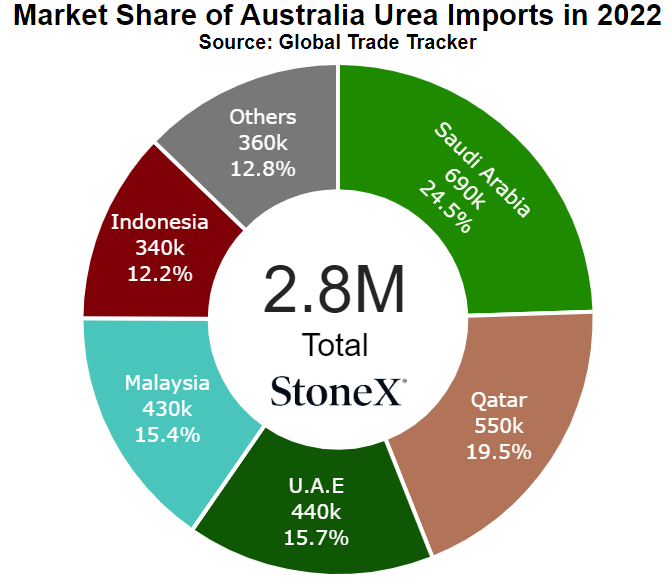
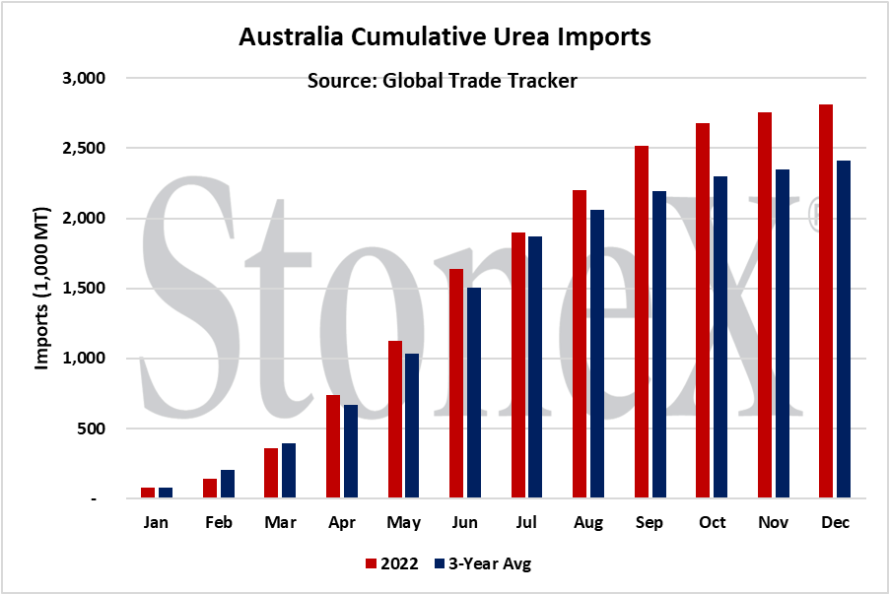
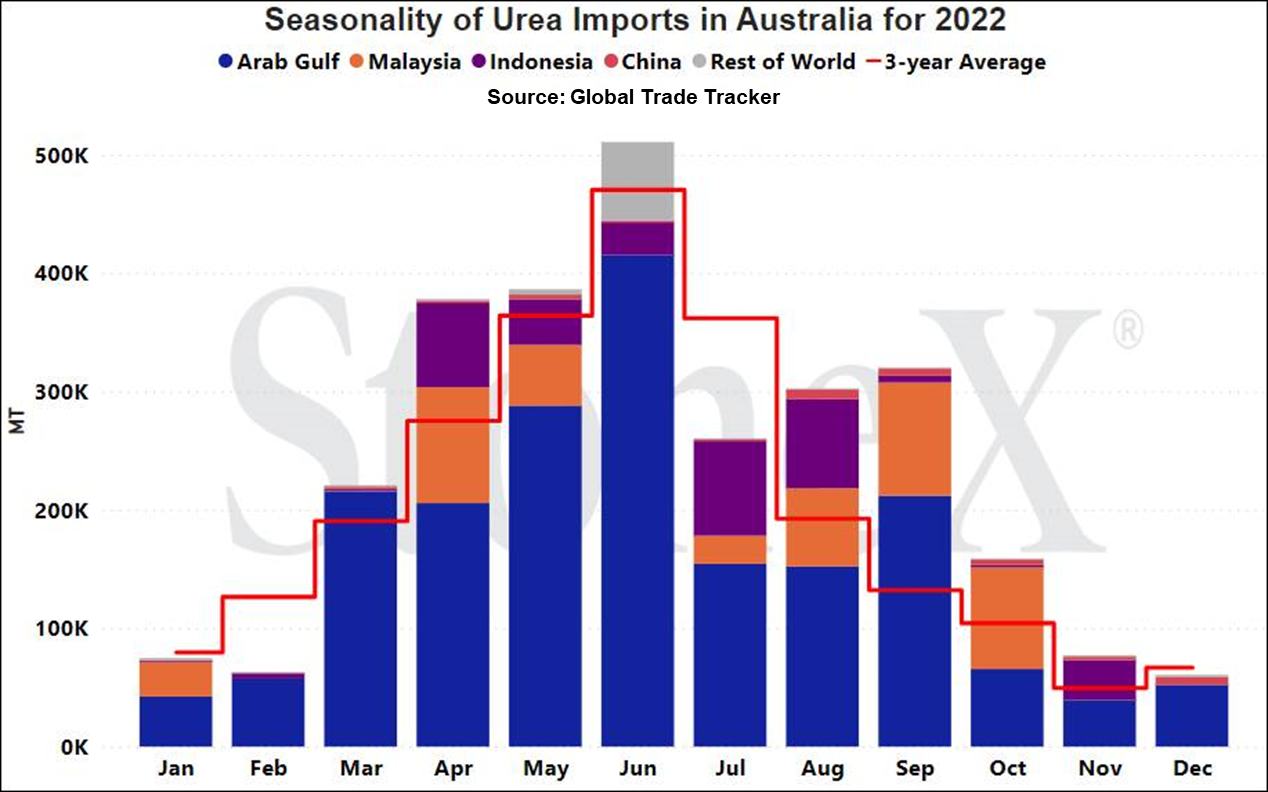
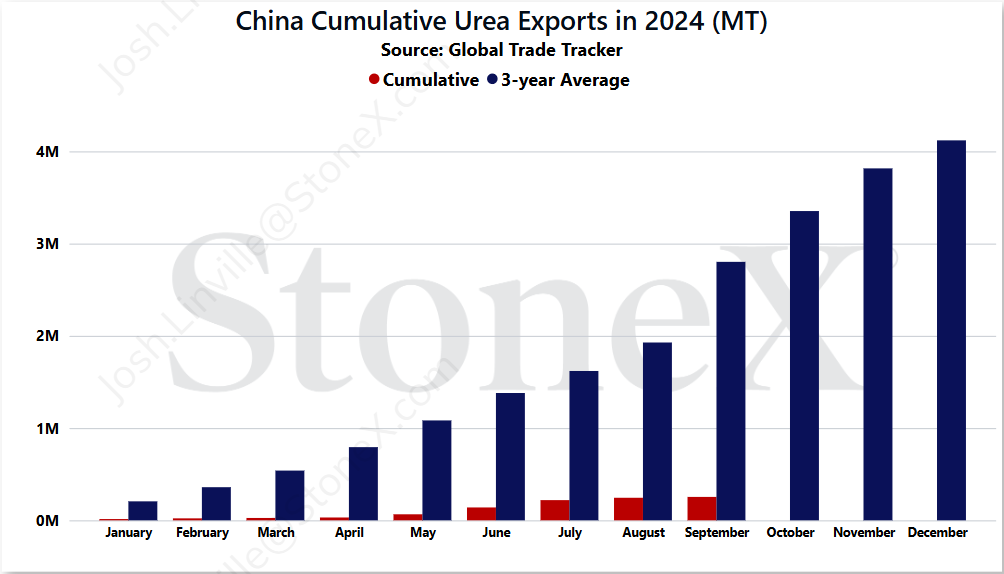
Chinese exports remain mostly non-existent thru September
Another month, another disappointing round of urea export results from one of the larger suppliers of urea to the world.
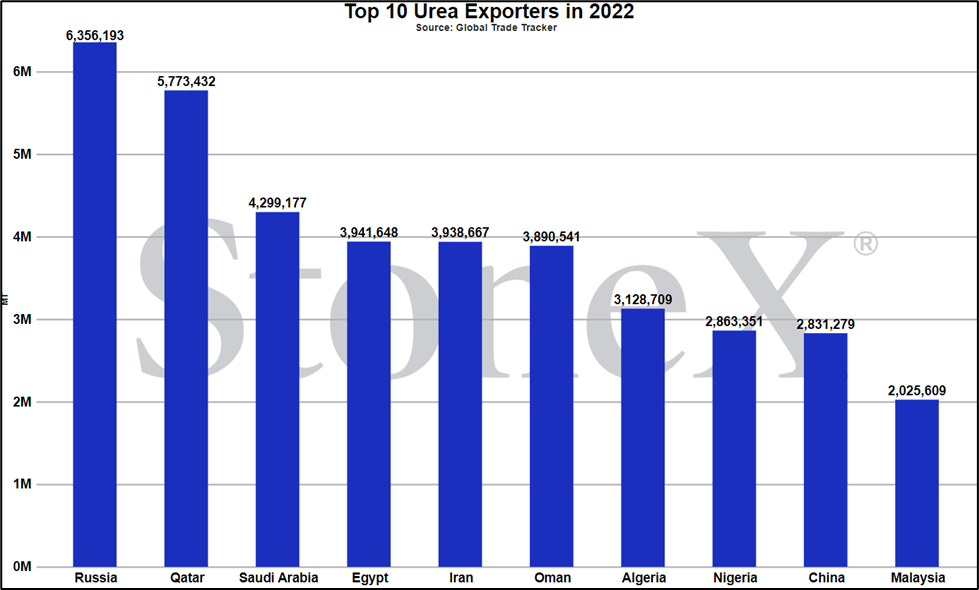
A bit of backstory, in recent history, China accounted for around 10% of the global export total or around 5 - 5.5M tons per year. While there could be some hiccups from time to time, it was a relatively stable supply.
Well, relatively stable until 2021/22.
At that time, global values skyrocketed as fears of extremely tight supplies started to take hold. China, a communist government, saw a risk where too many tons would be exported and leave Chinese farmers in a bind. Rather than let that happen, they opted to take a step to protect their farmers. By restricting exports, not only did they ensure that Chinese farmers had more than adequate supplies at their fingertips, they also made sure that Chinese farmers had some of the best valued urea in the world. For the Chinese government, it was a huge win. For the rest of the world, it was a huge loss that is still playing out today.
Export restrictions continue to play a part in their export programs. Last year in 2023, it looked as though they were returning to normal but it was little more than a head fake. This year, their export total looks like it will be the lowest ever seen. As stated, recent historical norms would have their exports around 5 - 5.5M tons. This year, they may not reach 500,000 tons. Their cumulative January thru September total only sits at 254K.
As long as the Chinese government restricts exports, the global urea market will see that as a huge support factor that keeps values from falling substantially. Now, on the flip side, if/when they return, it will be noticed. Chinese tons are typically viewed as the "boogeyman" of the urea market. When China returns, I expect to see manufacturers and long positions to start getting a little more aggressive than what they would have been before.
That day will come...eventually. We just need eventually to be sooner than later.
What does this mean for farmers?
This is especially hard on Australia, given China's proximity.
As China has scaled way back on exports, it leaves a massive hole in the global S&D. That hole gets larger when you start to dial into the regional impacts.
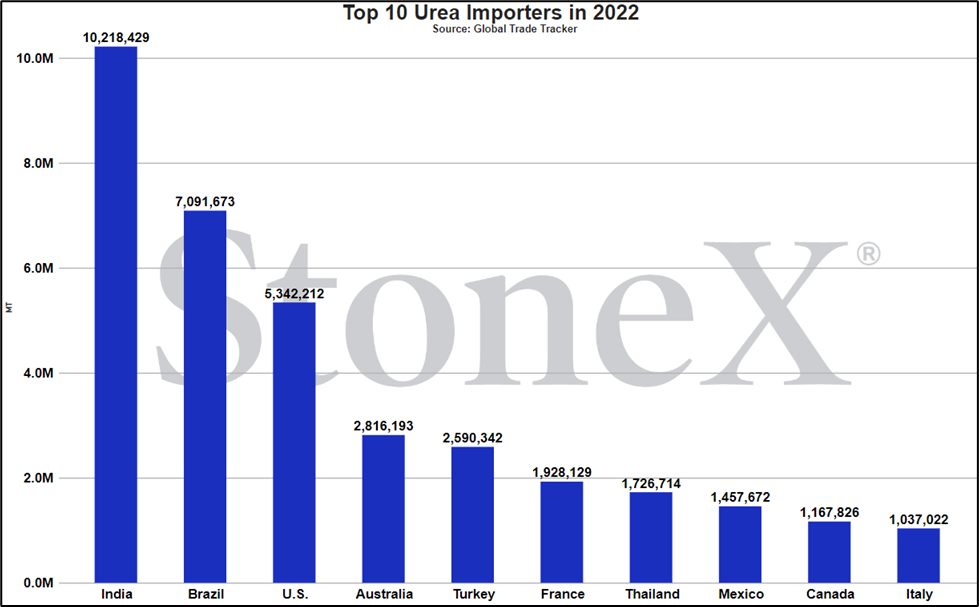
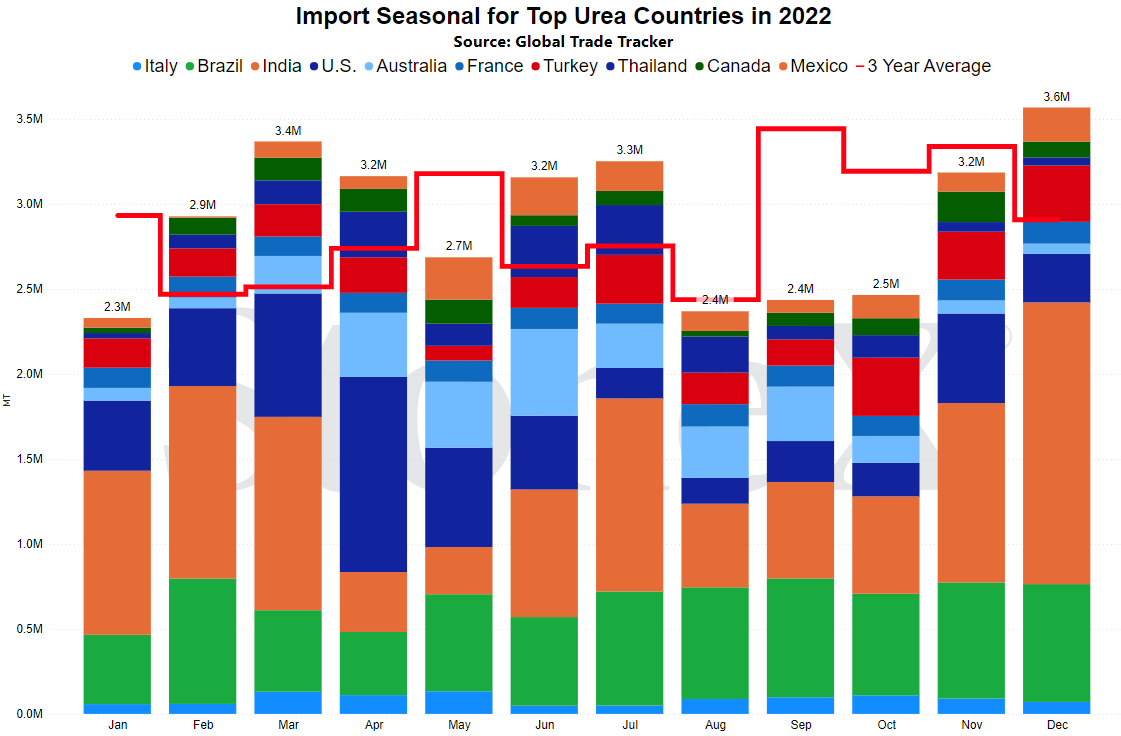
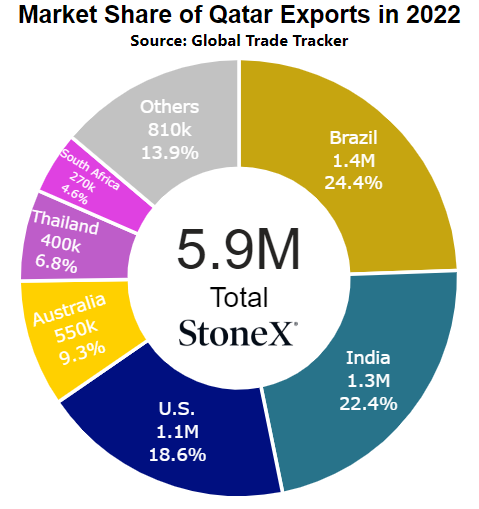
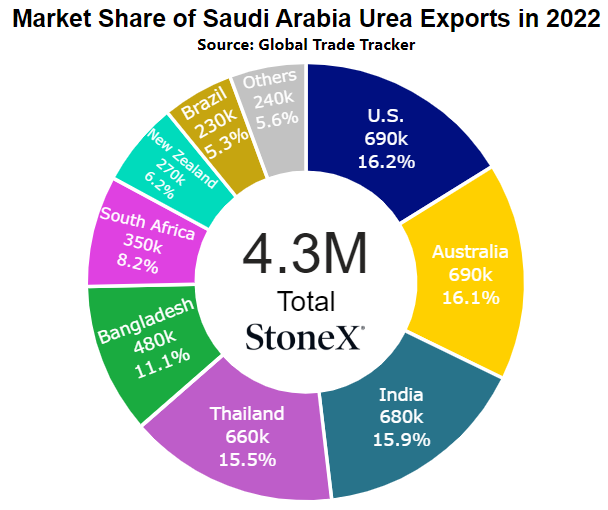
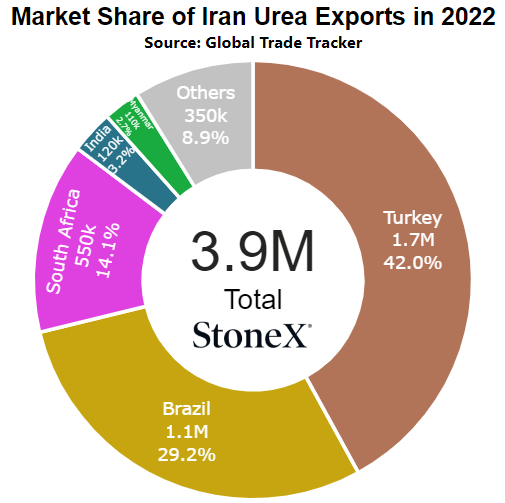
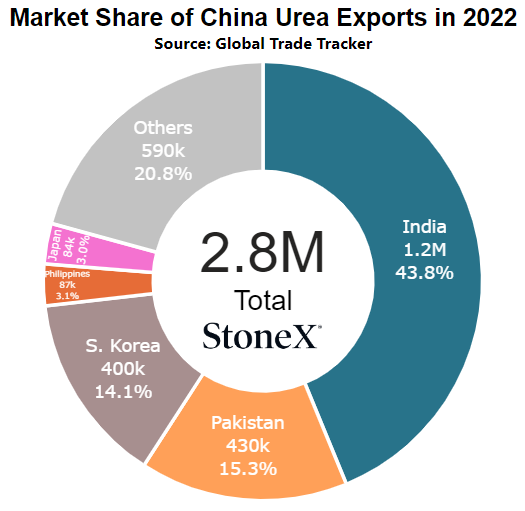
You might start looking above and start thinking "but Australia doesn't get urea from China". That is true today, but it hasn't always been. Also, it is more about those that HAVE received product from China. Those buyers lost their supplier and are forced to look elsewhere. Guess where they look...at each country listed on those import pie charts. Losing someone the size of China hurts around the world but hurts worse when you are near it.
Fortunately for Aussie farmers, a solid amount of imports were seen (vs normal) which helped keep a lid of price ideas but if China continues to stay out of the export market, we could see this story remain for next year.
Global supplies feel tight due to EU/China/Brazil/Egypt
The 2021/22 period saw global urea values skyrocket on the fear that supplies would be tight. There were some fears that were unfounded (losing Russian exports due to their invasion of Ukraine). There were some fears that were self inflicted (countries like China/Egypt/etc. slowed or stopped exports just out of fear). There were some fears that production would be lost (losing the greater EU region due to rising natural gas values).
Now, things have calmed down. Global urea values remain about a third of what they were at their early 2022 high's. However, that doesn't mean that we do not have our current issues.
- Chinese exports remain low - as mentioned in the above section, Chinese exports for 2024 are dismal. It is very likely that they will finish the calendar year a full 5M tons short of what they would normally export. That is a huge loss.
- EU production remains at 75% of normal - while Dutch TTF natural gas values have fallen significantly from their late 2021 high's ($103MMbtu), they are still much higher than normal and the result is that production is still 75% of normal. In fact, the outlook is getting worse. Companies such as Yara are now taking steps to more permanently shutter their nitrogen plants with statements that they will be looking to expand in lower priced input markets such as N.A. 25% of EU urea production equates to around 2.5 - 3M tons per year.
- Egypt - this summer saw Egyptian urea production struggle. High temperatures caused domestic/public demand to jump as they tried to cool their homes. With limited supplies of natural gas, the government had to make a choice. Give the limited supplies to the people to live or give it to the industrial sector to make money. Fortunately for their population, they made the right choice and gave it to the people. Unfortunately for the global urea market, we believe near 1M tons of urea production was lost
- Brazil - another production loss due to high natural gas values. This one wasn't a surprise but it still adds to the list. Brazilian nitrogen production has been offline all year and that equates to roughly 1.5M tons.
To put the above into a short list:
- China - 5M
- EU - 2.5 to 3M
- Egypt - 1M
- Brazil - 1.5M
That is a lot of tons that are not being made or being exported this year. Worse, situations like EU and Brazil means that not only are those supplies missing, they need to buy those tons from the world. It is a full S&D hit.
I do not say all of this to try and say something ridiculous like "urea is going back to $800". While it is a possibility, I think it would take losing Russia or having the Middle East go into a full on war. Neither scenario looks likely today.
However, I say all of the above to show why I have been continually bullish on urea. With this many tons missing, it is hard to imagine values falling anytime soon.
What does this mean for Aussie farmers?
This could be something that hurts values even with current inventories still believed to be solid.
If we remain right on our supply outlook, that is a lot of missing tons. Eventually, demand will show up and that is where I fear the story really starts to play out. Demand finds out inventories are low and then the bidding/buying begins.
The Egypt situation seems steady now. The EU and Brazil situations do not look like they are going to change. China remains the wildcard.
As long as this many tons are missing from the global S&D, values should stay supported around the world.
India tender fails to capture tons...new tender announced
The last India urea purchase turned out to be fascinating. Normally, when all the offer information is released, we see a relatively tight value spread. By the time the offers are due, traders/offers have all mostly agreed to where market values are based on where business is being done and the offer values show that.
Someone missed the memo on this last tender!!!
In the days leading up to offers being submitted, Iran launched a barrage of missiles at Israel. Now, from a direct situation, the launch had little to do with urea. Israel isn't really a player in the nitrogen world and Iran was the aggressor...but global values went up anyways. Our interpretation is that the bullish price run was already in the cards but everyone in the market was worried about being the one that caused it. The Iranian attack gave the market the reason "why" values needed to go up. By the end, price ideas had risen about $25.
Eventually, India released the offer information. The East coast played out like normal. There was a range of values but for the most part, they were relatively in line. The west coast...well, there was a standout for the west coast.
One trading company submitted their offer for 50,000 tons at over $25 LOWER than the next lowest price. If that one offer had not been submitted, then the other offers fell into line of normal. Needless to say, all the other west coast offers refused to negotiate down to the lowest price. While India secured a little over 500K tons, all but 50K went to the east coast.
That brings us to today.
Yet another tender has been announced. This one will have a shipment period thru to December 25th and they are asking for west coast offers only. More, they have stated they are looking to secure at least 1M ton for this purchase.
This is pretty substantial.
Our belief is that they will get the tons that they want...and manufacturers will be smiling ear to ear following the conclusion. After this purchase, it is highly likely that the market will be able to say "we are mostly sold out thru the rest of 2024". That is incredibly important. If a manufacturer can get well sold thru to the end of December, the market leans to them. Spring demand buyers suddenly start feeling backed into a corner and competition to secure tons becomes more important than trying to vie for a lower price.
Now, there are certainly plenty of pitfalls that could happen during this tender so stay tuned but right now, a lot of the factors that we watch are pointing to supported prices in the near future.
What does this mean for Aussie farmers?
This is the story that should prove whether I am way off base on my POV or on the right track. There is a growing group that thinks India locks up enough tons to effectively "sell out" the global markets thru the end of 2024. That puts manufacturers on very strong footing to start 2025.
With Aussie demand not returning in a big way until April/May or later, there is time for the story to shift several times...but this sets a tone.
Vs 30 days ago -
Vs 90 days ago -
Vs 6 months ago -
Vs 1 year ago -
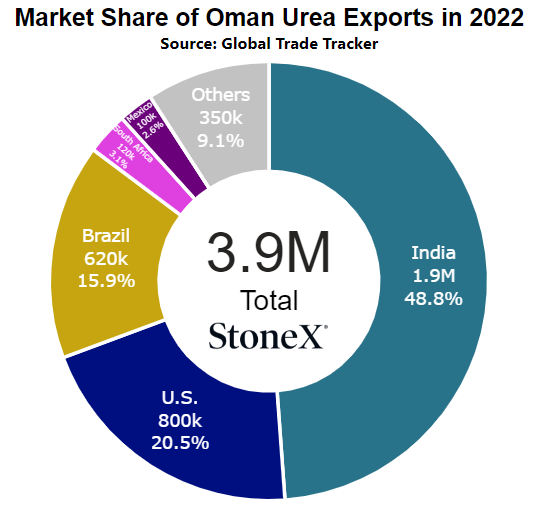
Egypt
Number 4 global exporter in 2022
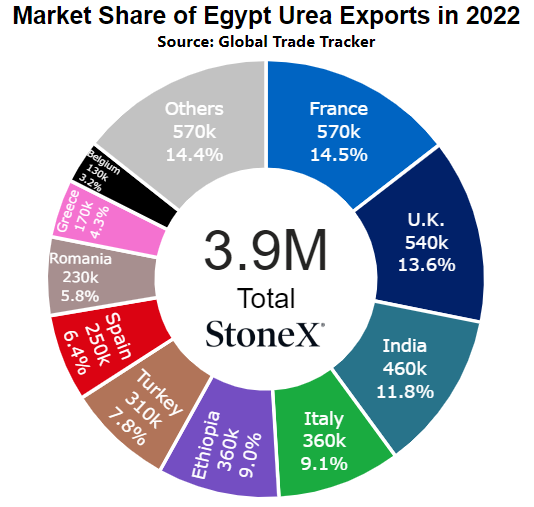
Price comparisons
Vs 30 days ago - 11% or approximately $40 higher
Vs 90 days ago - 11% or approximately $39 higher
Vs 6 months ago - 36% or approximately $108 higher
Vs 1 year ago - 0% or approximately $2 higher
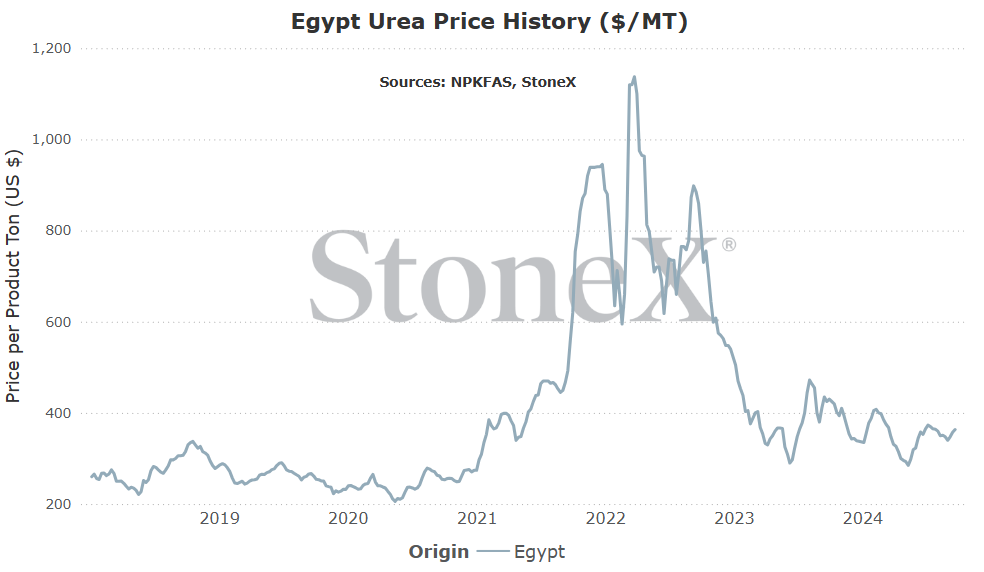
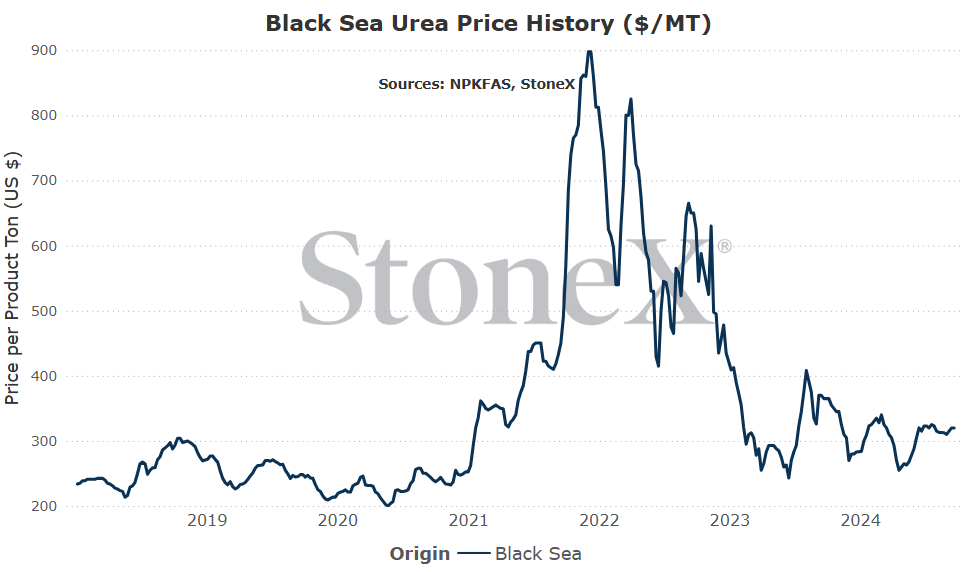
Black Sea
Number 1 global exporter in 2022
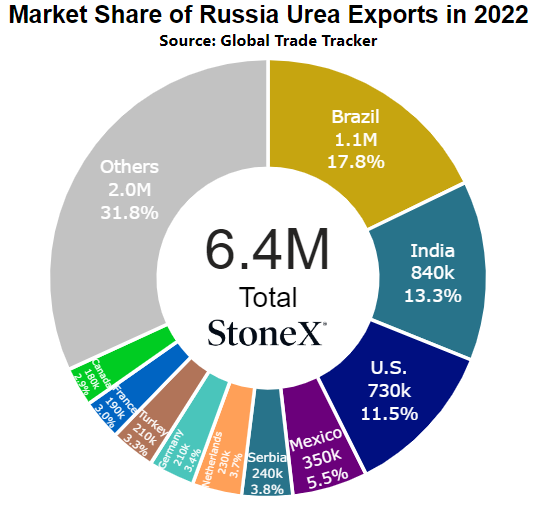
Price comparisons
Vs 30 days ago - 8% or approximately $25 higher
Vs 90 days ago - 6% or approximately $20 higher
Vs 6 months ago - 33% or approximately $85 higher
Vs 1 year ago - -1% or approximately $5 lower
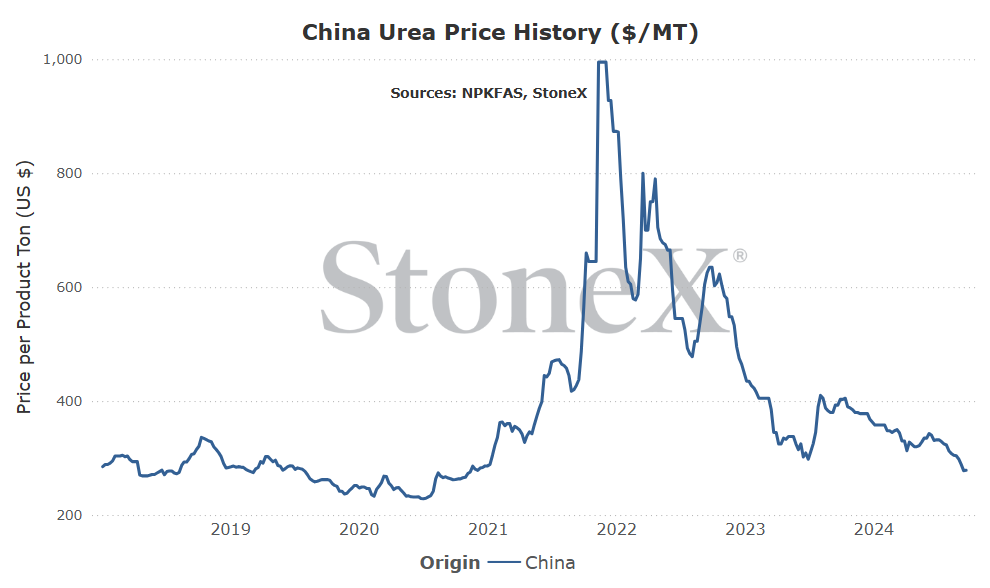
China
Number 9 global exporter in 2022
Price comparisons
Vs 30 days ago - -1% or approximately $2 lower
Vs 90 days ago - -15% or approximately $49 lower
Vs 6 months ago - -14% or approximately $44 lower
Vs 1 year ago - -29% or approximately $114 lower
- India could soak up all excess tons for 2024 - this is at the top of the list for a reason. India is likely to lock up over 1M tons on this purchase tender. I think a common phrase following their purchase will be "we are effectively sold out for 2024". That is a HUGE negotiation statement for manufacturers. If they are well sold for 2024, that means they enter 2025 very comfortable and they know spring demand is coming soon.
- Chinese exports remains dismal - Chinese exports have been low for all of 2024. Most of the feedback we continue to get is that the low exports rates will continue. At this point, it would be more of a surprise if they suddenly started to export again. As long as China is restricting exports, it leaves a gaping hold in the global S&D.
- Australian demand may have been bigger than thought/lower ending inventories - if the Aussie urea run was larger than we expected, it makes sense that ending inventories are lower than we are forecasting...which would put Australian prices in more jeopardy to move higher with global price moves (if they happen)
- Never count out China - just because they have done very little so far this year doesn't mean they cannot suddenly start flooding the market. Their reported operating rates have been very high. They could be stockpiling and once storage is full they could hammer exports. That doesn't seem likely...but it also doesn't seem impossible. Something to consider.
- We are overestimating India demand impact - right now, my narrative is that India will lock up enough tons to essentially wipe out any excess tons for the remainder of 2024...but what if I'm wrong? What if there are more tons out there than we think? What if India doesn't need as many tons as they say and they are just playing with the market. There is no guarantee that it plays out like we think. In fact, as soon as I start to think I know how it will happen...
- We are right on Australian inventory carryover - if we are right on the Aussie urea ending stockpiles being higher than normal, that means a lot of tons are vying for whatever demand is left. Even in a supported global marketplace, we could still see Aussie values lower as everyone that is still long chases any sales opportunity that exists.
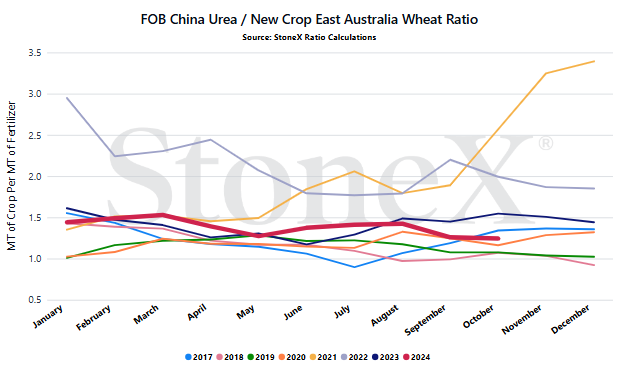
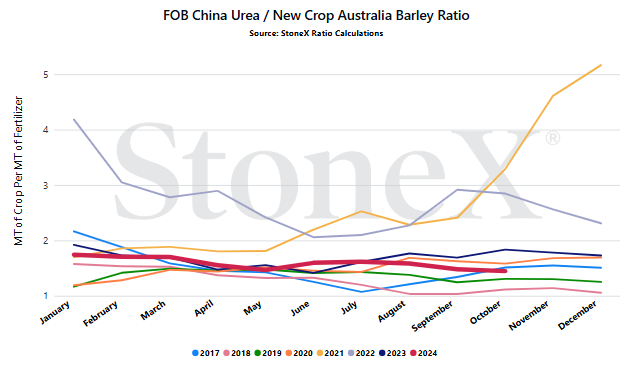
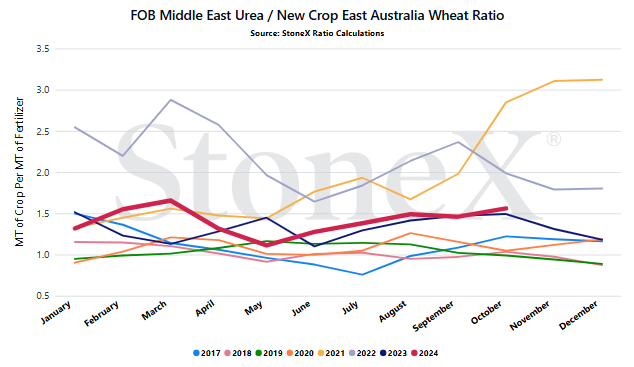
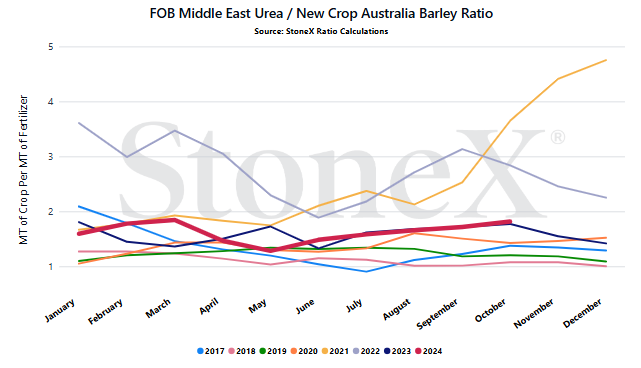
We believe that only looking at the flat price of either grains or fertilizer can be misleading:
-
Only selling grain can hurt you if fertilizer prices rise substantially
-
Only buying fertilizer can hurt you if grain prices fall
We look at the ratio "value" to get a better indication of where we are or how many bushels of X does it take to pay for 1 ton of fertilizer.
Would you rather:
-
Spend 135 bushels to pay for 1 ton of urea
-
Spend 55 bushels to pay for 1 ton of urea
When we compare the current ratio value against recent years, we start to see if we are high or low.
YOUR VALUES MAY LOOK DIFFERENT
This is a work in progress section! We plan on looking at the relationship between Aussie grains and global price points (and hopefully Aussie specific locations, though that data is hard to secure, very protected). Big reason why we are still in the "trial" stage of this newsletter!!!!
- China - I am putting this first because China feels like the biggest thing keeping values higher and seems to be the biggest thing that could pull prices lower. As long as their exports are non-existent, values should be supported but when they return (and I think they will return), watch out for the downside.
- How India changes the narrative - do they shock the world and only buy a few hundred thousand ton? Do they beat estimates and buy well north of 1M tons? Ultimately, it comes down to what is left after they have their fill. If manufacturers can say they are sold out until 2025 when they know spring demand will be foaming at the mouth, they should win those price arguments. However, if they go into 2025 needing to sell tons...
StoneX Ratio Calculation
The ratio calculation is derived from Bloomberg historical grains values as well as fertilizer values from StoneX, NPKFAS, and Argus.
The calculation is simply dividing the fertilizer price by each grain price.
All data was sourced from StoneX unless otherwise noted.




