

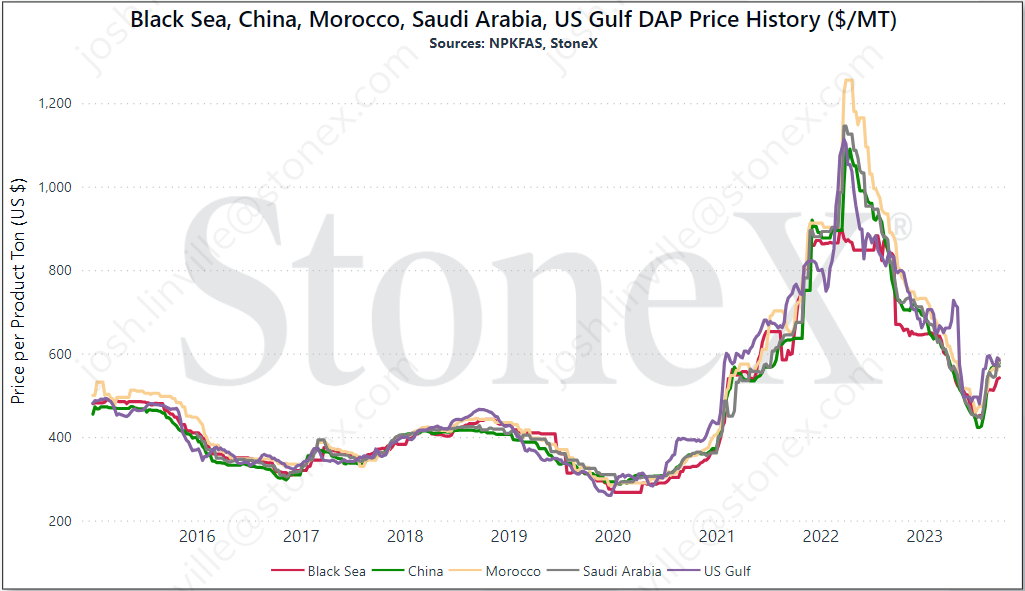
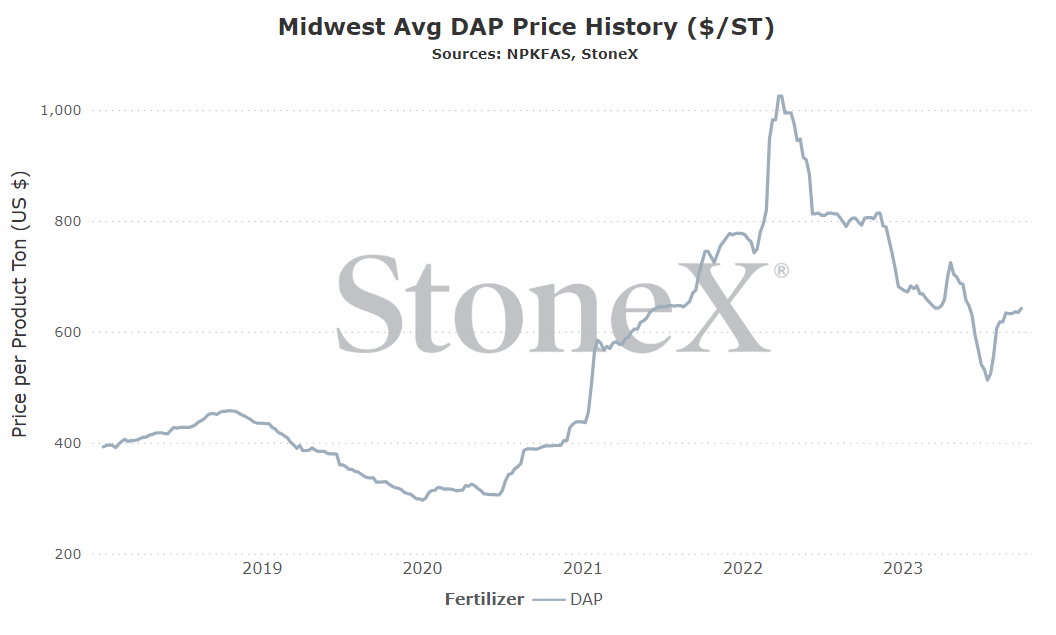
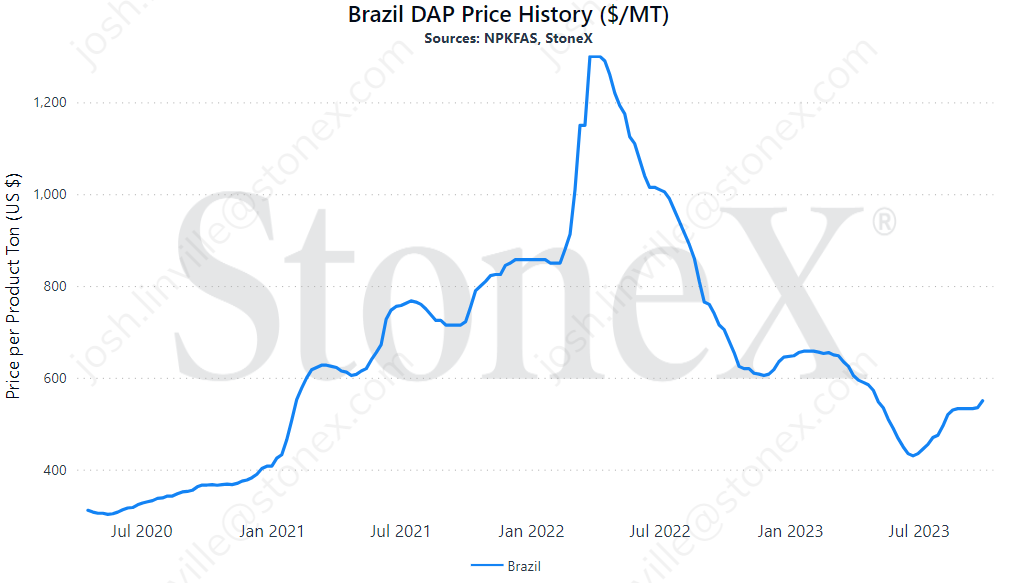
I will say this now and will say it going forward to eternity: these are the flat price graphs for each individual location. Your price where you are is going to be different. There are logistics. There is the cost of storage/interest/insurance/etc. These graphs should not be taken as "it shows the price at $700, why isn't my price $700". These graphs should be used to give an appreciation for price movements.
All values are in metric tons and USD currency.
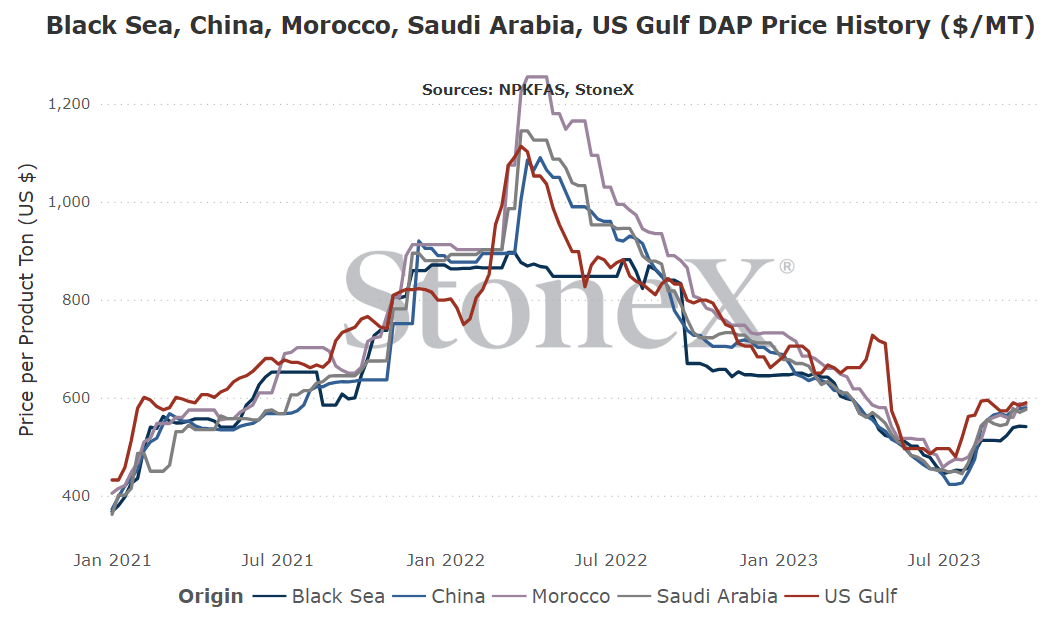
As much as it pains me to say this to buyers of phosphate, it looks like global values have bounced off a floor and have found at least short term support. Major global buyers have been aggressive with their purchases which has allowed manufacturers to feel comfortable and move price ideas higher. Continued questions/concerns regarding Chinese export programs certainly haven't helped!
However, longer term, I cannot help but see more downside. Phosphate values obviously did a TON of work coming off their high's set back in April '22, but it didn't do nearly as much work as other fertilizers have done on a percentage basis. When we look around the world, it seems like supplies are getting closer to normal...but today's values are still high vs historic norms. None of that takes into account what happens in a few years when Norway's production begins to find its way around the world!
Long story short - short term markets should continue flat to higher as demand continues to press but longer term should see more corrections in store.
North America
The North American phosphate market will largely trend along with global price patterns as it always has. Unfortunately, buyers in the region have to also contend with counter vailing duty rates which are effectively blocking 3 of the largest exporting countries in the world. This, combined with still low inventories after a solid last spring, has helped NOLA phosphate values lead the world higher.
Looking more ahead, I think some of these duty challenges will be successful and we will get closer to normal import/export patterns. Demand will also eventually fix the S&D.
Long story short - don't sleep on the near term phosphate market as we could see a big price jump as fall demand steps forward and finds logistics/inventories struggling. However, as we move toward spring '24 and beyond, phosphate should have more downside price work to do.
I've thought about this section a lot in the last month and I've decided I'm going to discontinue it.
I swear I'm not being lazy!!! My issue is that this decision can vary so widely.
- What crops are you growing?
- Where are you located?
- What programs are you using?
- Are you just looking for the fertilizer low or are you selling grain as well?
- Are you at a higher weather risk for growing next season?
- What is your local basis (what makes your area values unique)?
That just touches the number of questions which differentiate each and every person who subscribes to this. What makes sense for one may not make sense to the next.
At the end of the day, it is NOT my place to tell ANYONE what to do/not do for their operation. I'm here to provide background/information/insight into the markets but you make your own decisions. You have to answer to your bank/suppliers/etc.
While the fertilizer futures market is far from as liquid as its grain counterparts, it is still active and gives us an insight into what the market is thinking.
Please note that the values below can and will change daily. This is merely a look at where they are as of writing:
| NOLA DAP | |
| October | $527.50 |
| November | - |
| December | - |
| January '24 | $490 |
| February | $490 |
| March | $490 |
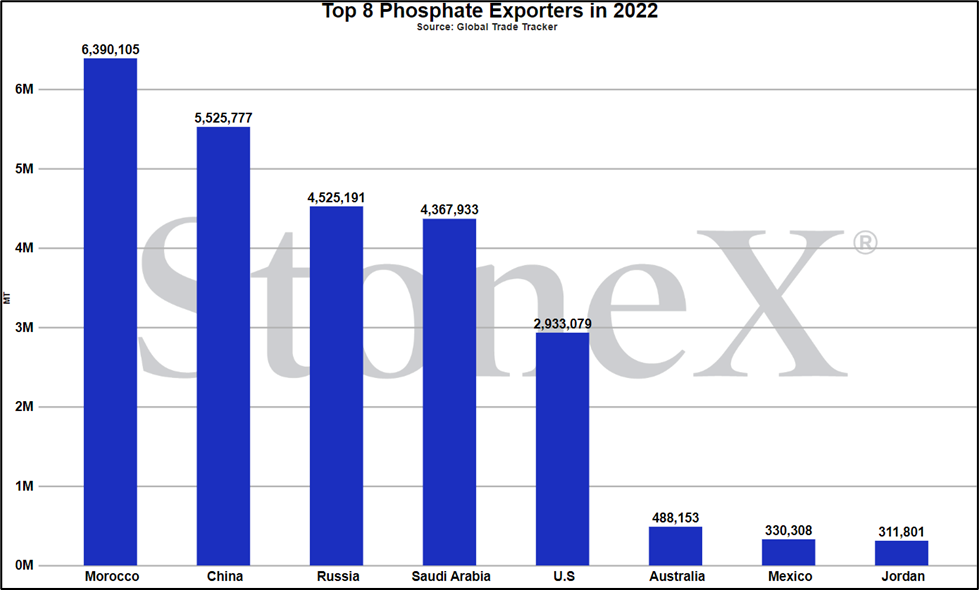
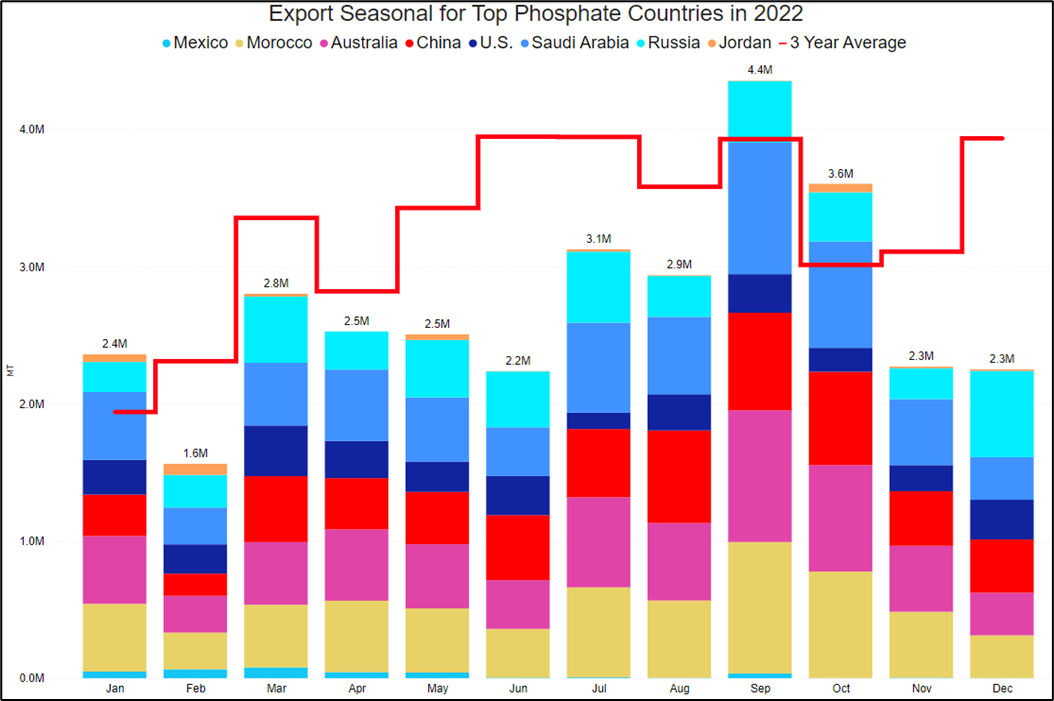
China is the world's largest producer of DAP/MAP.
China is normally the world's largest exporter of DAP/MAP.
It makes sense that we should watch China for signs of where the market is going!!!!
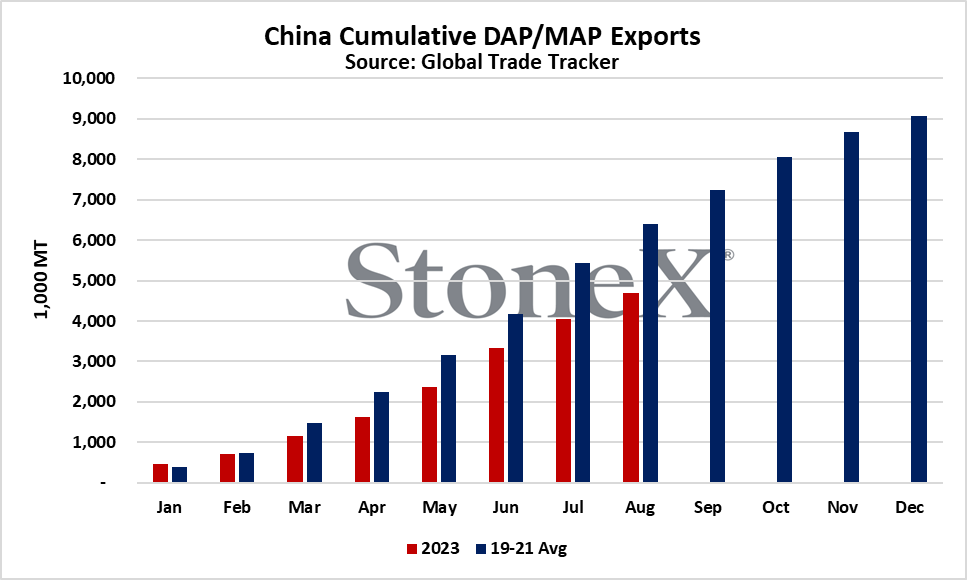
Unfortunately for those hoping for lower values, Chinese exports thru August fell further behind their average numbers.
- January thru August 3-year average (2019 - 2021) - 6.4MMT
- January thru August this year - 4.7MMT
While this is an improvement over last year's pace, it still shows their exports lagging traditional numbers which is leaving the world more tightly supplied than it would normally be.
Global buyers are holding out hope that Chinese export programs will begin to pick up pace and help supply even more supply to the marketplace. Unfortunately thru August, that is not the case.
Last month it was hurricanes. This month it is earthquakes. The common denominator is that the phosphate market continues to dodge bullets.
Last month, we talked about the Hurricane that traveled thru the Gulf of Mexico and launched into Florida just north of Tampa. Fortunately for the phosphate market, it moved just far enough north to spare the Tampa Bay region and as a result, spared phosphate production and shipping lanes.
This month, Morocco was devastated by a major earthquake that had horrible impacts on lives and buildings. From a fertilizer perspective, fears quickly grew that phosphate production facilities and supply lines were damaged and/or destroyed.
Fortunately, this was not the case. All mines/shipping lines/production facilities/ports/etc. were largely untouched and production continued with very little downtime.
While we were fortunate that neither event resulted in a market change, it does highlight how susceptible the global market is to singular events. We can believe that we have the market figured out...but it only takes one event completely out of our control to completely turn the market on its head.
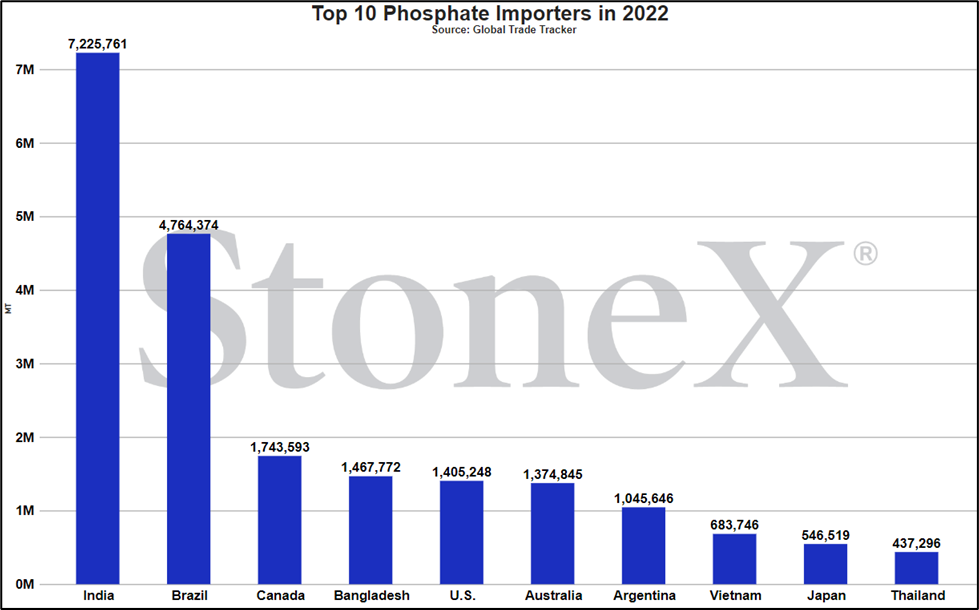
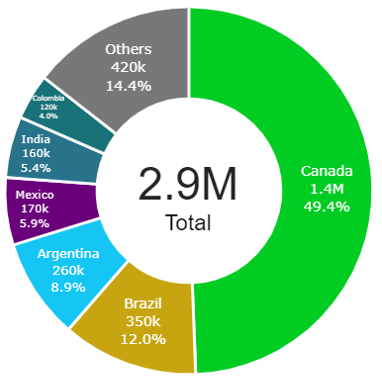
A quick glance at the top global importers of DAP/MAP above will show that India and Brazil rank numbers one and two in the world. If we need to focus on China due to their being the largest exporter, it makes sense to focus on two of the biggest importers as well!!!!
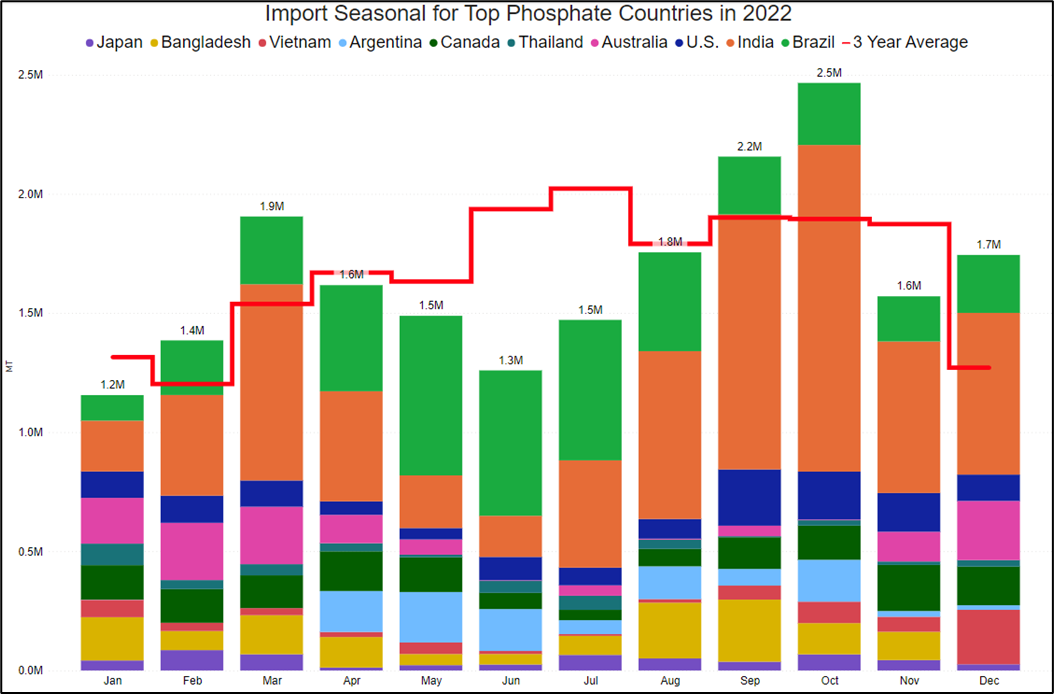
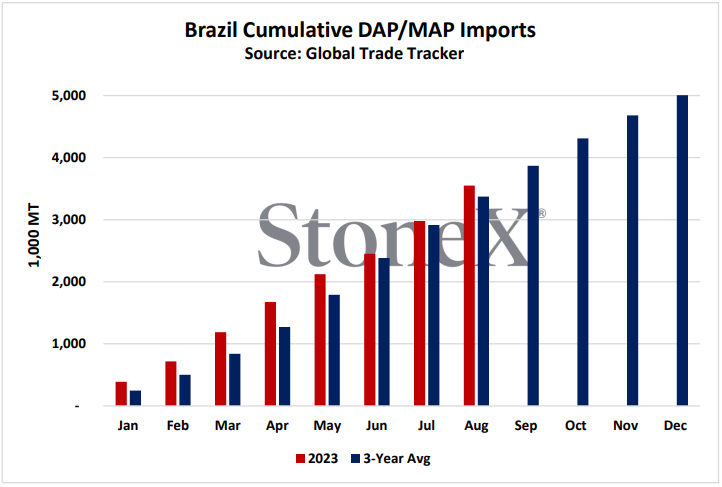
Brazil imports thru August continue to track just slightly ahead of their 3-year average with no signs of slowing down for the remainder of 2023. There is nothing there that raises our suspicions.
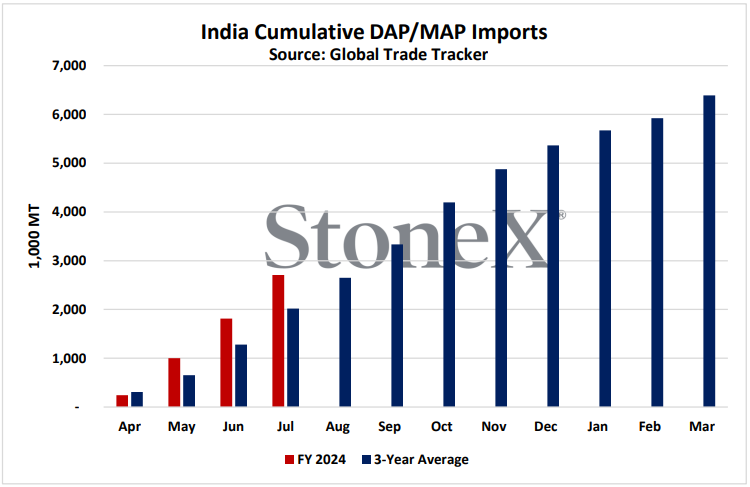
However, India continues to be WELL ahead of average with their pace thru July closing in on a million tons ahead of average. This, combined with Chinese exports being lowered, have combined to create a tight global S&D situation.
What India does going forward is what has my interest.
- Will they continue at this pace? - if this is the storyline, then phosphate likely stays firm. They are locking up a lot of available product around the world which is keeping manufacturers in control of price ideas.
- Will they be able to pause purchases in the coming months? - this is my fear. If they are this far ahead, do they reach a point where they look at stockpile and realize they do not need as much as is coming and as a result, shut down purchases. In this scenario, the world is left with little demand.
Today, we are not hearing anything one side or the other, but will continue to monitor the situation since its impact on the global market can be huge.
N.A. supplies remain very tight with MAP at a unheard of premium to DAP
Our story as spring application season came to a close was extremely tight inventories to close the season. That story persists today with the help of ongoing counter vailing duty rates against China, Russia and Morocco. Who are 3 of the largest global DAP/MAP exporters? China, Russia, and Morocco. The U.S., and Canada as a result, have cut much of the world import flow while exports are allowed to flow freely.
That brings us to today where supply availability continues to be a story as time for fall preparations comes to a close.
Retailers across North America continue to struggle with a phosphate market where timeliness of deliveries remains in question and price remains extremely high as phosphate values never reset like other fertilizer products. This situation is significantly worse for MAP users. Typically in the NOLA region, MAP is anywhere from even money to a $20 premium vs DAP. Recently, that spread has been close or slightly more than $100 over DAP...no, seriously.
I cannot stress enough about the need to talk to your retailer sooner than later when it comes to phosphate. Other fertilizers have done significantly more to lower their values vs the high's set April 2022. The price risk is not nearly as big as phosphate. That, combined with struggles to get refilled in time is plaguing the system. If you plan on applying phosphate, that conversation needs to be had.
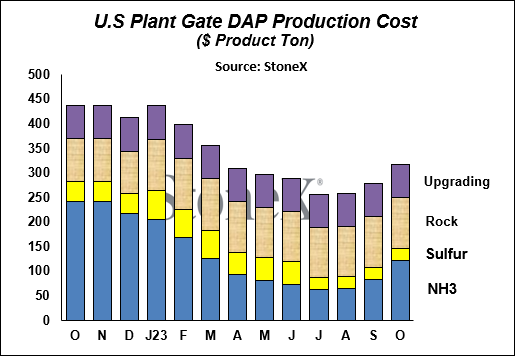
Huge Tampa NH3 price rally increases phosphate cost of production
If you hop to the NH3 newsletter, you will find more details on the story but the short version is that Tampa NH3 values have climbed significantly. Not only from the summer low's but from just last month. The October price was set at $185 higher than that of September with multiple global production issues.
That has pressed the cost of production in Florida to values not seen since March/April 2023.
This DOES NOT mean the phosphate market has to rally. Today, the NOLA barge trade values are still well above the cost of production. All this means is that the price floor has risen decently from their low's. In today's market, it chews into production margins. If the market were to start falling apart, that is when it would have an affect.
So this is one of those where this is more for your knowledge than it has to do with market structure. Better to know and learn today when it isn't needed that to start trying to explain when it is absolutely needed!
The past several years has been an unprecedented time of what has been kindly described as Black Swan events or events that are not seen very often but have huge implications.
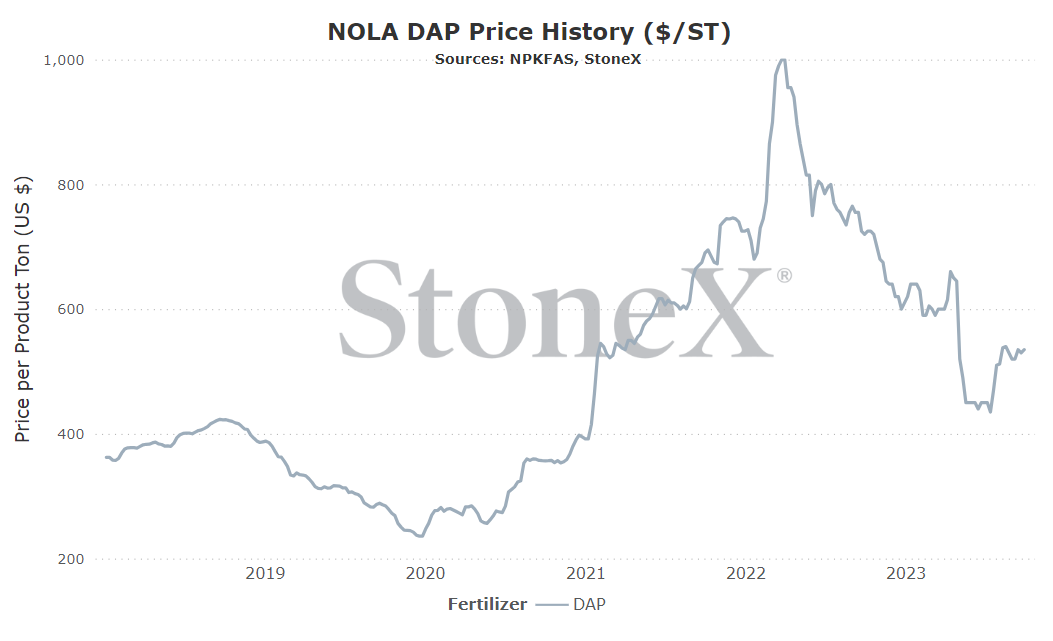
From my POV, it all started the summer of 2020 with U.S. counter vailing duty rates being imposed upon Morocco and Russia (Chinese rates were already in place). While the global S&D remained unchanged as a result, the U.S. (and Canada by proxy) saw 3 of the world's largest exporters of DAP and MAP cut from direct channels. Effectively, the bar to enter the U.S. was set too high for these countries to clear. Trade flows were changed.
For the most part, inventories had been sufficient and the NOLA DAP market has largely stayed in line with international values. Since this last spring, that no longer feels the case...and the challenges against the counter vailing duty rates are starting to mount.
Last spring, inventories got extremely tight which was evidenced by NOLA values rising toward the end of spring (against the typical pattern). That situation has not improved significantly. Imports so far have not been seen in a big way and buyers across N.A. are reporting struggles of securing product before the upcoming fall season.
Now, "suggestions" by groups are rising to reduce at least the rate against Morocco. More enticing for those hoping for a complete deletion of the rates is a judge who is challenging the case made by Mosaic on the onset of the rate hearing process.
Before getting your hopes up, please realize these processes take time and challenges against these types of duties are common and mostly ineffective. If the challenges are successful, there is very little hope that it will change what is happening for this fall. Frankly, I have doubts that it would be in time for next spring. Also, look at the graph below. Before the counter vailing duty rate case was brought forward in 2020, NOLA DAP values still followed world trends to a large degree. If these rates are struck down, N.A. will continue to ebb and flow with the world. We are not larger than the world phosphate market. We are part of it.
Still, for those struggling with phosphate inventories for this fall and have been frustrated by the lack of competition/options in the market, these challenges come as extremely positive news. While far from being successful, it is the biggest challenge mounted that we have seen thus far.
NOLA/New Orleans, Louisiana DAP price comparison
Number 5 global exporter in 2022
Price comparisons
Vs 30 days ago - +3% or approximately $15 higher
Vs 90 days ago - +19% or approximately $85 higher
Vs 6 months ago - -11% or approximately $65 lower
Vs 1 year ago - -26% or approximately $185 lower
Vs 30 days ago - +1% or approximately $9 higher
Vs 90 days ago - +19% or approximately $101 higher
Vs 6 months ago - -1% or approximately $5 lower
Vs 1 year ago - -19% or approximately $151 lower
U.S. Northern Plains Average price comparison
Vs 30 days ago - +1% or approximately $4 higher
Vs 90 days ago - +18% or approximately $89 higher
Vs 6 months ago - -11% or approximately $74 lower
Vs 1 year ago - -26% or approximately $211 lower
U.S. Southern Plains Average price comparison
Vs 30 days ago - +2% or approximately $13 higher
Vs 90 days ago - +16% or approximately $80 higher
Vs 6 months ago - -13% or approximately $89 lower
Vs 1 year ago - -25% or approximately $200 lower
Morocco DAP price comparison
Number 1 global exporter in 2022
Price comparisons:
Vs 30 days ago - +4% or approximately $20 higher
Vs 90 days ago - +28% or approximately $128 higher
Vs 6 months ago - -5% or approximately $33 lower
Vs 1 year ago - -28% or approximately $223 lower
Black Sea DAP price comparison
Number 3 exporter of DAP/MAP in 2021
Price comparisons:
Vs 30 days ago - +6% or approximately $29 higher
Vs 90 days ago - +22% or approximately $96 higher
Vs 6 months ago - -5% or approximately $27 lower
Vs 1 year ago - -19% or approximately $130 lower
India DAP price comparison
Number 1 global importer in 2022
Price comparisons:
Vs 30 days ago - +7% or approximately $40 higher
Vs 90 days ago - +32% or approximately $143 higher
Vs 6 months ago - +3% or approximately $17 higher
Vs 1 year ago - -19% or approximately $141 lower
China DAP price comparison
Number 2 global exporter in 2021
Price comparisons:
Vs 30 days ago - +2% or approximately $13 higher
Vs 90 days ago - +31% or approximately $138 higher
Vs 6 months ago - unchanged
Vs 1 year ago - -20% or approximately $148 lower
Saudi Arabia DAP price comparison
Number 4 global exporter in 2021
Price comparisons:
Vs 30 days ago - +6% or approximately $34 higher
Vs 90 days ago - +27% or approximately $123 higher
Vs 6 months ago - +1% or approximately $9 higher
Vs 1 year ago - -21% or approximately $157 lower
Brazil DAP price comparison
Number 2 global importer in 2021
Price comparisons
Vs 30 days ago - +3% or approximately $18 higher
Vs 90 days ago - +26% or approximately $115 higher
Vs 6 months ago - -9% or approximately $55 lower
Vs 1 year ago - -22% or approximately $155 lower
- Chinese exports continue to fall behind "average" export pace – sometimes, the flow or lack of flow from the world's largest producer and exporter should be taken into consideration for the global phosphate market. Oh, who am I kidding, it should ALWAYS be considered. While exports of DAP/MAP are better than last year, they are still trailing "normal". That means the world is still more tightly supplied than typical.
- World's largest importers either on or ahead of schedule – mainly focusing on India/Brazil here. Brazil is slightly ahead of their average import pace while India is well ahead of import pace. If this continues, the heightened demand will continue to help press price ideas higher.
- N.A. inventories still tight following last spring – unfortunately, it does not feel like the phosphate market has done as good a job as the potash market has in getting refilled after a huge spring. As N.A. approaches the fall application period, it may quickly find that available in place supplies are not as ample as is typical and that resupply loads are longer to arrive...and higher priced.
- Phosphate values are still considered high – to be fair, the phosphate markets have come off a decent amount from their high's back in April '22. However, when looking at how much phosphate dropped against nitrogen and potash, it is nowhere near as much. That, in addition to some major grain ratios being on the high side, could spell trouble for demand. Will it go to zero? Of course not. Could we see farmers cut their rate 15 - 25%? Possibly. Can small percentage changes result in big market changes. Bet your butt they can.
- Ahead of schedule imports for India could mean lower demand in the near future – on the bullish factor side, I said that if India continues to buy at this pace, it could continue to boost price ideas. However, the opposite is also true. What if India gets comfortable with their inventories/stockpiles due to heavy import flows...then decides they can slow down or stop for a few weeks or longer? No doubt the market would take notice.
- Current challenges to CVD against Morocco could be successful – this is music to the farmers ears. In the summer of 2020, a counter vailing duty case was brought against Moroccan and Russian produced phosphate. Since that time, imports from both origins have gotten very low, keeping N.A. supplies tight and competition scarce. Now, there are challenges against at least the Moroccan piece of it. If these challenges are successful, imports can freely come to the U.S. (and as a result, Canada) and not only add supply to the market but also add competition.
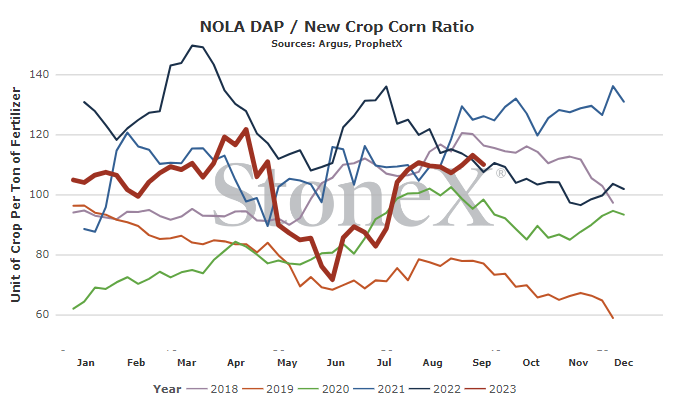
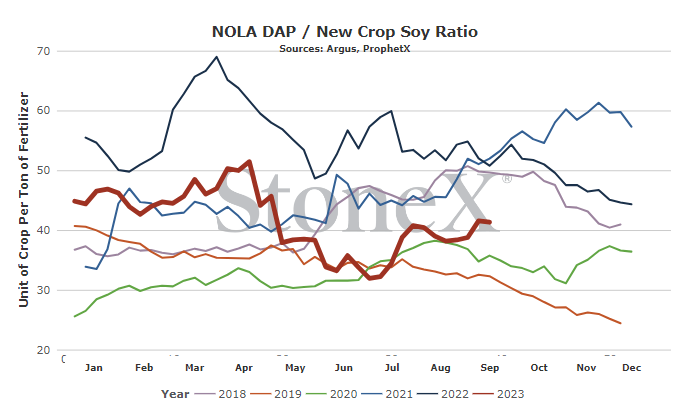
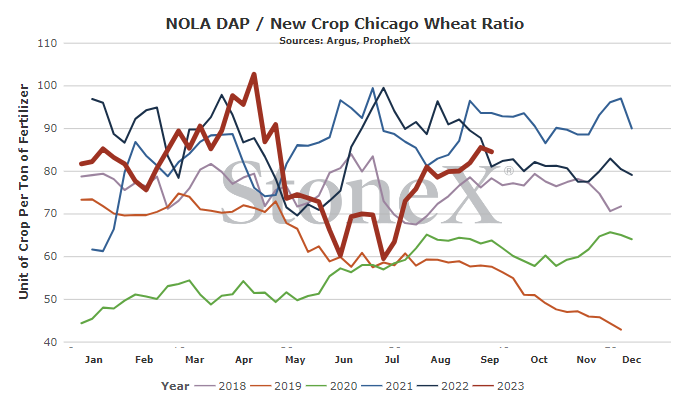
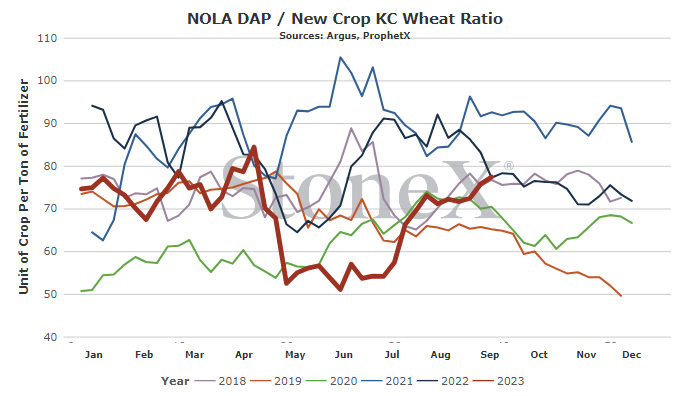
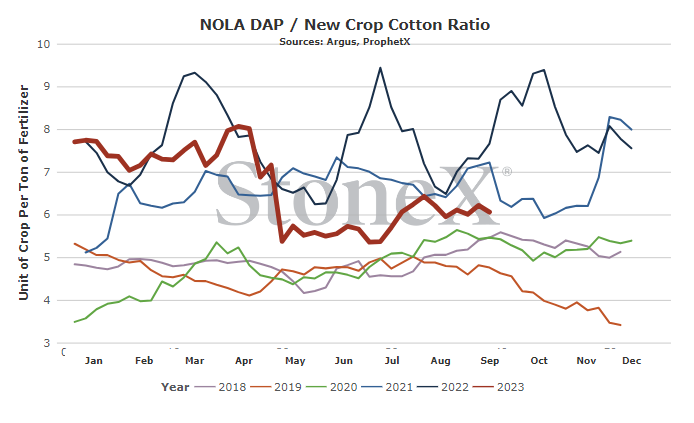
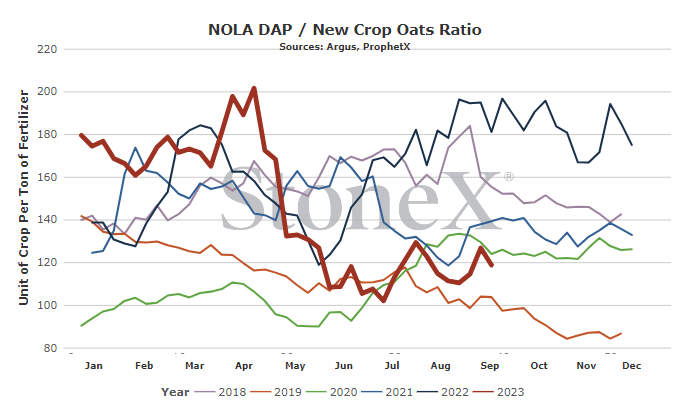
We believe that only looking at the flat price of either grains or fertilizer can be misleading:
-
Only selling grain can hurt you if fertilizer prices rise substantially
-
Only buying fertilizer can hurt you if grain prices fall
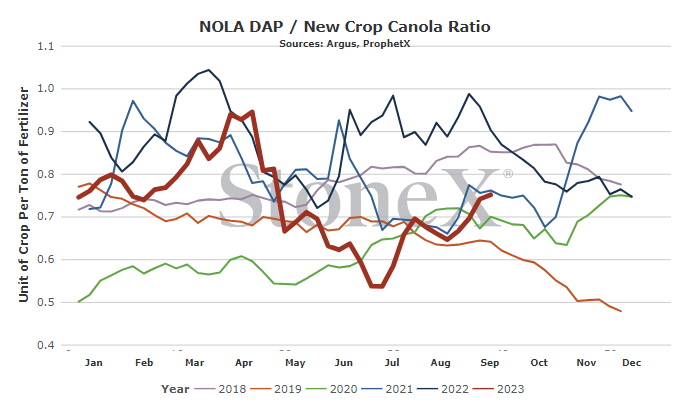
We look at the ratio "value" to get a better indication of where we are or how many bushels of X does it take to pay for 1 ton of fertilizer.
Would you rather:
-
Spend 150 bushels to pay for 1 ton of DAP
-
Spend 80 bushels to pay for 1 ton of DAP
When we compare the current ratio value against recent years, we start to see if we are high or low.
YOUR VALUES WILL LOOK DIFFERENT
This graph looks at the NOLA DAP price vs the flat grain price. There are no logistics on either product. Your location will look different due to fertilizer logistical costs, grain basis, etc.
- N.A. inventories...or lack of - in the potash section, I discuss how the N.A. marketplace is still reeling from last spring's huge run which emptied warehouses across the region. However, free import/export markets have allowed potash to get a lot of work done to refill the system. For phosphate, it hasn't been so "clean". Counter vailing duty rates continue to block 3 of the biggest global exporters of DAP/MAP from the U.S. (which hurts Canada in turn) while exports are allowed without hurdles. That, combined with the previous spring season which emptied the system, has turned N.A. into a VERY tight S&D. I cannot preach this enough, talk to your retailer about your fall needs. Things are tight out there.
- MAP is an insanely large premium to DAP for N.A. - typically speaking, NOLA MAP values are anywhere from even money to a $20 premium when compared to NOLA DAP. Today, that premium sits at $100+. No, I'm serious. That is how tight MAP supplies are today. The phosphate market is already dealing with a tight S&D. If you are a MAP user, it is worse. Have that conversation.
- Chinese export flow questions remain - for urea, China was making a major comeback as a normal exporter...until they were not...until now when we are not sure. The same situation can occur with phosphate with even larger ramifications given that they are the top manufacturer/exporter of DAP/MAP in the world. If they decide to cut phosphate exports, the global phosphate market should be bullish. If they return to normal export flows or more, the global phosphate market should be bearish.
- Will "low" potash values help phosphate demand this fall? - for many farmers, the idea of paying to apply their potash and phosphate separately is ludicrous. I'm guessing most of you will agree. So that begs the question: will the high price of phosphate hurt potash demand or will the low price of potash help phosphate demand? Today, my POV is that the low price of potash will help pull phosphate demand forward, but that remains to be seen.
All data was sourced from StoneX unless otherwise noted.
This material should be construed as market commentary, merely observing economic, political and/or market conditions, and not intended to refer to any particular trading strategy, promotional element or quality of service provided by the FCM Division of StoneX Financial Inc. (“SFI”), StoneX Financial (Canada) Inc. (“SFFC”) or StoneX Markets LLC (“SXM”). SFI, SFFC and SXM are not responsible for any redistribution of this material by third parties, or any trading decisions taken by persons not intended to view this material. Information contained herein was obtained from sources believed to be reliable, but is not guaranteed as to its accuracy. Contact designated personnel from SFI, SFFC or SXM for specific trading advice to meet your trading preferences. These materials represent the opinions and viewpoints of the author, and do not necessarily reflect the viewpoints and trading strategies employed by SFI, SFFC or SXM. The FCM Division of StoneX Financial Inc., a subsidiary of StoneX Group Inc., is a member of the National Futures Association (“NFA”) and registered with the U.S. Commodity Futures Trading Commission (“CFTC”) as a futures commission merchant and commodity trading advisor. StoneX Financial (Canada) Inc. is currently registered as a Futures Commission Merchant or equivalent in all provinces of Canada and is a member of the Investment Industry Regulatory Organization of Canada.




