

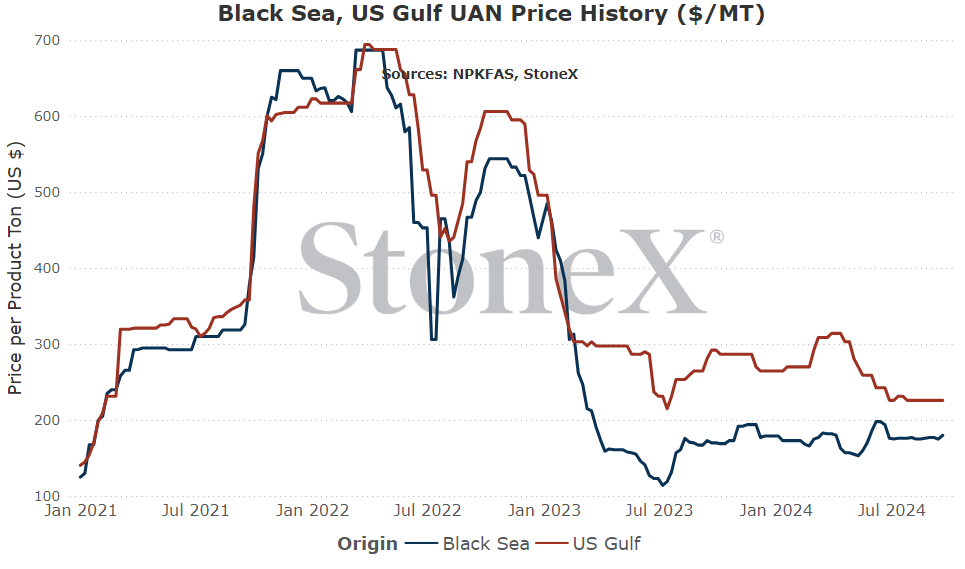
The intention of the below graphs are not to use to say "my price should be X based on this graph". These prices are derived from an FOB price point average. The intent is to show major global price movement trends. Your values will likely have significant basis difference (similar to your local grain price being different than the traded market price).
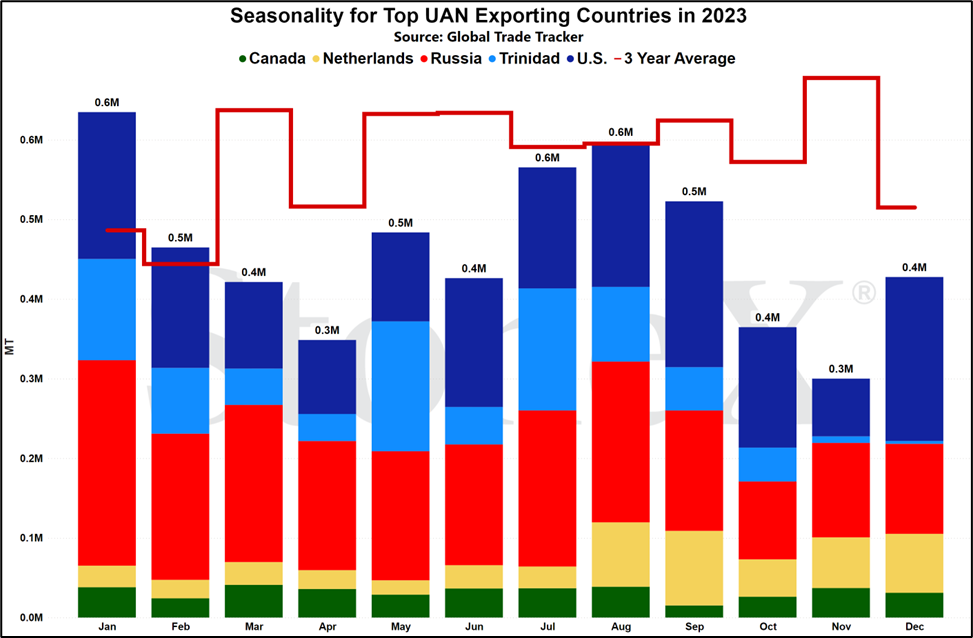
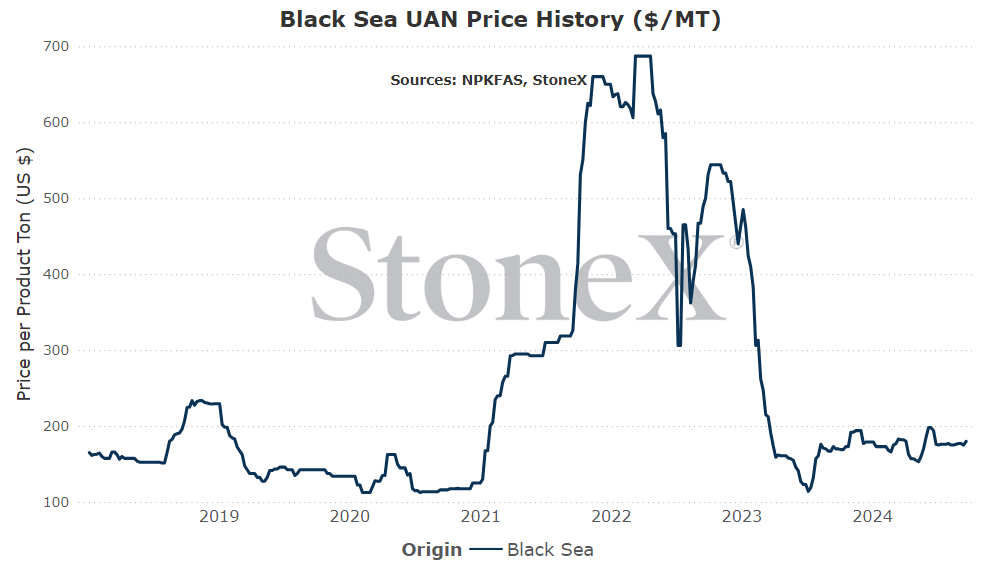
This graph is labeled as MT in USD currency.
EU production remains at 75% of normal, cutting global supplies
It's the story that keeps on giving, Clark...
Another month and another lack of change from the EU region. Natural gas values remain decently higher than what has been considered historically "normal" for the region. Russia supplies dried up following the argument surrounding the Nordstream 2 pipeline and then Russia's invasion of Ukraine. Dutch TTF values as a result went from single digits to a high of $103MMbtu and now back into the $11 - $13 range (depending on the day). Fortunately, production rates have improved significantly from where they were when natural gas prices topped out. Unfortunately, rates are still 75% with little to no signs of improving short term.
So what does that actually mean?
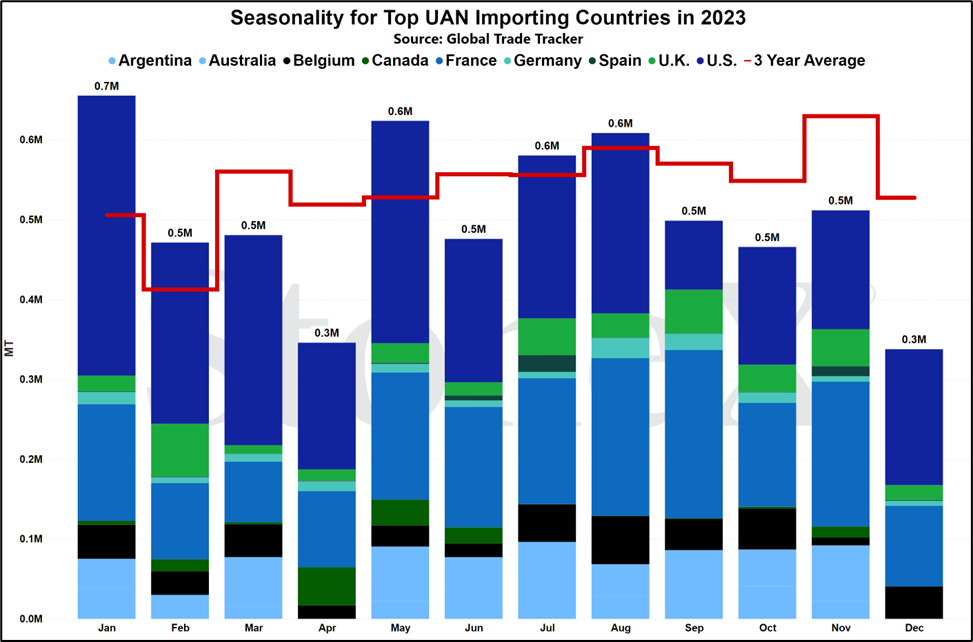
When we look at the whole of Europe (west/central/east), they would normally produce around 9M tons of UAN. 25% of that is around 2.25M tons that is "missing". Globally, there is around 33M tons produced so that 2.25M is a significant number (even more significant with Trinidad hiccups...). This shortfall in production has caused Europe to become an unnatural buyer and as a result, has gifted manufacturers in places like Trinidad and North America new demand that help alleviate unsold inventories when their domestic buyers are not interested.
There is little hope of values returning to normal near term. Remember that the Nordstream pipeline was destroyed/attacked. At least for a section of that pipe, sea water has been inside and is likely eating the metal and making it useless going forward. While repairs can be made, that isn't expected as Russia continues its invasion of Ukraine. Just seems as though this will be a story that I can copy/paste for the next several editions...
What does this means for farmers?
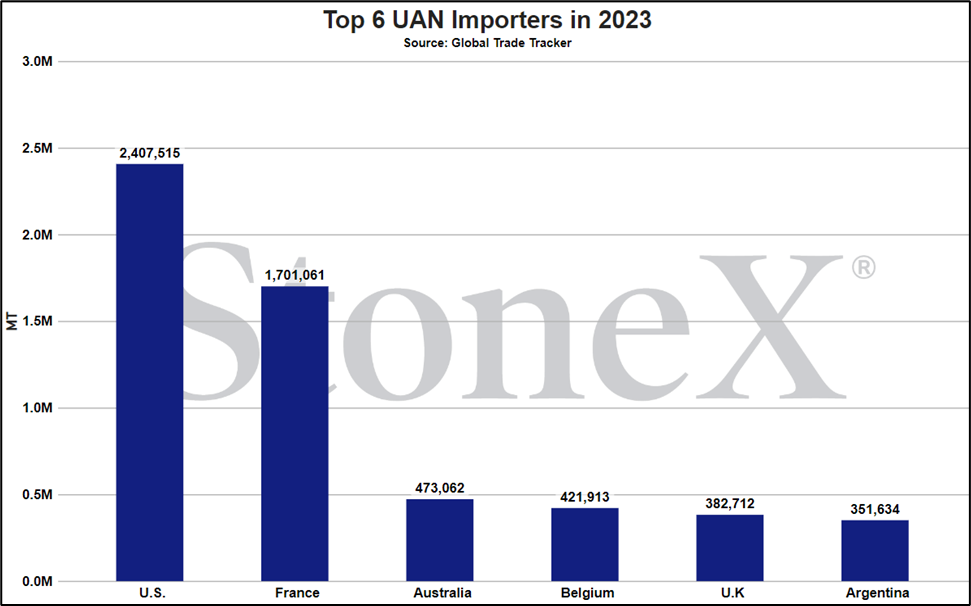
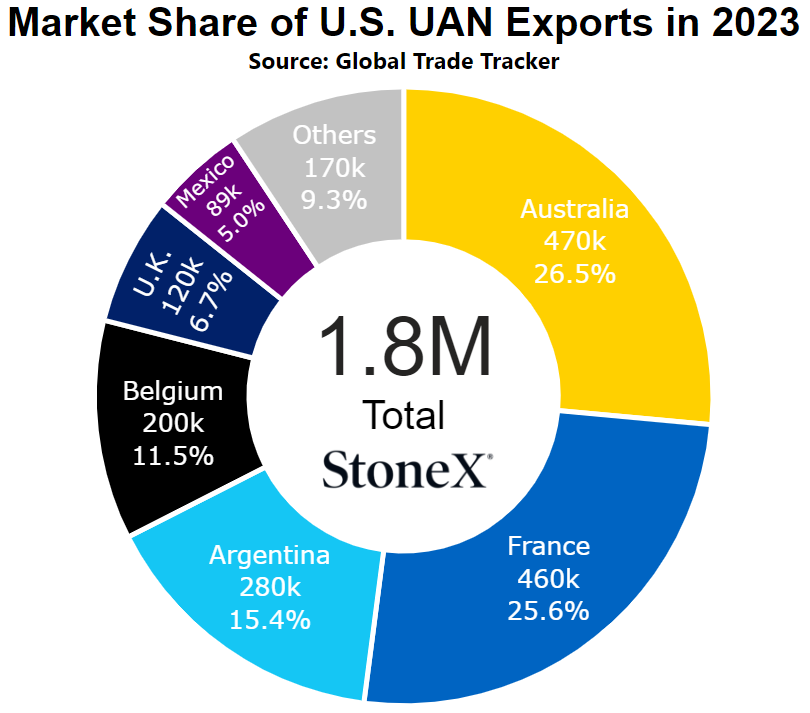
If you are a European farmer, it means that your price is much higher due to higher production costs and the necessity to call upon imports. If you are a North American farmer, it means your price is higher because manufacturers have a relief valve of sorts. If they offer pricing to domestic markets and the answer is largely no thank you, rather than sitting there watching unsold inventory levels grow, they can export that product to Europe. It helps them keep a floor on pricing. If you are an Australian farmer, Australia is almost solely dependent on the U.S. for its UAN supplies today because the government has blocked Russian imports so what happens in the U.S. happens to you.
All in all, less EU production means less global supply which is a bullish point.
Trinidad production curtails due to tight gas supplies
Speaking of production issues...Trinidad.
For a little while, Trinidad has struggled with insufficient natural gas supplies. This has seen some of their sectors, including nitrogen production, curtail until supplies improved. Fortunately, earlier this year, the government approved the development of previously untouched territorial waters/supplies. Very quickly we saw partnerships and investments made to build out this new territory. This should help Trinidad to rebuild their natural gas supplies to solid levels that should keep industrial demand steady...eventually, but not today. That development will take time.
Today, the struggle continues and in the last month, we have continued to see and hear nitrogen production problems. Worsened production rates lowered available UAN for export and as a result, we have seen U.S. manufacturers enjoying the benefit as they backfill the void.
Hopefully these issues will be fewer in the immediate future and almost non-existent in the further future but today, it is a story that is very real and has very real world implications.
What does this means for farmers?
When U.S. manufacturers came out with summer fill programs, we saw a lot of push back. Farm economics were very poor so farmers were unwilling to lock in on price. Retailers feared the market and without farmer support also said no thank you. Normally, that would have meant that values started to slide as unsold inventories grew...normally.
With so many export opportunities, manufacturers are able to have options. When basically told no by domestic buyers, they shifted and started exporting product at similar values. That helped them keep a comfortable sales book in place and allowed them to be patient for either the markets to improve or for demand to become impatient.
We have not seen values shooting higher as it has continued to trend along with urea but it certainly did help values from sliding.
Will Russian UAN production shift more to urea?
The global markets are struggling with tighter supplies of both urea and UAN. From my perspective, both are about to move into a sellers paradise...but which is worse?
In the urea world, it is bad. Chinese exports do not exist. Egypt continues to have hiccups. The EU region continues at 75% operating rates. Brazil is offline. The UAN side is bad, but doesn't seem as bad. As mentioned with urea, production rates are around 75% of normal and Trinidad has had some short-term issues.
So now look at it from Russia's POV.
For UAN, you are very reliant on the U.S. continuing to be willing to accept your shipments and you know that domestic U.S. manufacturers would love nothing more than for the government to block you. It almost has a "living on borrowed time" feel. However, if they can shift more production to urea, it feels much tighter and there are a LOT more buyers around the world that are friendly.
So why continue to try and shove a square block into a round hole...I'm not sure which nation is which but just go with it!!!!
I cannot speak intelligently about Russia's ability to sway urea/UAN production back and forth but if I were them and I had the opportunity, I might be leaning a little harder on urea today...
What does this mean for farmers?
Let's go with the idea that Russia suddenly adopts the "make more urea and less UAN" approach.
This would further reduce global supplies of UAN in a market that is already tightly supplied. That is bullish in itself. Now, think about it from different regions.
- EU farmers - less likely that U.S. manufacturers need your business with imports slowing. Why would U.S. manufacturers run the risk of raising the governments ire if they can force domestic buyers to come to them?
- North American farmers - Russian imports of UAN have helped to keep some competition alive. If those imports slow/stop, we lose that competition. Sure, UAN still needs to follow urea to a certain extent, but it likely would continue to do so at a little bit more of a premium.
- Australia farmers - with imports being solely reliant on the U.S., what happens there happens to you. If U.S. manufactures no longer need export relief valves, you have to pay a higher price to convince them to come.
The simple story is that less supply and even demand cause prices to rally, but each area has its own distinct reason.
NOLA/New Orleans, Louisiana
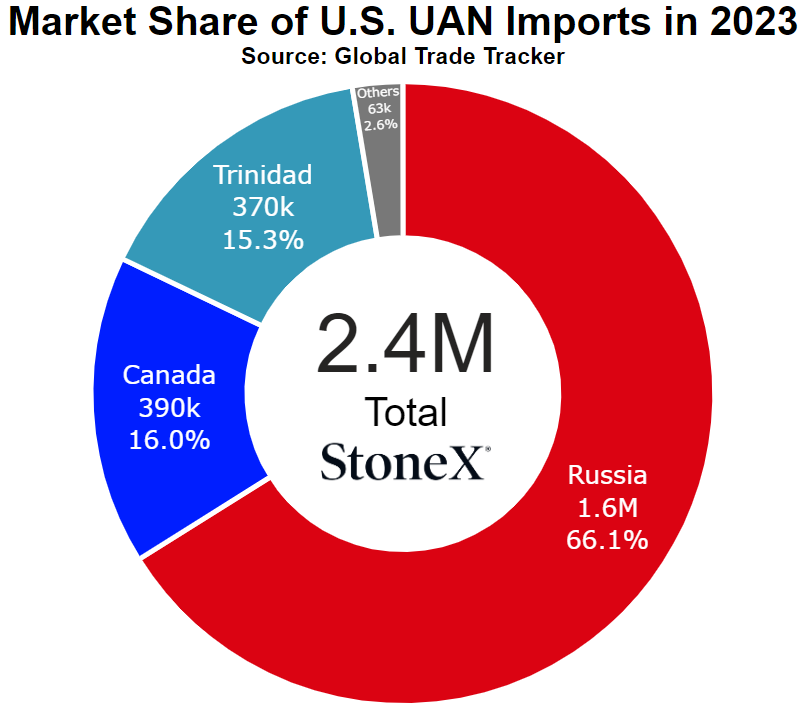
Number 2 global importer in 2022
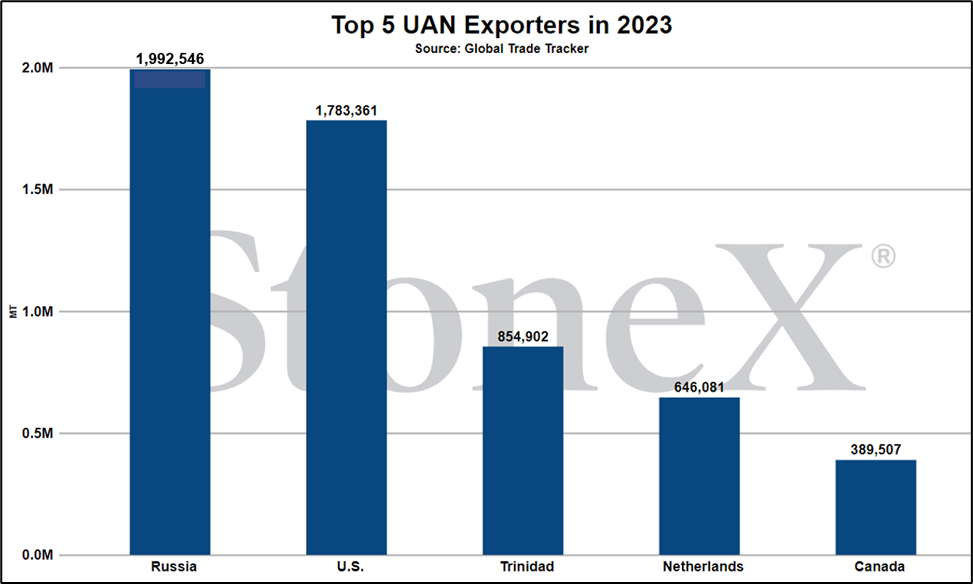
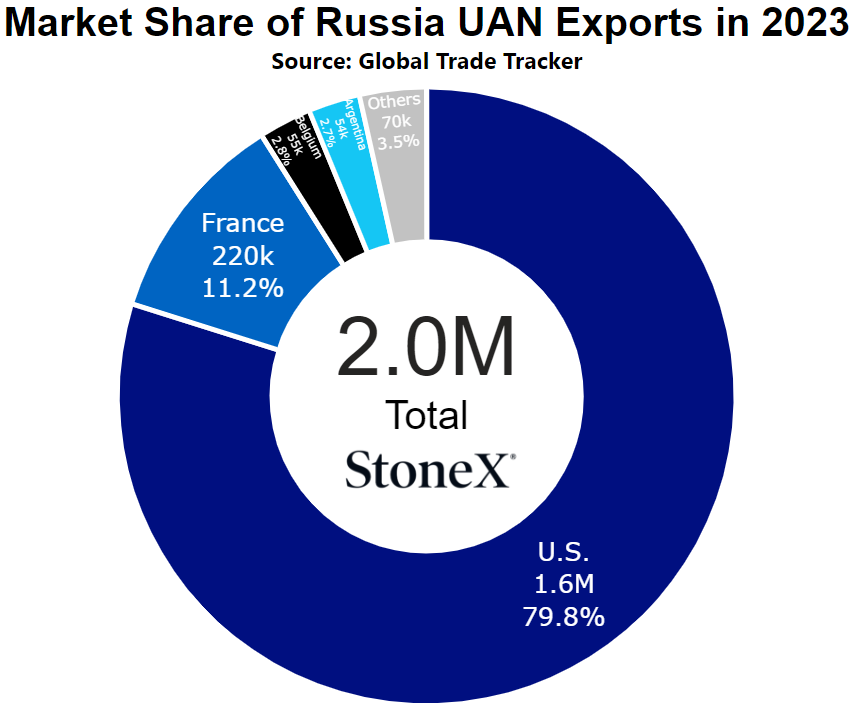
Number 1 global exporter in 2022
Price Comparisons
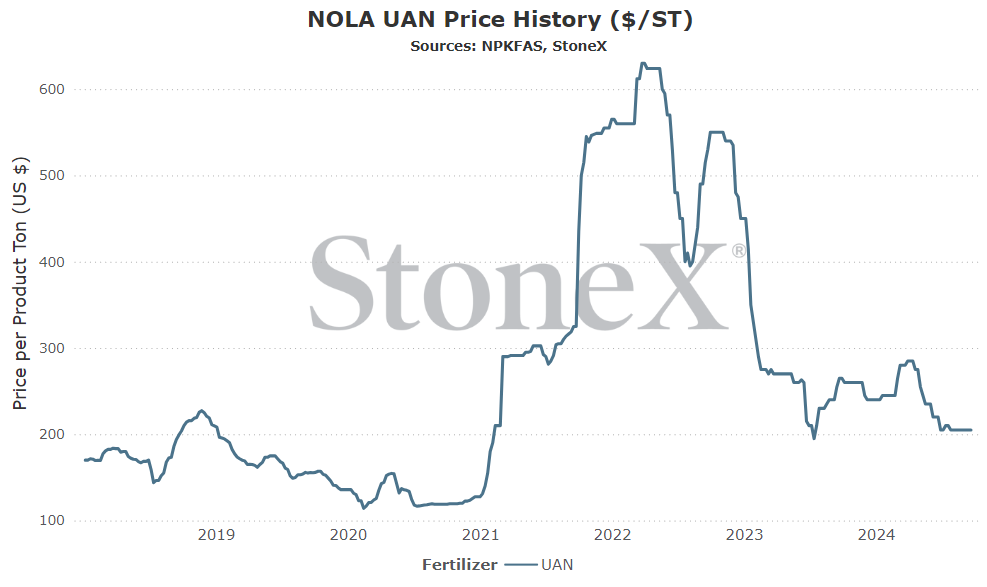
Vs 30 days ago - unchanged vs last month
Vs 90 days ago - -7% or approximately $15 lower
Vs 6 months ago - -28% or approximately $80 lower
Vs 1 year ago - -23% or approximately $60 lower
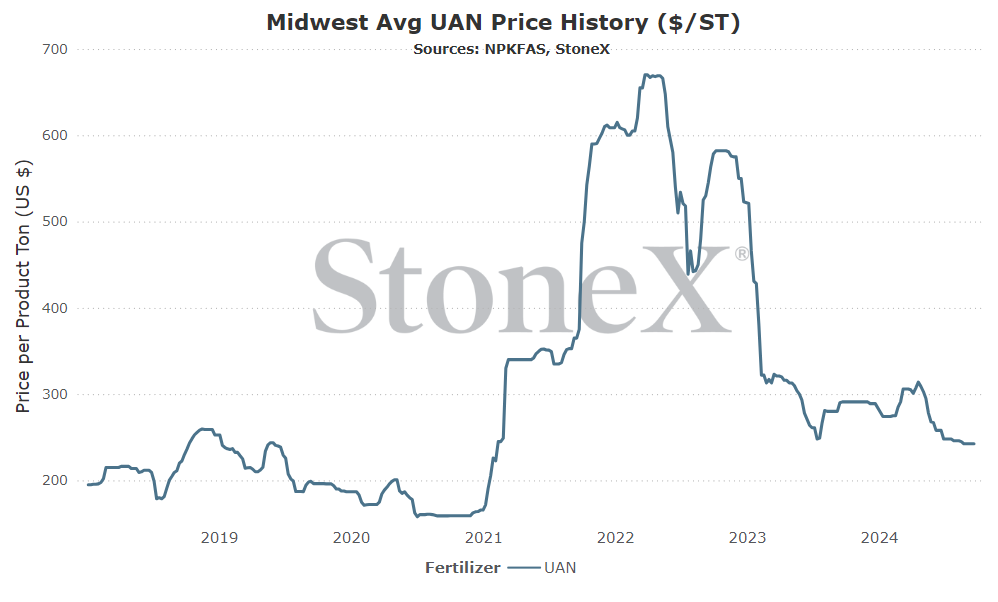
U.S. Midwest Average
Vs 30 days ago - unchanged vs last month
Vs 90 days ago - -6% or approximately $16 lower
Vs 6 months ago - -20% or approximately $62 lower
Vs 1 year ago - -17% or approximately $49 lower
Black Sea (Russia)
Number 2 global exporter in 2022
Price comparisons
Vs 30 days ago - 2% or approximately $4 higher
Vs 90 days ago - -7% or approximately $14 lower
Vs 6 months ago - -1% or approximately $2 lower
Vs 1 year ago - 6% or approximately $11 higher
- Further cuts to EU production rates – with west/central Europe still at an approximate 75% operating rate, that equates to roughly 2M tons per year of UAN not being produced. Unfortunately, that rate has not improved for a while. Fortunately, it has not gotten worse. Unfortunately, it can certainly get worse. Europe has had a couple very mild winters back to back which helped to lower natural gas values. If they make up and have a very harsh winter, we could certainly see gas values rise...and production rates of UAN fall.
- Trinidad production issues continue – on the plus side, Trinidad has approved the development of new natural gas waters in its territory. Unfortunately, it will take time to develop the production. Until then, I'm afraid Trinidad nitrogen production curtailments could be a fairly common story. Every week they scale back/shut down are tons of UAN lost in an already tightly supplied global market.
- U.S. imposes import duties on Russia – this still remains very low on my probability list...but it looms large on the impact list. If we were to see the U.S. start taking steps to limit or ban Russian imports of UAN, we would no doubt see domestic values rally very quickly. Russian imports have helped to offset U.S. exports and keep our values relatively stable. I want to believe D.C. wouldn't even think of doing this to N.A. farmers...
- Buyers/farmers continue to drag their feet – farm economics for 2024 remain poor. Farm economic forecasts for 2025 remain poor. Spring application remains a long way away. While there are certainly things to fear in terms of UAN prices going higher, buyers largely do not care today and are opting to wait to purchase. This is causing the market to stall. This happens long enough and manufacturers may need to start changing their approach to move product.
- EU/Trinidad production returns to normal – this doesn't seem likely but given how important they are on the bullish side, it is worth remembering on the bearish side. If we were to see either/both return to full production form, that would be a boost to global supplies which should lean on values.
- Substantial shift in 2025 acreage mix that hurts N demand – today, we are holding steady on our 2025 acreage mix which means our overall N demand remains steady/slightly higher than last year...but that isn't guaranteed. Markets change all the time and we are a very long way away from spring planting. Intentions can change and if they change away from nitrogen needing crops, we could see price pressure on UAN.
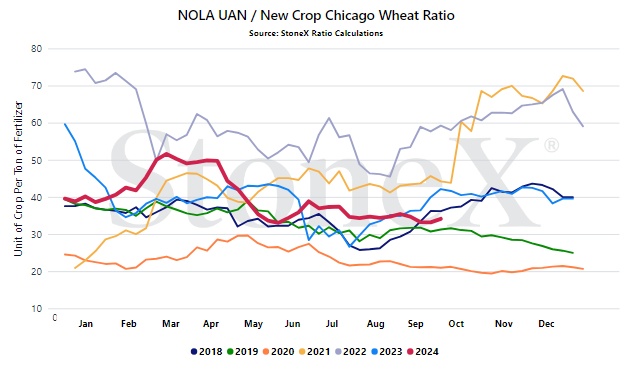
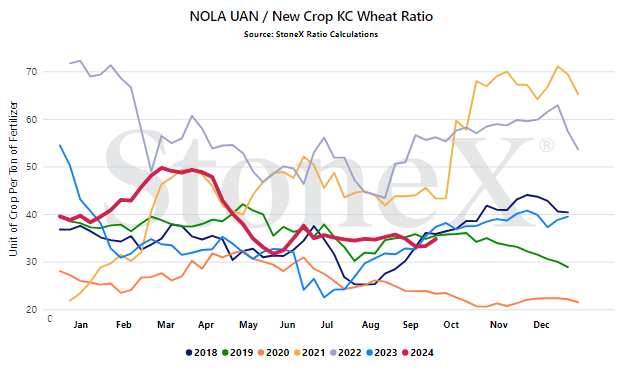
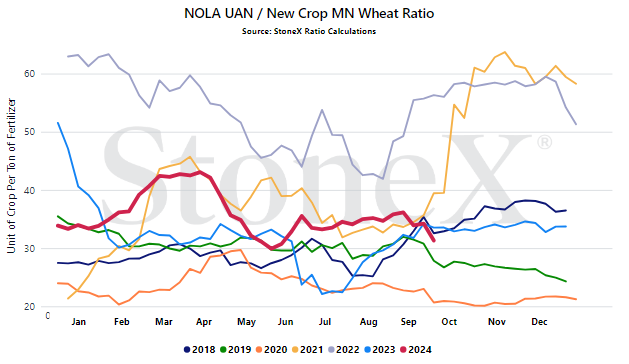
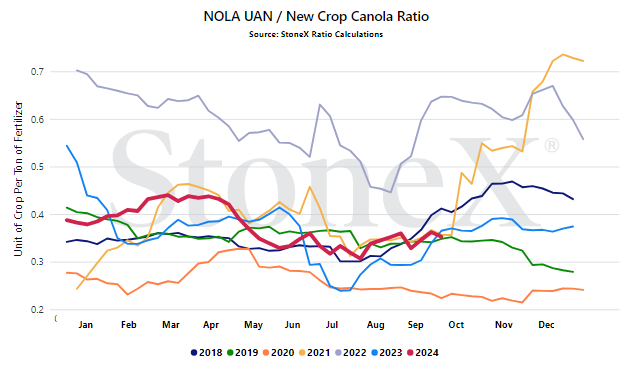
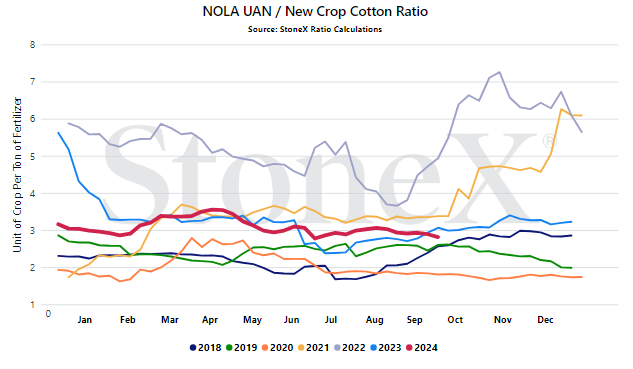
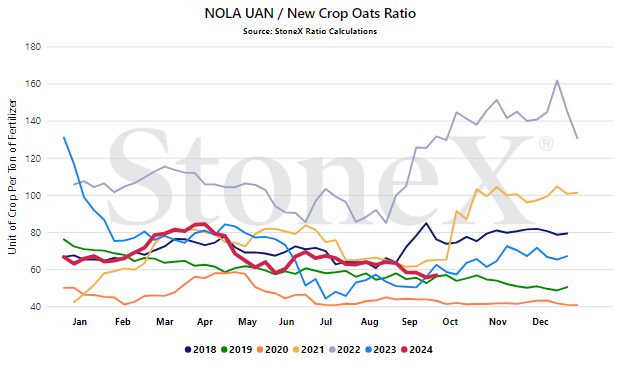
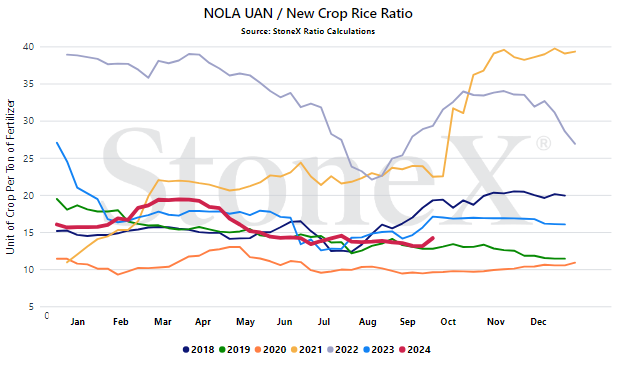
We believe that only looking at the flat price of either grains or fertilizer can be misleading:
-
Only selling grain can hurt you if fertilizer prices rise substantially
-
Only buying fertilizer can hurt you if grain prices fall
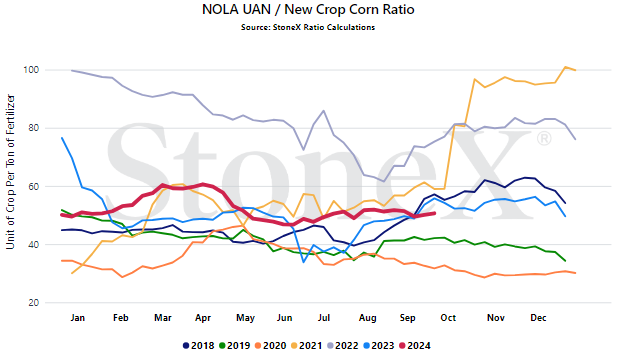
We look at the ratio "value" to get a better indication of where we are or how many bushels of X does it take to pay for 1 ton of fertilizer.
Would you rather:
-
Spend 100 bushels to pay for 1 ton of UAN
-
Spend 60 bushels to pay for 1 ton of UAN
When we compare the current ratio value against recent years, we start to see if we are high or low.
YOUR VALUES MAY LOOK DIFFERENT
This graph looks at the NOLA UAN price vs the flat grain price. There are no logistics on either product. Your location will look different due to fertilizer logistical costs, grain basis, etc.
- EU/Trinidad production rates - when compared to urea and NH3, the global UAN market is significantly smaller...which means that production hiccups are felt that much worse. The EU region is unchanged with production rates at 75% of normal due to high natural gas values. That has removed 2+M tons of production from the world. Recent Trinidad production curtailments due to tight natural gas supplies highlights how quickly another major player can be lost. Fortunately, global UAN values continue to be following in urea's footsteps but a couple more issues like this and it could cause UAN to break away on the higher side.
- U.S. imports/exports - UAN exports from the U.S. continue at a heavy pace. This has been helped recently with Trinidad production issues. July saw exports of 226K tons with almost all of those tons leaving North America (Australia/Argentina/France/Columbia). Normally, a lack of buying domestically would cause weakness in values but the fact that manufacturers have a "relief valve" in exports gives them more time. Fortunately, imports continue as well though they were a bit short at 121K. This dynamic needs to continue to be watched, especially if steps start being taken to block certain imports. If we lose that, hard to see where UAN wouldn't move higher...
- Farmer sentiment with spring so far away - while most of my outlooks foresee higher UAN values, I cannot understate pissed off farmers. Farm economics stink for 2024. Farm economics stink for 2025. Yes, the demand outlook still looks solid and exports continue to be a thing...but do not underestimate farmers. We could see demand remain nearly non-existent for a while longer. April/May is still a very long way away. If this happens long enough, maybe we see some short term weakness. Maybe.
StoneX Ratio Calculation
The ratio calculation is derived from Bloomberg historical grains values as well as fertilizer values from StoneX, NPKFAS, and Argus.
The calculation is simply dividing the fertilizer price by each grain price.
All data was sourced from StoneX unless otherwise noted.




