

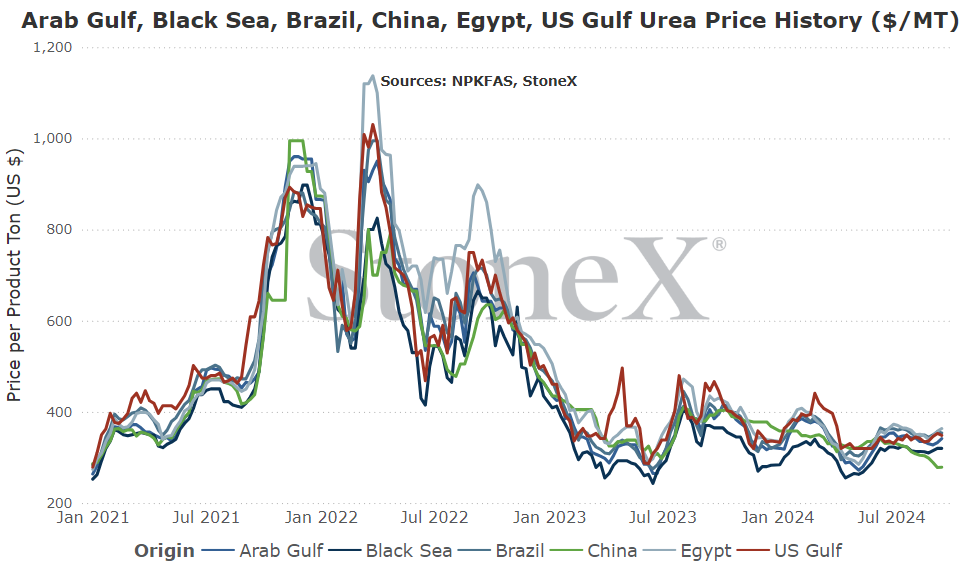
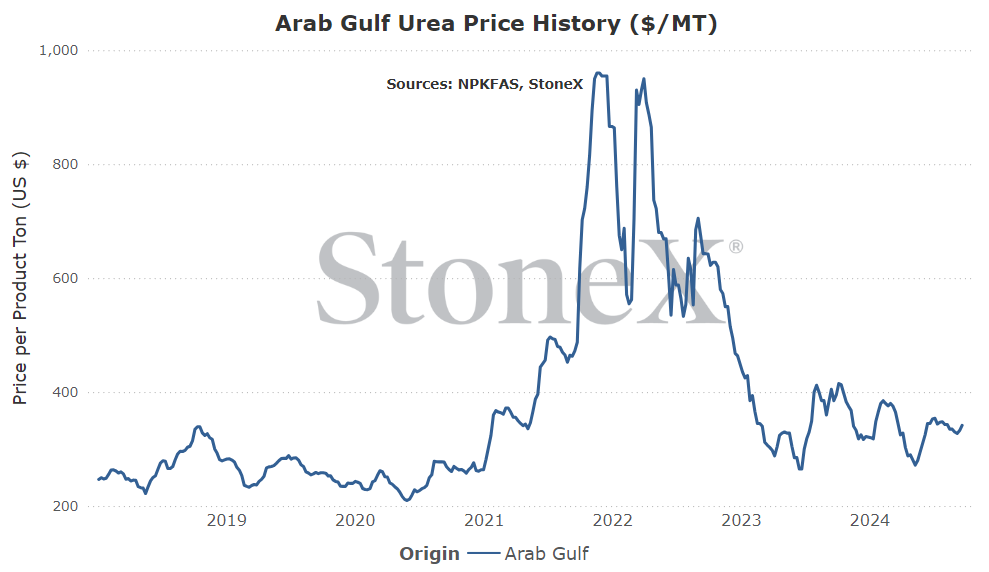
The intention of the below graphs are not to use to say "my price should be X based on this graph". These prices are derived from an FOB price point average. The intent is to show major global price movement trends. Your values will likely have significant basis difference (similar to your local grain price being different than the traded market price).
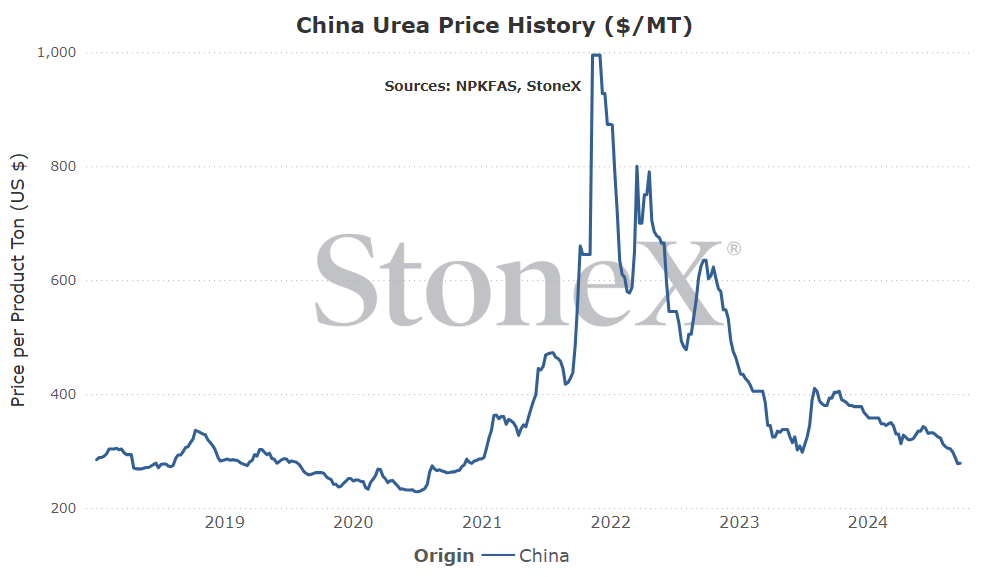
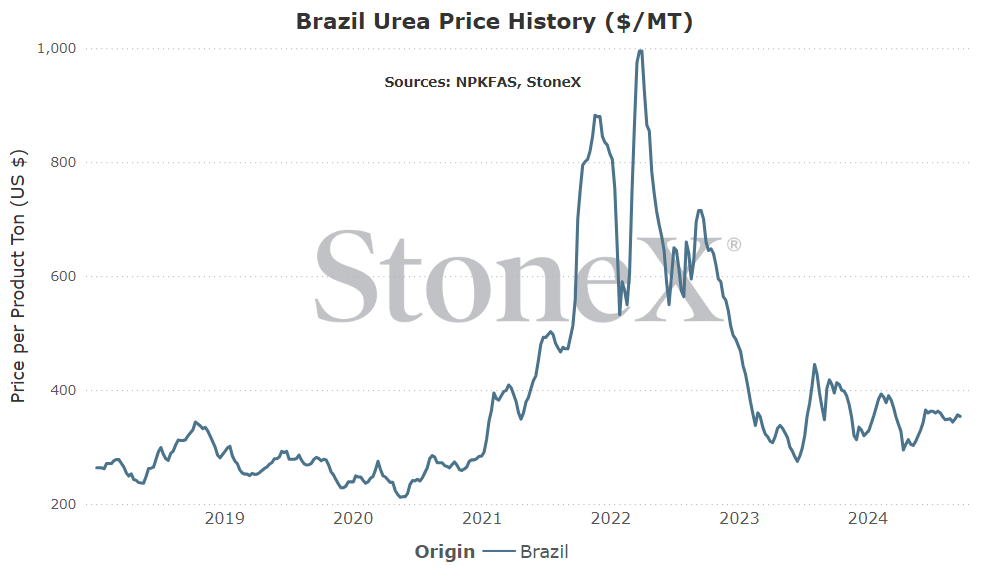
This graph is labeled as MT in USD currency.
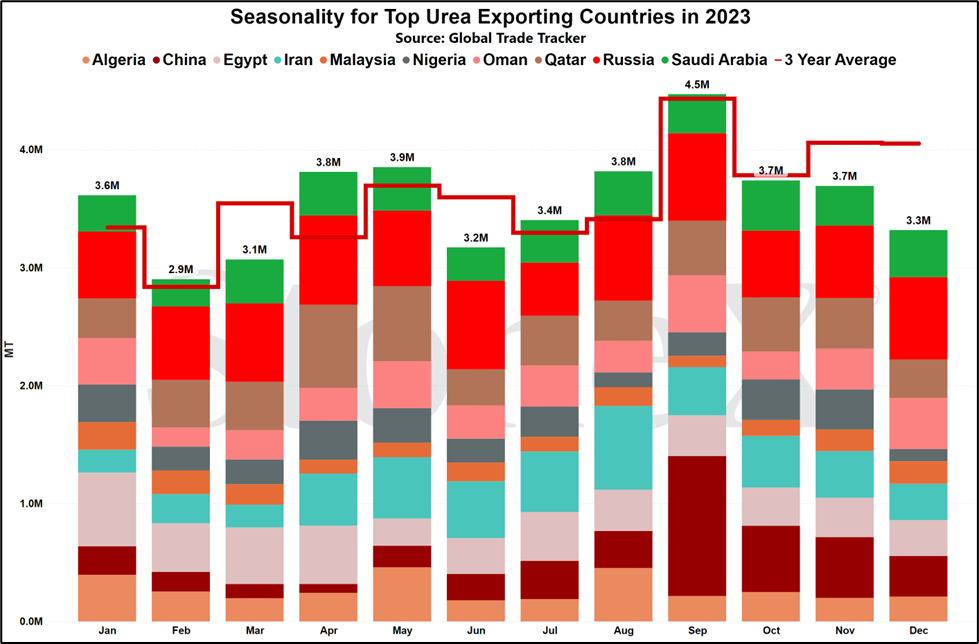
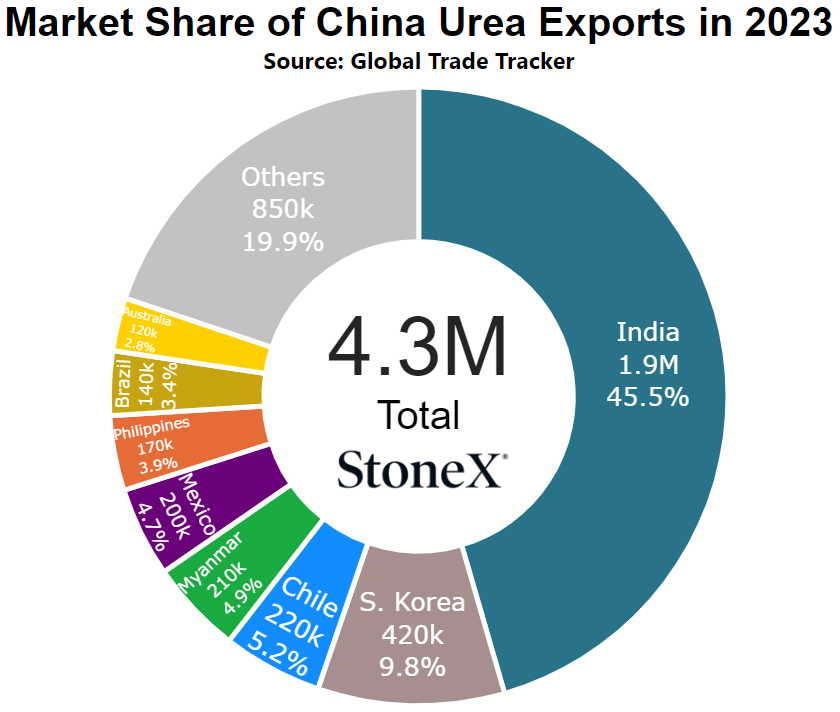
- Historic annual export volumes - 5M to 5.5M tons
- Believed daily urea Chinese production - 197,000 tons
The August export data brought China's 2024 calendar year cumulative total to approximately 245,000 tons. That means from January thru August, China has exported the equivalent of a little over a day's production. Think of the supply hole that leaves in the world.
Unfortunately, my hopes do not rise for the remainder of 2024. Based on the recently concluded India urea purchase tender, it does not look like China played any part. As a result, we expect September data to be meager at best. Then we look to Q4. Rumors/stories continue to paint a picture where the Chinese central government is continuing this approach of not allowing exports. They have now learned that by restricting exports, it keeps more than adequate supplies available for domestic farmers as well as keeping prices lower than global trends. For a Communist government, that is a win/win.
Now, one of the big questions is "where are the tons going"...and I do not have a solid answer for you. There are theories but they are just that:
- Production rates are much lower than reported - possible given how difficult it is to get information from China.
- Exports are occurring to neighboring countries but not being reported - I am not a believer of this one as I think the market would pick up/discuss it if it were happening.
- China is using it - this is my best working theory. The government has told its people it needs to be more self reliant on things like food. How do you grow more food? You apply more fertilizer. I know 5M tons is a huge amount but when you think of the size of China, it isn't completely out of the realm of possibilities.
- China will do a 180 and start exporting heavily soon - this is certainly possible. As they fill domestic storage, they realize their problem and start allowing heavy exports. This would be a big bearish factor.
Ultimately, like all things China, we have to make educated guesses and go from there. At this point, I am taking the approach that Chinese exports are gone until they are not. That is a global problem.
What does this mean for farmers?
In recent history, China has been an exporter of 5 - 5.5M tons of urea. Thru August, they haven't exported 250K tons. In recent conversations/presentation/interviews, I go in cocky and ready to say "China could easily leave a 4 - 5M ton supply hole in the market". However, I always get nervous and revise the number closer to a 2 - 4M ton range. With our now having August data and our firm belief that September will be no better, I'm getting bold again. The global urea export market is typically between 50 - 55M tons, and China could remove 10% of that total.
If this continues to play out, it continues to lend support to pricing which should be felt on all corners of Earth.
- EU producing 75% of normal - 3 to 4M ton shortfall (based on 15M/year production)
- China stopping exports - 4 to 5M ton shortfall (if export rates remain unchanged for 2024)
- Brazil production still offline - 1 to 1.5M ton shortfall
- Egypt production still having problems - several hundred thousand tons production lost
Some on that list were expected at the beginning of the year (EU and Brazil). However, the surprises hurt (China and Egypt). The thing that worries me is the total. 8 to 10+M tons not being produced/exported that would normally be there in the global S&D. When you look at global urea production capacity vs global urea demand, there isn't that big of a difference to take care of the shortfall.
Now, let me back up. I am NOT saying there will be outages. I'm done with that crap. At a price and a timeline, you can find it. However, what I AM saying is that inventories are tighter than they are feeling/being discussed today and I'm afraid this is the story that will emerge in the coming months. India moped up a lot of excess length in the last tender and will do more on that with this one. There is still a lot of global demand yet to step forward.
Not claiming this storyline is the gospel, but it demands our attention...
What does this mean for farmers?
It should mean higher prices at some point. Today, it seems the market is scared to death of taking price up too much too soon. They are hearing the horror stories of farmer economics and are afraid of further alienating their buyers...but that will only last so long. If/when the market discussion shifts away from fear and more toward confidence that demand IS there and supplies are not, that is when the price shift will occur.
I do not know when that happens. Of course, I cannot guarantee it happens. Still a lot of things that can change, but when I look at everything in the market, this is what it boils down to.
NOLA/New Orleans, Louisiana
Number 3 global importer in 2022
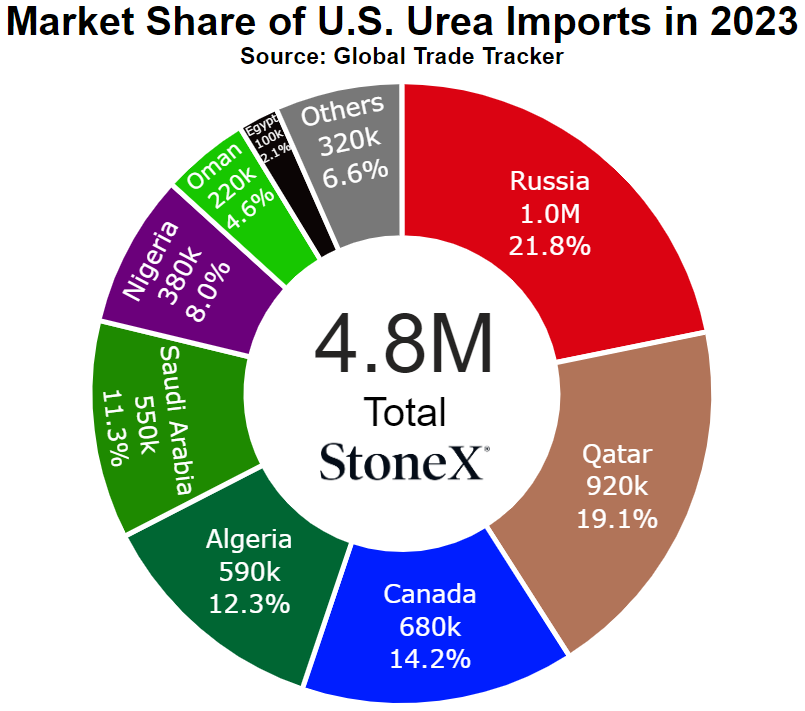
Price comparisons
Vs 30 days ago - 4% or approximately $13 higher
Vs 90 days ago - 4% or approximately $13 higher
Vs 6 months ago - -12% or approximately $44 lower
Vs 1 year ago - -25% or approximately $107 lower
U.S. Midwest Average
Vs 30 days ago - unchanged vs last month
Vs 90 days ago - -1% or approximately $3 lower
Vs 6 months ago - -22% or approximately $101 lower
Vs 1 year ago - -24% or approximately $114 lower
U.S. Southern Plains Average
Vs 30 days ago - -1% or approximately $5 lower
Vs 90 days ago - 1% or approximately $5 higher
Vs 6 months ago - -26% or approximately $125 lower
Vs 1 year ago - -25% or approximately $123 lower
U.S. Northern Plains Average
Vs 30 days ago - unchanged vs last month
Vs 90 days ago - -6% or approximately $21 lower
Vs 6 months ago - -22% or approximately $103 lower
Vs 1 year ago - -23% or approximately $106 lower
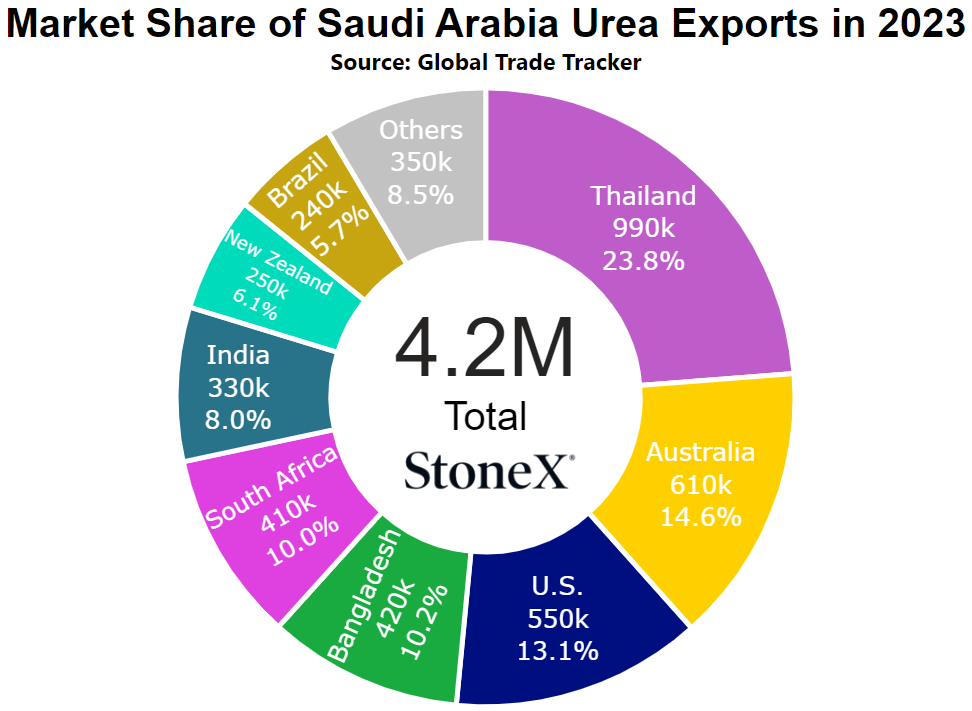
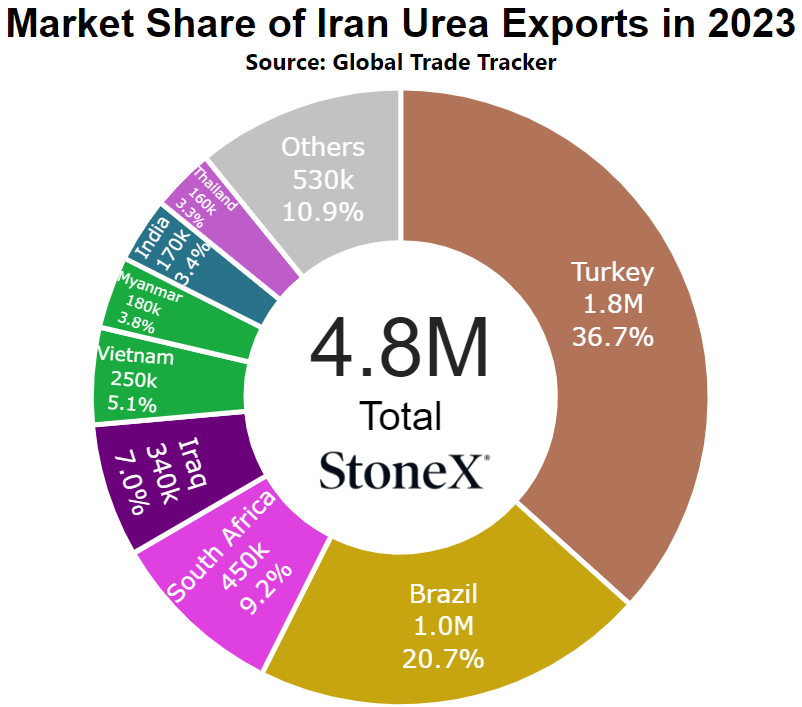
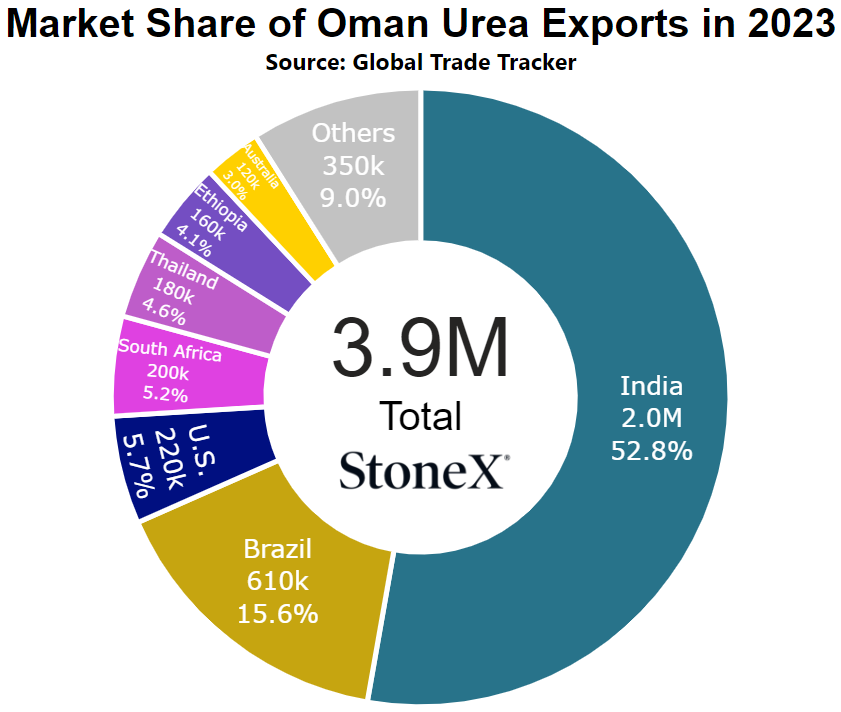
Middle East
Number 1 exporter (as a region, not as individual nations)
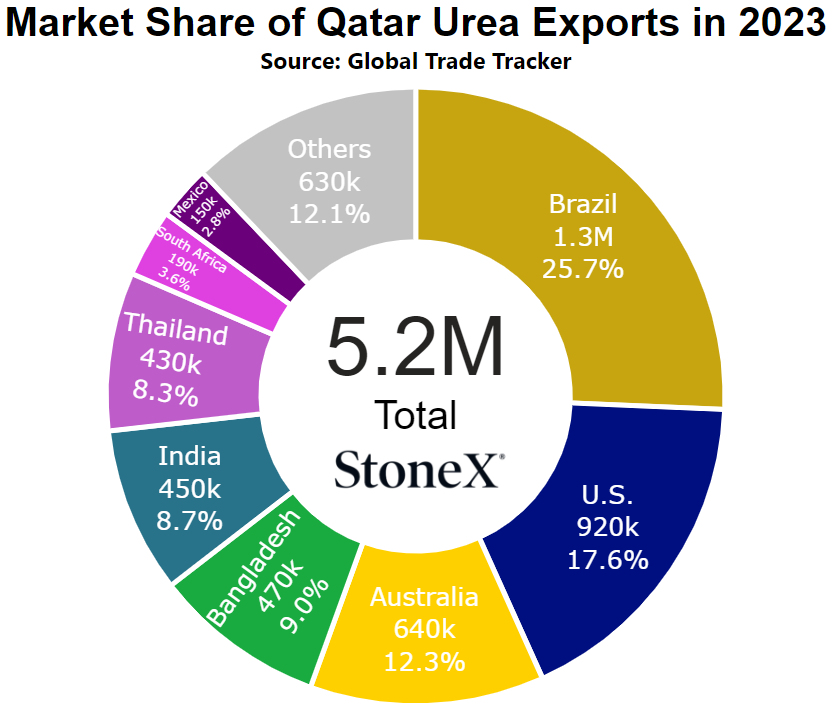
Vs 30 days ago - 2% or approximately $7 higher
Vs 90 days ago - unchanged vs 3-month earlier
Vs 6 months ago - 5% or approximately $17 higher
Vs 1 year ago - -11% or approximately $44 lower
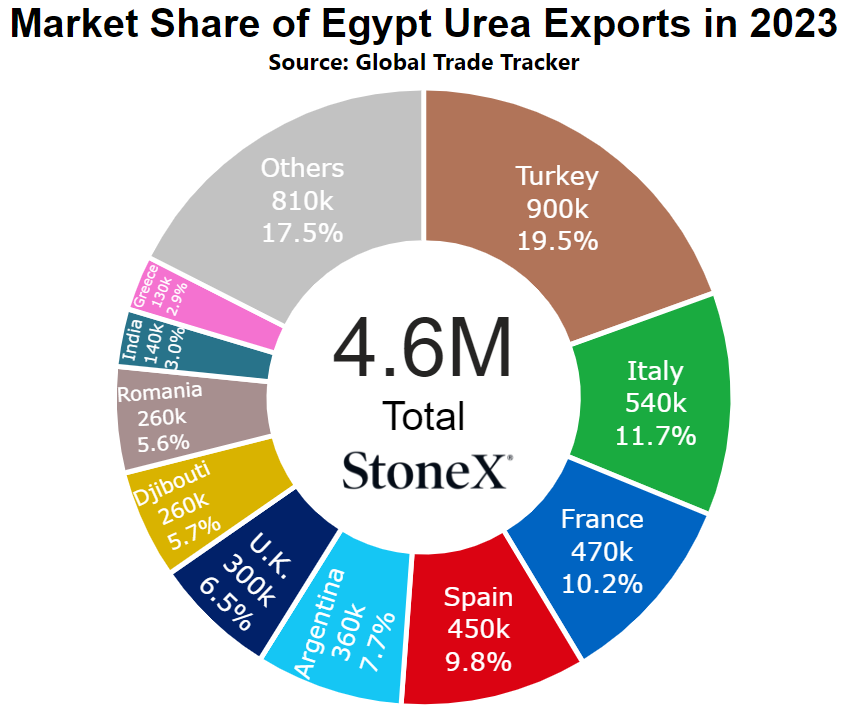
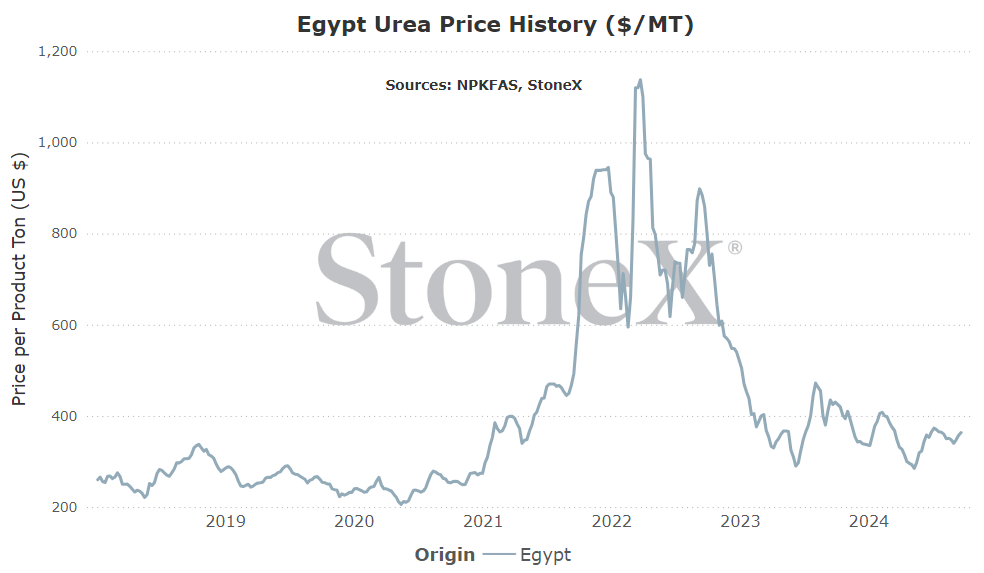
Egypt
Number 4 global exporter in 2022
Price comparisons
Vs 30 days ago - 5% or approximately $16 higher
Vs 90 days ago - 3% or approximately $11 higher
Vs 6 months ago - 10% or approximately $33 higher
Vs 1 year ago - -14% or approximately $62 lower
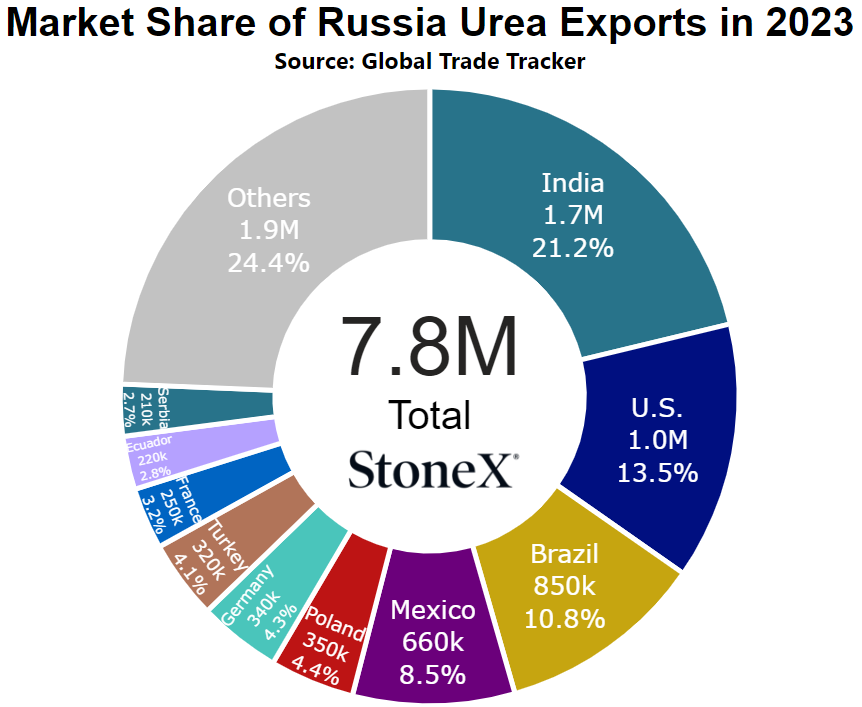
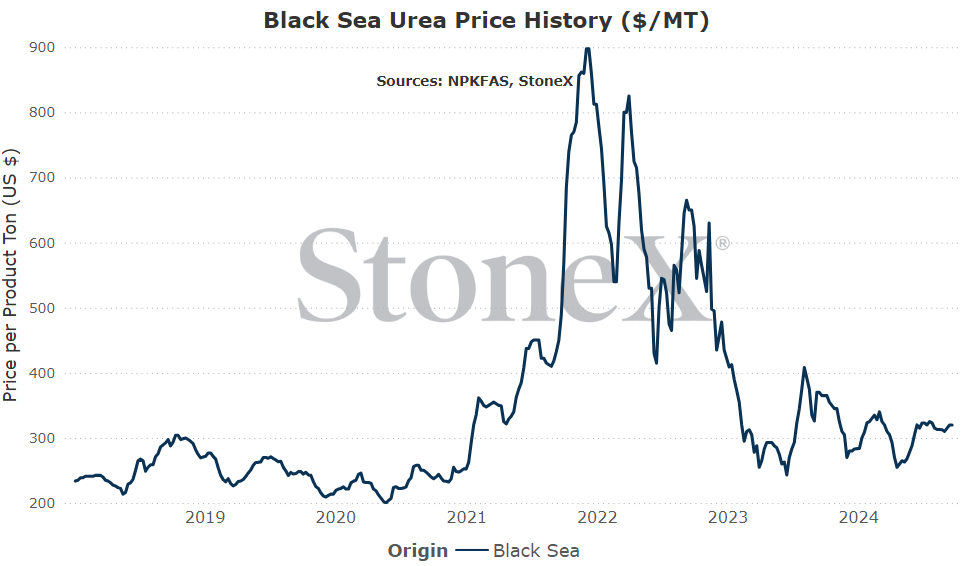
Black Sea
Number 1 global exporter in 2022
Price comparisons
Vs 30 days ago - 2% or approximately $8 higher
Vs 90 days ago - 2% or approximately $5 higher
Vs 6 months ago - 5% or approximately $15 higher
Vs 1 year ago - -12% or approximately $45 lower
China
Number 9 global exporter in 2022
Price comparisons
Vs 30 days ago - -8% or approximately $26 lower
Vs 90 days ago - -16% or approximately $53 lower
Vs 6 months ago - -16% or approximately $52 lower
Vs 1 year ago - -29% or approximately $114 lower
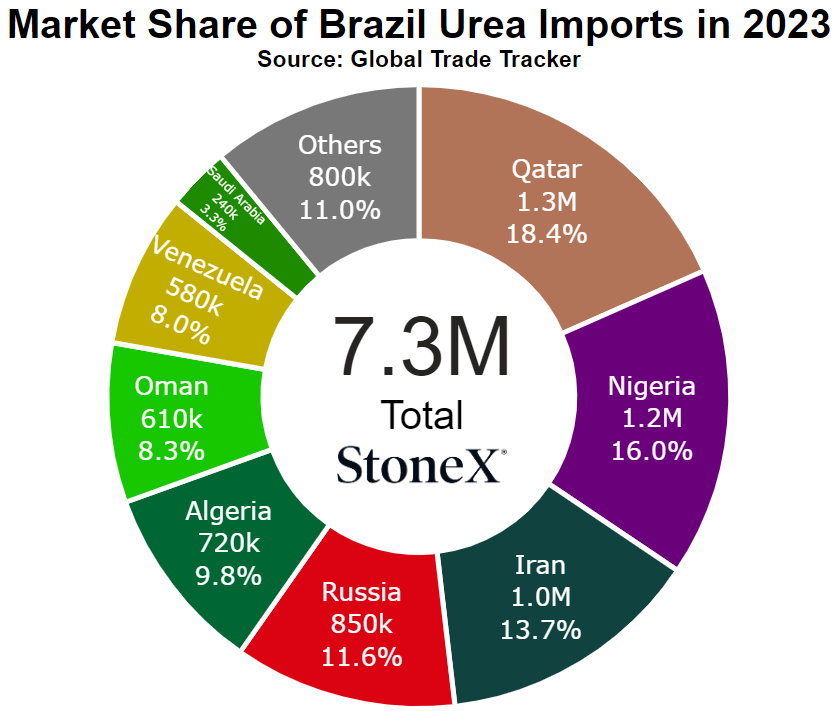
Brazil
Number 2 global importer in 2022
Price comparisons
Vs 30 days ago - 1% or approximately $5 higher
Vs 90 days ago - -2% or approximately $6 lower
Vs 6 months ago - 4% or approximately $14 higher
Vs 1 year ago - -14% or approximately $56 lower
- Chinese exports continue to disappoint - Chinese exports are just not happening. August was a pathetic 25K tons. For reference, they are believed to be making around 200K per day. There is the chance that they start exporting heavily in Q4, but the more likely situation and expected case is that 2024 closes with none of their participation. This leaves a massive hole in the global export market.
- Grain continues to rally and brings buyers back - there is nothing about current grain values that are great...but they have been improving. December 2025 corn has rallied back to $4.50. Maybe Brazilian production continues to suffer. Maybe the N.A. crop isn't as big as believed. Maybe demand returns. If we see a situation where grain markets start to rally, demand will start coming forward and will likely take urea prices higher with it.
- Current India tender mops up excess inventories for remainder of 2024 - this current India purchase tender has the ability to mop up most of the "excess" product left around the world for 2024. Imagine that does happen. Manufacturers are not pressed to sell for the rest of the calendar year and still anticipate normal demand coming. In that scenario, they have buyers backed into a corner and they like higher prices.
- China shocks the market and returns with big exports - one of the big talking points surrounding China is the reporting that their production rates are near record levels. This, if believed, means that China is producing nearly 200K tons per day...and exports are non-existent. In that case, where are they putting it all? Could be that we see production rates scale back significantly once domestic storage is full...or we could see China export in a massive way once full. If we saw that happen (China exporting massively), it would be hard to imagine global prices higher.
- Demand delays until 2025 due to poor economics - farmers are still not in a great place. Sure, grain prices have jumped from their bottoms, but that doesn't mean they are high priced. With a lot of demand not until the spring (Northern Hemisphere), there is still time to hold off on purchases in hopes of better opportunities. If enough of the market takes this approach, inventories can/will grow fast and manufacturers can be pressured.
- India cuts down large on their current tender - just because India announced a fresh purchase tender much quicker than anyone expected, it doesn't mean they will buy tons. If they see offered values as too high, they could scrap the tender completely and leave the urea market reeling. Not likely, but it has happened before. Even more likely if they suddenly see a path forward where China returns...
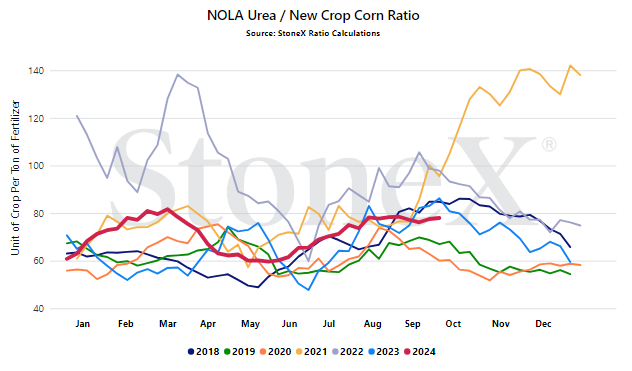
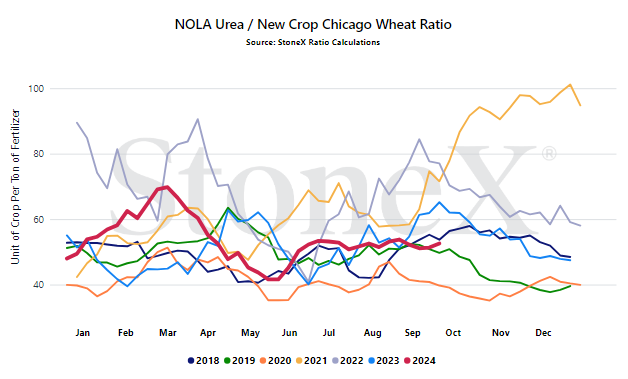
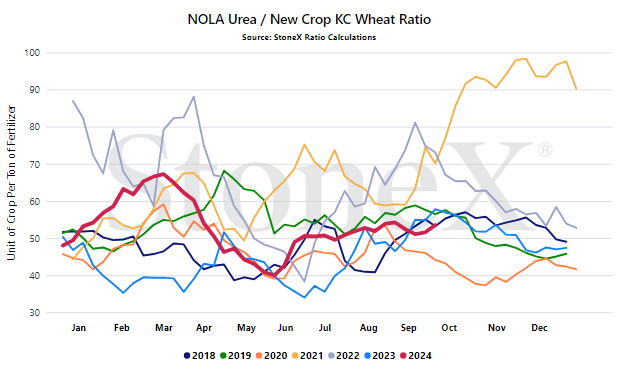
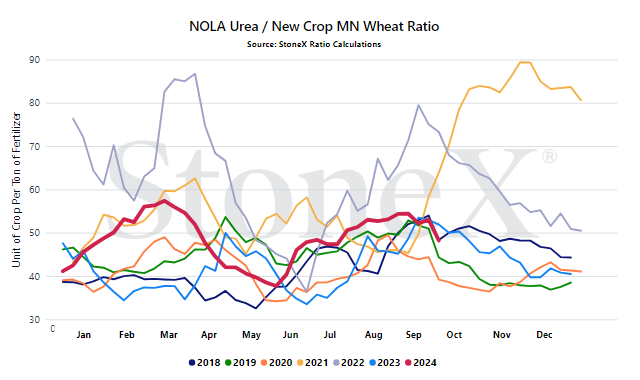
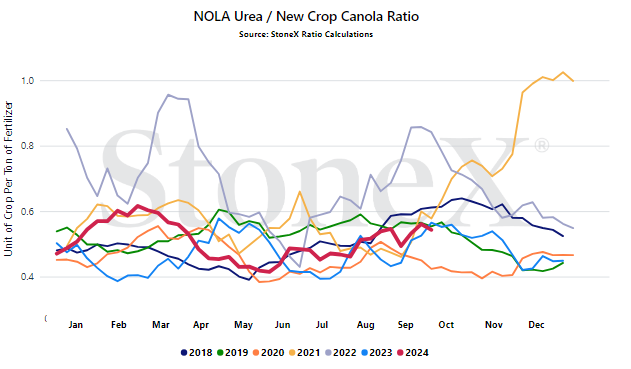
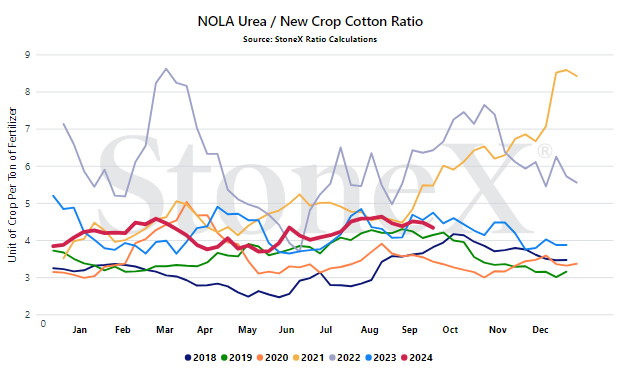
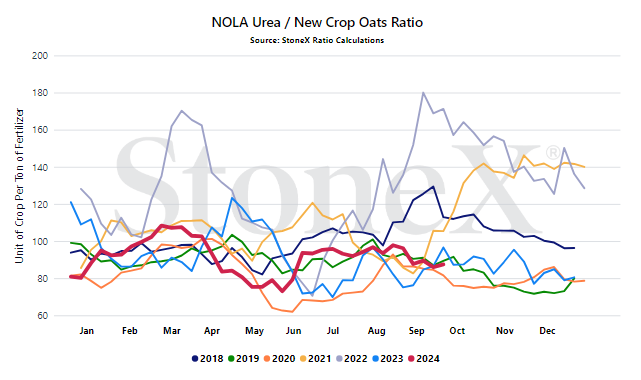
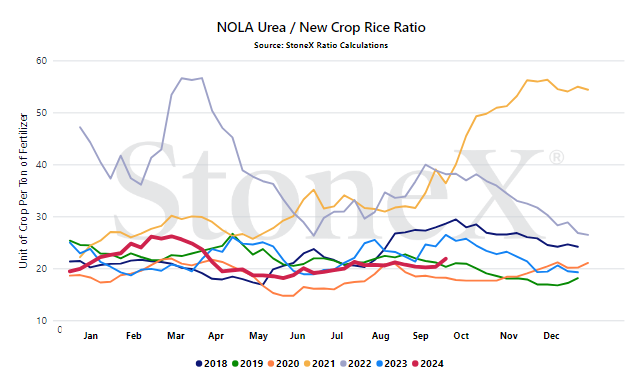
We believe that only looking at the flat price of either grains or fertilizer can be misleading:
- Only selling grain can hurt you if fertilizer prices rise substantially
- Only buying fertilizer can hurt you if grain prices fall
We look at the ratio "value" to get a better indication of where we are or how many bushels of X does it take to pay for 1 ton of fertilizer.
Would you rather:
- Spend 135 bushels to pay for 1 ton of urea
- Spend 55 bushels to pay for 1 ton of urea
When we compare the current ratio value against recent years, we start to see if we are high or low.
YOUR VALUES WILL LOOK DIFFERENT
This graph looks at the NOLA urea price vs the flat grain price. There are no logistics on either product. Your location will look different due to fertilizer logistical costs, grain basis, etc.
- Chinese export flows - this is easily my top focal point this month. We now have "official" export data on China thru August and it shows a glaring hole in urea supplies. Normally exporting north of 5M/year, January thru August shows less than 250,000 tons...and the Q4 outlook is not much better. If this trend continues, I am afraid it is going to come to a head and world buyers are going to pay the price (pun not intended). However, if China suddenly starts exporting heavily, the opposite can and probably will hold true. China wields that power...for now.
- India purchase tender success/failure - in their recently concluded purchase tender, India locked up nearly 1.2M tons of urea from the world. That helped to mop up a lot of excess/unsold product. Shockingly, they stepped in not 2 weeks after the conclusion of the first purchase tender with another tender that can ship thru most of November. My fear is that this tender is going to reveal that there are not a lot of extra tons in the world and values go higher as a result. If that happens, other global price points are very likely to follow suite.
- Overall global supply tightness - China looks like it is going to close out 2024 4+M tons short of normal export flows. The EU region, with operating rates still around 75% of normal, will likely fall 3+M tons short of normal production. Brazil is still struggling with high natural gas values and shouldn't produce anything. Egypt continues to have production issues. All of these combined are creating a massive hole in global supplies. When supplies tighten and demand remains unchanged (or possibly higher based on some of our current 2025 forecasts), that is a recipe for higher pricing.
- Demand "timing" - the longer term view that we hold today is that values will go higher on the back of solid N demand and struggling supplies. However, that does not mean short term markets cannot suffer a bit if buyers stay away. While it is looking more likely that manufacturers around the world will be well sold thru the remainder of 2024, that isn't a guarantee. If buying shuts down again and unsold inventories grow, it can put some short term weakness in the market. Eventually, the market fundamentals win out but timing can sway the market before that ultimate move.
StoneX Ratio Calculation
The ratio calculation is derived from Bloomberg historical grains values as well as fertilizer values from StoneX, NPKFAS, and Argus.
The calculation is simply dividing the fertilizer price by each grain price.
All data was sourced from StoneX unless otherwise noted.




