August 21 - The Department of Labor downwardly revised its job creation estimates by 818,000 for the year ending March 31. This is the first of two big annual revisions that the DOL makes, suggesting that the job picture is not as good as thought, but that had little impact on stocks today, as it was widely expected. The VIX is trading near 17 at midday, while the dollar index is trading at new lows for the year near 101.2. Yields on 10-year Treasuries are trading near 3.78%, while yields on 2-year Treasuries are trading near 3.93%. Crude oil prices are 1% lower, while the grain and oilseed markets are mixed - trading a sideways range.
U.S. commercial crude oil stocks (excluding the Strategic Petroleum Reserve) fell by 4.6 million to 426 million barrels in the week ending August 16, putting them 5% below the five-year average for mid-August. Gasoline stocks dropped by 1.6 million barrels last week, leaving them roughly 3% below seasonal levels. Distillate stocks declined by 3.3 million barrels, putting them 10% below levels typically seen in mid-August. Ethanol stocks rose to 23.6 million barrels in the week ending August 16, up from 23.4 million the previous week, and up from 22.8 million barrels in the same week last year. Ethanol production rose to 1,098K barrels per day during the week, up from 1,072K bpd the previous week, and up from 1,048K bpd in the same week last year. The production of ethanol utilized an estimated 108.2 million bushels of corn last week, up from 105.7 million the previous week, and up from 101.4 million bushels in the same week last year. That means that estimated marketing year to date corn use for ethanol totals 5.230 billion bushels with 15 days left in the marketing year, up 233 million bushels or 4.7% from the previous year's pace, and on pace to reach USDA's target when the year ends on August 31.
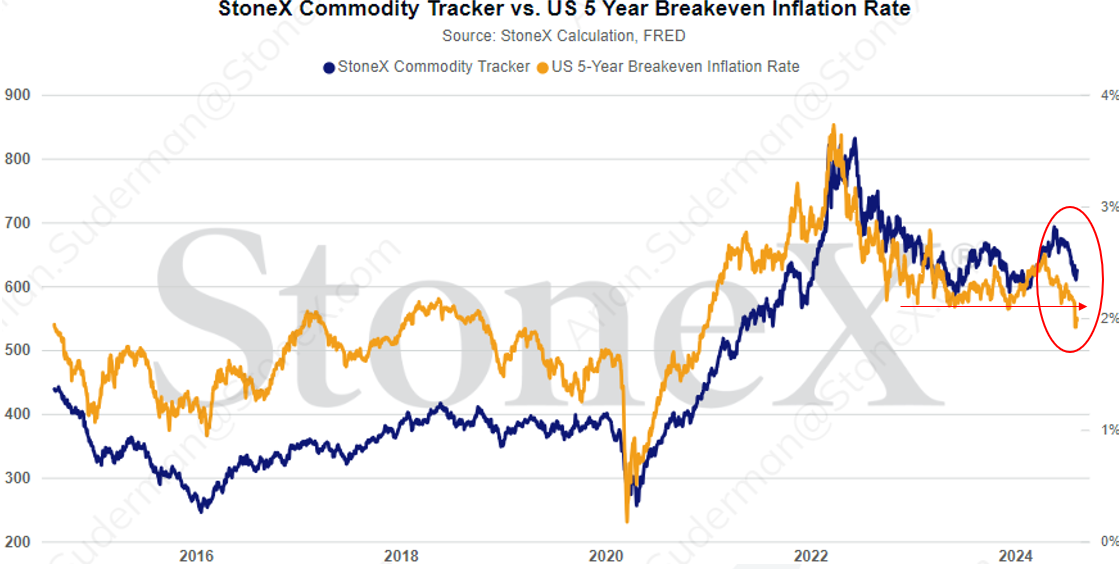
P = f ( S * D ) M or Price is a function of Supply & Demand as Modified by the flow of money. I've started virtually every presentation over the past 25 years with that statement, and it has never been more true than it is this year. The flow of money alters the level at which the market manages supply and demand, which can move the price of corn received by the average U.S. farmer 50 cents or more per bushel above or below levels that one would expect based on just supply and demand factors. The graphic below shows a 10-year history of our StoneX Commodity Tracker, which tracks the value of a basket of 27 commodities. It also shows the 10-year history of the 5 Year Breakeven Inflation Rate, which reflects the markets current expectations for inflation over the next five years. The 10-year correlation between the two is 0.87, which is quite strong. A correlation above 0.70 is considered significant. Note the two month +/- lag from inflation trend expectations to commodity value changes. Managed money tends to want to be long commodities when inflation expectations are trending higher, with a couple of month lag, and short when inflation expectations are trending lower. There's a similar 0.87 correlation over the past 10 years between the commodity tracker and the U.S. consumer price index, with commodity prices being the leading indicator there. Note in recent weeks how inflation expectations broke below chart support amid the stock market rout of three weeks ago, and the corresponding weakness in the value of the commodity sector. There's more than commodity prices that go into the inflation equation, but this would suggest that we will continue to see inflation trend lower in the near-term as well. The question is, when will those inflation expectations trend higher again. My current thinking is that it will happen in 2025, but there are several factors that could change that.