June 27 - The pending home sales index dropped 2.1% month-on-month for May, after dropping 7.7% in April. So the monthly decline has slowed, but it still fell short of analyst expectations that it would rebound to show 1.9% month-on-month gains. The index stands at 70.8 for May, down from 72.3 in April. The data shows that home inventories are rising, while demand is soft due to elevated interest rates and soft consumer demand due to concerns about the future of the economy. However, the National Association of Realtors also acknowledges that the higher inventory of homes would likely support active sales expansion if/when interest rates do fall, creating demand again for homes. The NAR forecasts that the median home price will hit a record high $405.300 this year, up from $389,800 last year, despite this year's soft sales.
Stocks continue to chop around in a consolidating pattern ahead of tomorrow's inflation data, with the VIX trading below 13 and the dollar index trading near 105.8. Yields on 10-year Treasuries are trading near 4.29%, while yields on 2-year Treasuries are trading near 4.71%. Crude oil prices are 1% higher late morning, while the grain and oilseed markets are mixed to higher ahead of tomorrow's big USDA reports as traders position for tomorrow's delivery period and for the end of the month, end of the quarter, and the USDA reports.
Exporters sold 21.3 million old-crop and 5.5 million bushels of new-crop corn in the week ending June 20, in addition to 10.4 million bushels of old-crop and 3.7 million bushels of new-crop soybeans, and 24.5 million bushels of wheat. Mexico was the featured buyer of corn during the week at a net 17.9 million bushels of old-crop and 4.4 million bushels of new-crop, accounting for the bulk of the week's sales. China was the featured buyer of soybeans during the week at a net 2.9 million bushels. Marketing year to date corn export sales to all destinations total 2.101 billion bushels, exceeding the previous year's pace by 574 million bushels or 38%, largely due to active sales to Mexico that are up 47% year-on-year. Year-to-date corn export sales to all destinations currently exceed the seasonal pace needed to hit USDA's target by 63 million bushels, up from 59 million the previous week. On the other hand, marketing year to date soybean export sales to all destinations total just 1.637 billion bushels, down 286 million bushels or 15% from the previous year's pace, largely due to a 22% decline year-on-year in export sales to China.
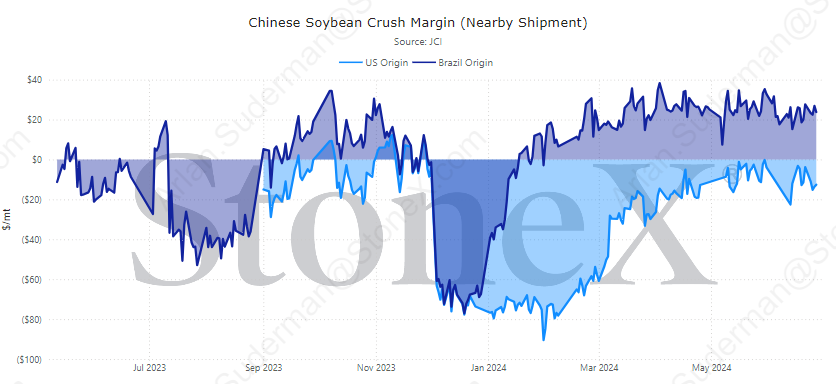
Year-to-date soybean export sales to all destinations fall short of the seasonal pace needed to hit USDA's target by 49 million bushels, versus a shortfall of 47 million bushels the previous week. Of even greater concern, new-crop soybean export sales to all destinations to date are slower than any of the previous five years at just 45 million bushels, down from 123 million bushels at this point last year, and down from 491 million bushels at this point two years ago. That's largely due to the continued availability of cheaper Brazilian soybean supplies on the world market - for both old- and new-crop. The graphic below provides a comparison of crush margins in China for both Brazilian and U.S. soybeans. It clearly shows that Brazilian soybeans have a competitive advantage in crush margins imported into China. Much of that advantage is due to currency exchange rates, but basis levels due to ample supplies in Brazil are another factor giving them a competitive advantage. Thus far, Brazil's cash market is not providing any evidence that flood losses in Rio Grande do Sul are great enough to change that dynamic. Perhaps a shift to La Nina will flip the tables in the coming growing season, but thus far Brazil new-crop soybeans continue to be sold into China at roughly a $30 per metric ton advantage over U.S. soybeans.