- U.S Price indicators tended to enhance the scope for the Fed to slow rate hikes
- But this week-end’s announcement from OPEC+ of a planned production cut has generated any number of views on any number of issues
- Rising yields and rekindled inflation fears briefly pressured gold
- But energy commodities as a whole are only 7% of US CPI; economic uncertainty is the more important element here
- And in principle it can also be argued that economic uncertainty will be gold-friendly.
- Gold Managed Money COMEX outright long positions now amount to a sizeable overhang and the market is vulnerable to liquidation
- Gold Eagle expenditure (contained metal) on U.S. Mint sales figures; four times the monthly average over 2018-2022.
Key points:
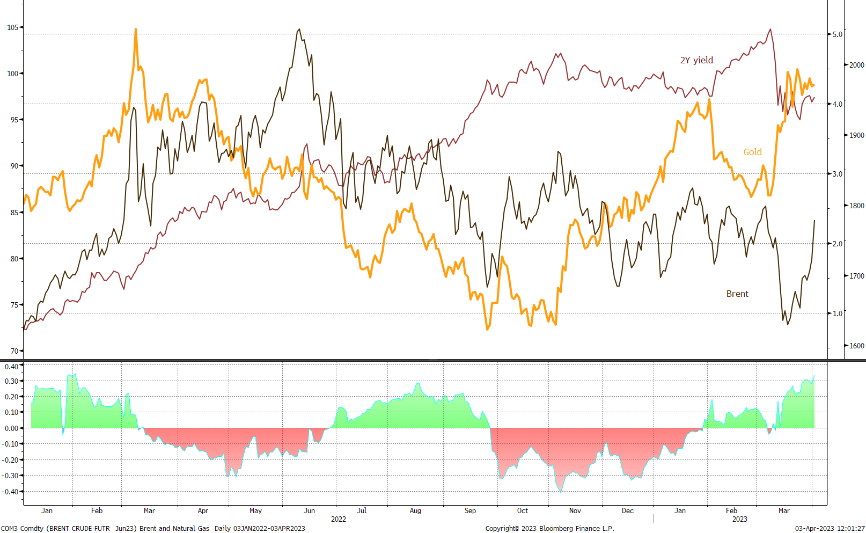
Spot gold, Brent and the 2-year yield, January 2022 to date
Source: Bloomberg, StoneX
Gold over two days; net no change, but lively action in between
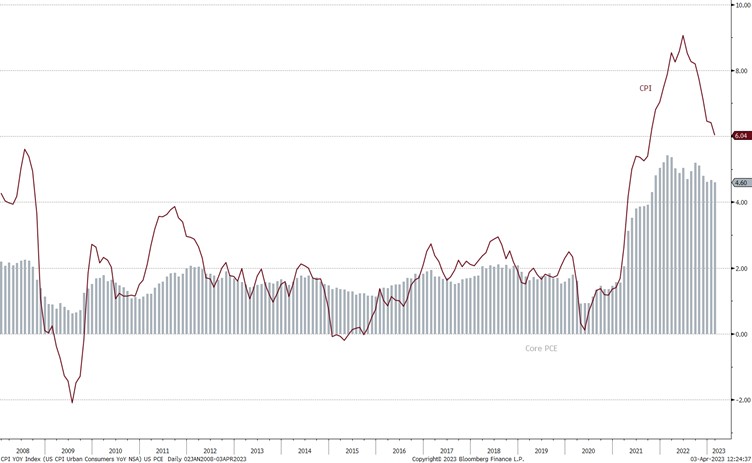
Gold rallied at the end of March as the United States’ Core Personal Consumption Expenditure (PCE) came in lower than the markets were expecting. Although on a year-on-year basis-this indicator was 4.6%, well above the Fed’s target of 2%, it is a lagging indicator and the trend is arguably therefore more important than the outright number. So at the end of last week and into the Asian hours of today Monday 3rd April, gold ran from $1,950 to $1,897, where it stalled. Then came the OPEC+ announcement, of a planned cut of 1.15M barrels per day (bbd) of crude oil production, which sent a shudder through the markets, boosted oil along with bond yields and the dollar, and saw gold relinquish the gains of the previous day’s trading.
Over the two days gold is more or less unchanged not just in dollars but also in euro and yen, but has weakened in Swiss franc terms.
My colleague Harry Altham, one of our energy analysts, says that this crude production cut, if combined with the 2.1M bbd of cuts announced last autumn and Russia’s voluntary 0.5M bbd, would equate to a net 3.7% of global demand.
But as we note in the bullet points in the at the top of this piece, energy commodities as a whole account for just 7% of the US CPI weighting, so this announcement in and of itself is not really a short-term market mover from the American perspective. It is more significant in Europe, where energy costs are so much higher and where, of course, there is contagion from the Ukraine conflict. We would argue that globally the potential impact on economic activity and confidence is more important.
US Core PCE and CPI
Source: Bloomberg, StoneX
If we look at a longer-term basis, gold has still been essentially range-trading for the past fortnight, and is finding support from the congestion on the charts dating back to January. It is worth noting, though, that it looks as if it is generating a triangle formation; more often than not, when one or other of the trend lines bounding this formation is broken as we approach the apex (currently targeted at $1,992 in early April), the price will move by an amount equivalent to the width of the base of the triangle – in this case, $74.
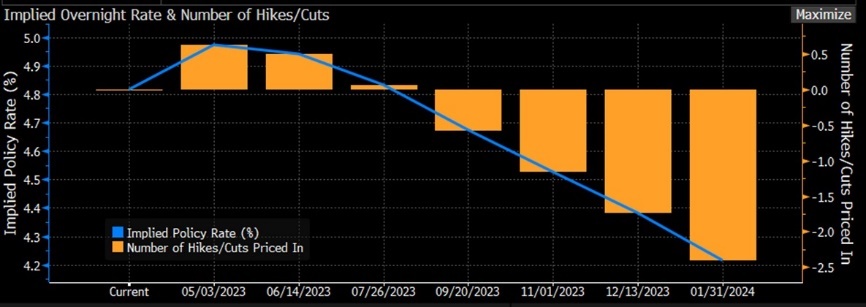
To round off the market reaction to the OPEC+ statement, this is what the fed funds markets are projecting;
It looks like possibly three hikes in principle, but if we look at the actual levels that the markets are discounting, the May target is 4.97%. This is only 14 basis points higher than where the fed funds target is now, which means that the markets are evenly divided as to whether there will be a 25-point hike or not. The peak level is currently targeted at 4.94% in June. So not actually that much change from last week, which is as should be expected given that the central banks still have to wrestle with the possibility of de-railing economic recovery – and all the more so now if energy prices are to affect activity.
Background developments
- Exchange Traded funds: - since the SVB collapse
After the addition of 35 tonnes of gold into the major funds (just 1.2% of total) for a net dollar inflow of $2.27Bn in the ten days following the SVB collapse and including the Credit Suisse implosion, the past week has seen a further nine tonnes of net inflows, to a total of 3,441t (world mine production is ~4,000t).
Silver has seen a net addition of 227t over the past week for a net fall of 277t since the SVB collapse and is now within four tonnes of the holdings at the start of the year; currently at 23,292t (world mine production is ~26,000t.
- CFTC gold numbers in the weeks to 28th March (Tuesday to Tuesday);
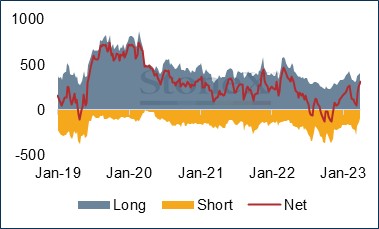
Gold; continued fresh longs and short-covering, with longs adding 17t to 406t (highest since end-January, at 430t) and shorts contracting to by 39t to 98t, the smallest since late June 2020. The net of 308t compares with a twelve-month average of 111t and the outright long compares with a 12-month average of 332.t. This in our view makes the market vulnerable to long liquidation on any faltering and indeed we may see more this week.
Gold: managed money positions on COMEX (t)
Source: CFTC, StoneX
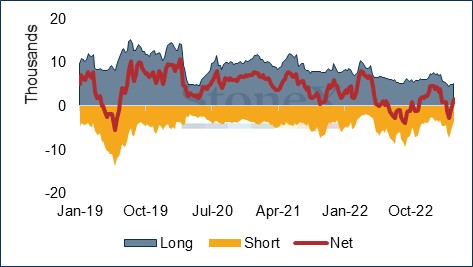
Silver CFTC positions saw fresh longs of 1,653t to 5,132t; shorts contracted again, by a sizeable 1,482t to 3,480t. This takes the net position to a long of 1,653t after four weeks of net shorts.
Silver: managed money positions on COMEX (t)
Source: CFTC, StoneX
- Bullion Coin sales for the full month
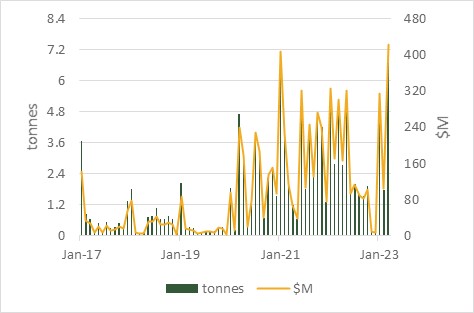
Also note the surge in purchases of U.S. Gold Eagle coins during March, which we think is likely to be directly attributable to the banking issues. For the full month Gold Eagles sales amounted to 6.7t for an approximate investment (contained gold, excluding premia) of $423M, which is higher than the January level (this is significant because January is always a high tonnage month as coins are distributed through the system); it also compares very favourably with the monthly average expenditure over 2018 to 2022 inclusive of $100M.
Silver coin expenditure on the same basis was much more modest at $22M, with gold coins taking 20 times as much investment as the silver coins did.
Approximate expenditure on gold and silver coins from the U.S. Mint, $M
Source: U.S. Mint, StoneX
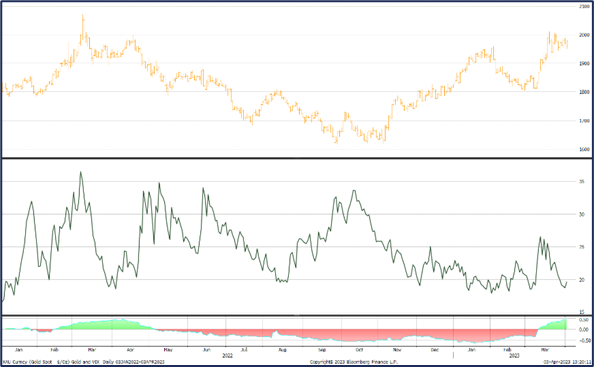
Gold and the VIX Uncertainty index; note how the correlation has become [positive in the face of banking uncertainties
Source: Bloomberg, StoneX