Rhona O'Connell, Head of Market Analysis, EMEA & Asia
Tel: +44 203 580 6115 / mobile +44 7384 833897
24th August 2026
Treasury announcement will not greatly affect bonds, but cheers dollar bears on the return of debasement
Last week’s Outlook: “likely to maintain the recent marginal rise in prices but absent an exogenous shock, unlikely to rise much further near term” Well we got that exogenous shock, last Wednesday. After a period of weeks in which the $4,000 level developed as support, and with geopolitical tensions persisting, sentiment had already been turning in gold’s favour before the Treasury’s Statement last week. The mechanics of the Treasury’s intervention at the long end of the bond markets (which is currently scheduled for a programme of just eight weeks) is a lot less significant than the fact that the markets are viewing this as a reduction in US financial credibility. Bond yields are continuing to rise at the long end, and the Treasury is likely to lose this particular battle. With the cost of financing the deficit continuing to rise there is little fiscal headroom for manoeuvre and as a result of all this the dollar is on the defensive. These different elements combine in favour of gold, for the variety of reasons given above. Technically, though, rising yields are a headwind for gold and it is likely that while we have seen a change of range, gold’s momentum will be impaired by bond activity.
The outlook will continue to depend on geopolitics and financial management. Continued official sector purchases will be supportive, but without a black swan it is hard to see gold regaining the highs of end January, which was ultimately a momentum trade, in the near term. It is possible to see it later next year if the developing rally is steady rather than fraught.
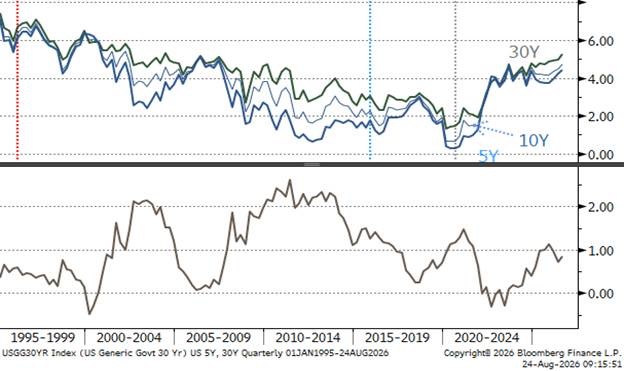
Key long bond yields, long-term and the 5Y-30Y spread; taken literally, 30Y bonds are not underwater, but the 5’s and 10’s are
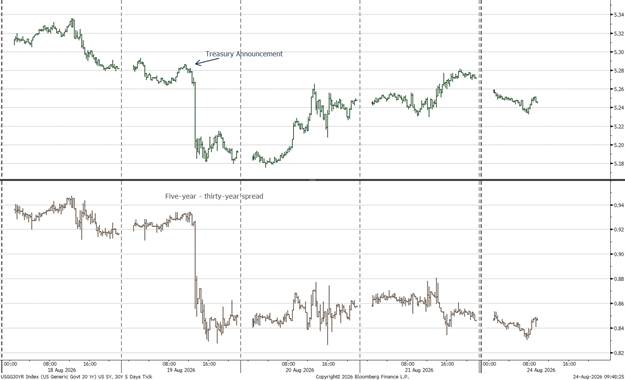
US 30Y yield, short term
Source: Bloomberg, StoneX
In a note that we published last Friday 21st August (here) we included the following comments:
“The fact that [the doubling of the buyback] programme will, as for now at least, only run for eight weeks (and we don't yet know how many operations there will be) is one of the reasons why the bonds have marched on after their initial fall (in the 14 hours following the Statement was 21 points before equilibrium was restored). Gold’s response is a function of the additional uncertainty that this feeds into the sector because independent bond market experts are pointing to the size of the US debt and suggesting that this action is akin to applying a plaster to an open wound.
US debt exceeded $40Tn for the first time on 18th August (which begs the question whether that level was a trigger for expanding the programme). Buybacks, as clearly shown in the [Treasury] Statement, are a liquidity provider. Debt held by the public (including hedge funds, mutual funds and households) is up $2.45Tn Y/Y, a gain of 8.2%, and these holders are price sensitive. And because the average coupon on many outstanding stocks is below current yields, rolls on maturity will be set at a higher rate, so the cost of funding rises even if the deficit stays stable. This leaves the Treasury in something of a bind as debt management becomes yet more difficult and this has not been lost on the gold market”.
We are continuing to keep an eye on the private credit sector, which is catching increasing interest from the press. The FT has this week has noted that after the global financial crisis, authorities clamped down on “duration mismatch” (banks borrowing short term and lending long. This, incidentally, is effectively what the US Treasury is doing in its expanded buyback programmes that will be underway from 9th September). The FT points out that some of that activity shifted into the private banking sector and the way that this has evolved has brought some life assurance companies onto the scene and suggests that the continued geopolitical issues and persistent inflation mean that a rise in credit defaults may result.
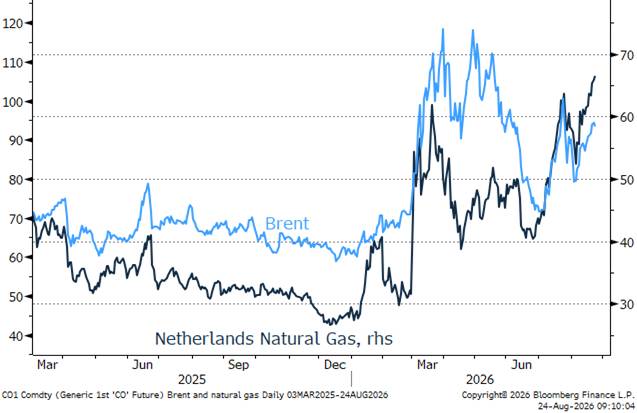
Energy picks up again as President Trump’s latest comments threaten further escalation in the Gulf
Source: Bloomberg, StoneX
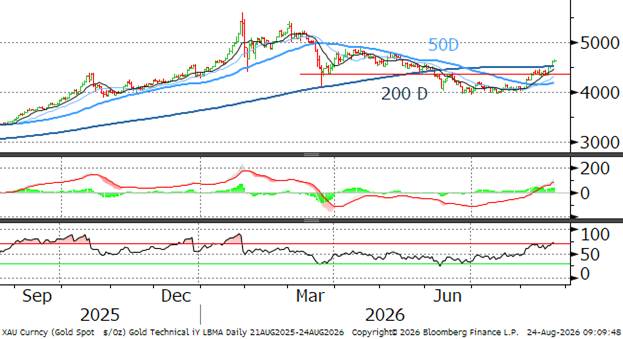
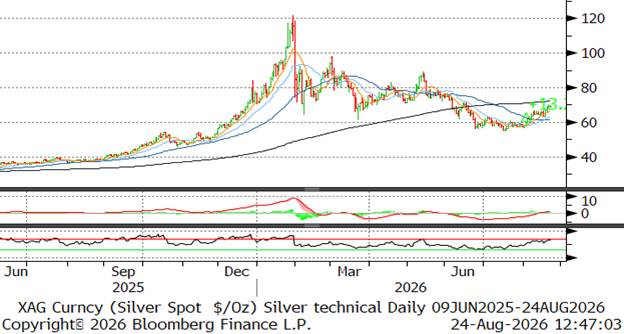
On the technical side gold is now above all four key moving averages. Silver is approaching the 200-day ($72) and finding support from the 10-day at $63.7.
Gold has crossed the 200D to the upside (the latter stands at $4,514)
Silver’s moving averages are supportive; 200D lies ahead
Source; Bloomberg, StoneX
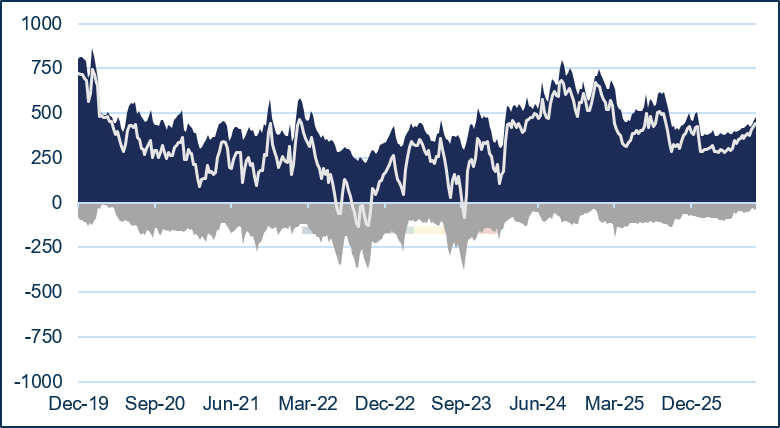
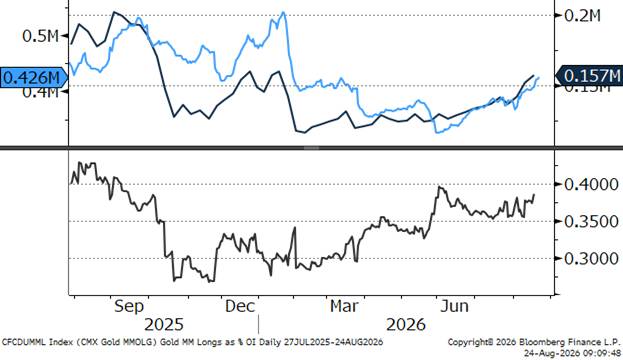
The latest CFTC gold figures, for the week to 18th August in a new a period of consolidation on either side of $4,350 (and before the Treasury Statement) , saw a 19t (4%) gain in outright Managed Money longs and a six tonne (18%) increase in shorts. Silver, meanwhile, saw reductions on both sides with longs shedding 68t (2%) and shorts down by 149t (11%), taking the net long up to 1,921t.
Within the ETFs there has been continued buying interest but in keeping with consolidation in price action, the activity was slower than in the previous week. The latest numbers from the World Gold Council run as far as the 14th August; in the preceding week 24t were added, taking the total to 4,114t. In percentage terms Europe was the most active, adding 1% or 15t; North America seven tonnes (0.4%) and Asia, one tonne (0.2t). Subsequent Bloomberg figures (not as comprehensive as WGC) report steady buying last week although there was a touch of profit taking on Wednesday; on the day after the Treasury announcement some 18t (net) were bought for a gain over the period of 29t, implying a year-to-date net creation of 119t. Silver ETFs (Bloomberg numbers) were mixed over the week for a net redemption of 11t – although the on the 19th the net inflow was 93t; closing figures last week were 24,812t, a net loss ytd of 2,009t.
Gold COMEX positioning, Money Managers (t)
 Source: CFTC/Blomberg
COMEX Managed Money Gold Longs as % of 1st continuation Open Interest
Source: Bloomberg, StoneX
COMEX Managed Money Silver Positioning (t)
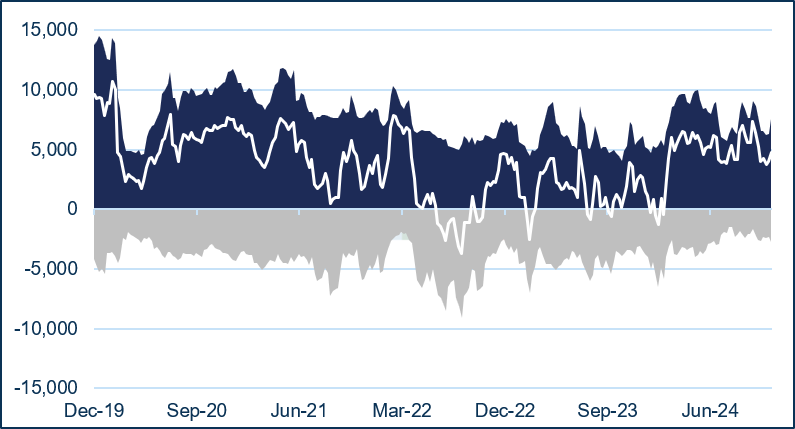 Source: CFTC/Bloomberg, StoneX
COMEX Managed Money Silver Longs as % of 1st continuation Open Interest
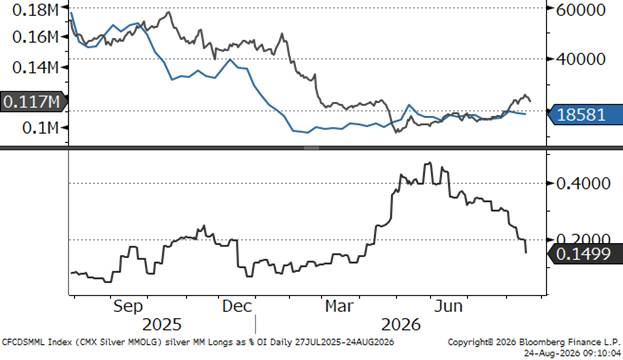
Source: Bloomberg, StoneX
The S&P, gold and copper; S&P/gold correlation declining still further, to 0.12 while S&P:Cu correlation is again tighter at 0.53
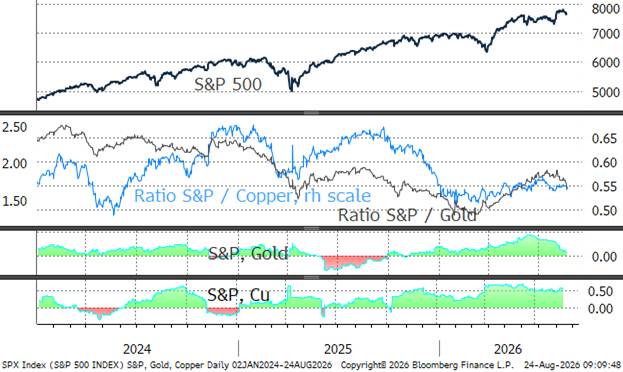
Gold, silver and copper correlations; silver-gold 0.83 (higher); silver-copper, 0.58 (easier)
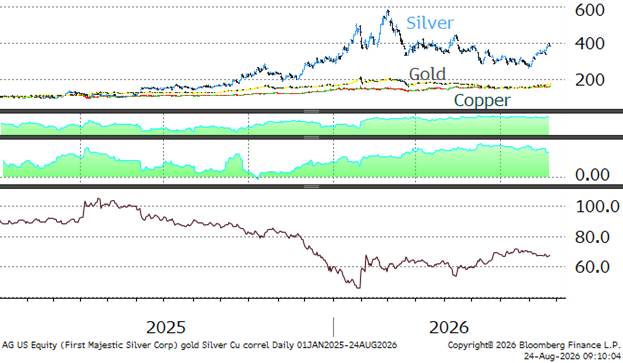
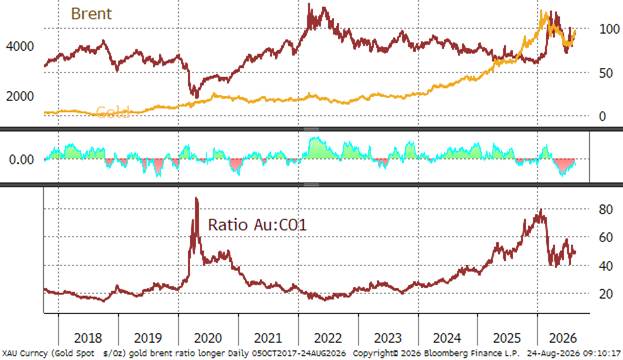
Gold:Brent ratio
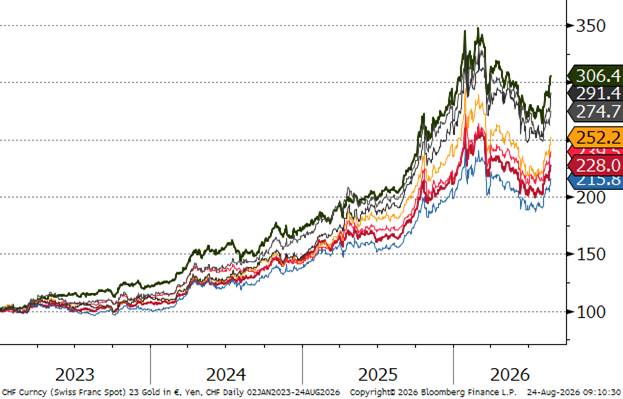
Gold in key local currencies. Year-to-date, up 14% in Rupee terms, up 7% in US$
Source for above charts; Bloomberg, StoneX
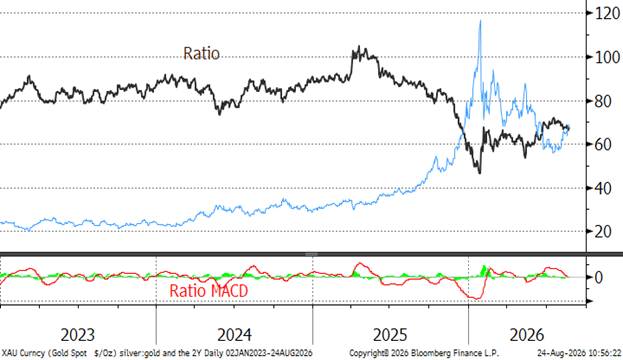
Gold:silver ratio; contracting; this is normal when prices are rising given silver’s higher volatility
Source for above charts: Bloomberg, StoneX
| | 24 August 2026 | Previous week | % change | Year-to-date | Range Jan 2024 onwards | | Range as % |
| | | | | | Min | Max | |
| Gold (pm LBMA price) | 4,655.48 | 4,415.99 | 5.42% | 7.46% | 3,976.50 | 5,417.21 | 36.23% |
| Silver (LBMA price) | 58.66 | 62.05 | -5.47% | -23.41% | 57.42 | 116.70 | 103.25% |
| Platinum (pm LBMA price) | 1,629.94 | 1,632.90 | -0.18% | -28.41% | 1,552.52 | 2,054.12 | 32.31% |
| Palladium (pm LBMA price) | 1,271.77 | 1,271.28 | 0.04% | -25.94% | 1,171.57 | 2,054.12 | 75.33% |
| S&P 500 | 7,674.37 | 7,785.76 | -1.43% | 12.11% | 4,688.68 | 7,798.99 | 66.34% |
| $:€ | 1.1679 | 1.1570 | 0.94% | -0.34% | 1.0244 | 1.2041 | 17.54% |
Source: Bloomberg, StoneX
This material should be construed as market commentary and represents the opinions and viewpoints of the author, and does not reflect tailored advice associated with any specific account.
The views are current only through the date stated and are subject to change at any time based upon market or other conditions, and StoneX Group Inc. (“SGI”) disclaims any responsibility to update such views. Actual results, performance, or achievements may differ materially from those expressed or implied. Information is based on data gathered from what we believe are reliable sources. Past performance does not guarantee future results.
The StoneX Group Inc. group of companies provides financial services worldwide through its subsidiaries, including physical commodities, securities, exchange-traded and over-the-counter derivatives, risk management, global payments and foreign exchange products in accordance with applicable law in the jurisdictions where services are provided.
References to certain OTC products or swaps are made on behalf of StoneX Markets, LLC (SXM), a member of the National Futures Association (NFA) and provisionally registered with the U.S. Commodity Futures Trading Commission (CFTC) as a swap dealer. SXM’s products are designed only for individuals or firms who qualify under CFTC rules as an ‘Eligible Contract Participant’ and who have been accepted as customers of SXM.
StoneX Financial Inc. (SFI) is a member of FINRA/NFA/SIPC and registered with the MSRB. SFI is registered with the U.S. Securities and Exchange Commission (SEC) as a Broker-Dealer and with the CFTC as a Futures Commission Merchant and Commodity Trading Advisor. StoneX Financial (Canada) Inc. (SFCI) is registered in Canada and is a member of CIRO and CIPF. References to certain securities trading are made on behalf of the BD Division of SFI and are intended only for an audience of institutional clients as defined by FINRA Rule 4512(c). References to certain exchange-traded futures and options are made on behalf of the FCM Division of SFI. Wealth Management is offered through SA Stone Wealth Management Inc., member FINRA/SIPC, and SA Stone Investment Advisors Inc., an SEC-registered investment advisor, both wholly owned subsidiaries of SGI.
R.J. O’Brien & Associates, LLC (RJO) is registered with the CFTC as a Futures Commission Merchant and is a member of NFA.
StoneX Financial Ltd (SFL) is registered in England and Wales, company no. 5616586. SFL is authorized and regulated by the Financial Conduct Authority (FCA) (registration number FRN:446717) to provide services to professional and eligible customers including: arrangement, execution and, where required, clearing derivative transactions in exchange traded futures and options. SFL is also authorized to engage in the arrangement and execution of transactions in certain OTC products, certain securities trading, precious metals trading and payment services to eligible customers. SFL is authorized and regulated by the FCA under the Payment Services Regulations 2017 for the provision of payment services. SFL is a category 1 ring-dealing member of the London Metal Exchange. In addition SFL also engages in other physically delivered commodities business and other general business activities which are unregulated and not required to be authorized by the FCA.
This communication is issued in the European Economic Area by StoneX Financial Europe GmbH (SFEG). StoneX is the trade name used by STONEX GROUP INC. and all its associated entities and subsidiaries. StoneX Financial Europe GmbH (“SFEG”) is a securities trading firm registered in Germany under Company No. HRB 80844.
StoneX APAC Pte. Ltd. (“SAP”) (Co. Reg. No 200616676W) is regulated as a Dealer (PS20190001002) under the Precious Stones and Precious Metals (Prevention of Money Laundering and Terrorism Financing) Act 2019 for purposes of anti-money laundering and countering the financing of terrorism. SAP is an “Approved International Trading Company” authorized to act as a “Spot Commodity Broker” under the Commodity Trading Act.
StoneX Financial Pte Ltd (Co. Reg. No 201130598R) (“SFP”) is regulated by the Monetary Authority of Singapore and is a Capital Markets Service Licence holder (for dealing in capital market products), an Exempt Financial Adviser (for advising on investment products and issuing or promulgating analyses/ reports on investment products) and a Major Payment Institution (for domestic and cross-border money transfer services).
SFP may distribute analysis/report produced by its respective foreign affiliates within the StoneX Group of companies pursuant to an arrangement under Regulation 32C of the Financial Advisers Regulations Recipients should contact SFP at (65) 6309 1000 for any matters arising from, or in connection with, this webinar.
StoneX APAC Pte. Ltd. (“SAP”) (Co. Reg. No 200616676W) is regulated as a Dealer (PS20190001002) under the Precious Stones and Precious Metals (Prevention of Money Laundering and Terrorism Financing) Act 2019 for purposes of anti-money laundering and countering the financing of terrorism.
StoneX Financial (HK) Limited (CE No.: BCQ152) (“SHK”) is regulated by the Hong Kong Securities and Futures Commission for Dealing in Securities and Dealing in Futures Contracts.
StoneX Financial Pty Ltd (ACN 141 774 727) holds an Australian Financial Service License (AFSL: 345646) for Dealing in Securities, Exchange-Traded Derivatives Contracts, OTC Derivatives Contracts and Foreign Exchange Contracts, and is regulated by the Australian Securities and Investments Commission.
StoneX Securities Co., Ltd. (“SSJ”) (Co. Reg. No 010401047199) is regulated by the Japanese Financial Services Agency as a Type-I Financial Instruments Business Operator (Kanto Local Finance Bureau (FIBO)No.291’), is a member of the Financial Futures Association of Japan for dealing and broking FX and FX Option transactions, and is a member of the Japan Securities Dealers Association for dealing and broking stock indices and option transactions.
Trading swaps and over-the-counter derivatives, exchange-traded derivatives and options and securities involves substantial risk and is not suitable for all investors. Past performance of any futures or option is not indicative of future success. Indicators are not a trading system and are not published as a specific trade recommendation. The information herein is not a recommendation to trade nor investment research or an offer to buy or sell any derivative or security. It does not take into account your particular investment objectives, financial situation or needs and does not create a binding obligation on any of the StoneX group of companies to enter into any transaction with you. You are advised to perform an independent investigation of any transaction to determine whether any transaction is suitable for you. No part of this material may be copied, photocopied or duplicated in any form by any means or redistributed without the prior written consent of StoneX Group Inc.
The report/analysis herein is not directed to, or intended for distribution to or use by, any person or entity who is a citizen or resident of or located in any locality, state, country or other jurisdiction where such distribution, publication, availability or use would be contrary to law or regulation.
© 2026 StoneX Group Inc. All Rights Reserved.