Quarterly Commodities Outlook is available for free now.  Download your report  →

StoneX logo

Precious Metals talking points 031122: inflation in pictures; what should the target underlying level be now?

By: Rhona O'Connell, Head of Market Analysis

Inflation in pictures: what should the target underlying level be now?
 
Rhona O'Connell
Head of Market Analysis, EMEA & Asia; 
+44 203 580 6115; mobile +44 7384 833 297
rhona.oconnell@stonex.com
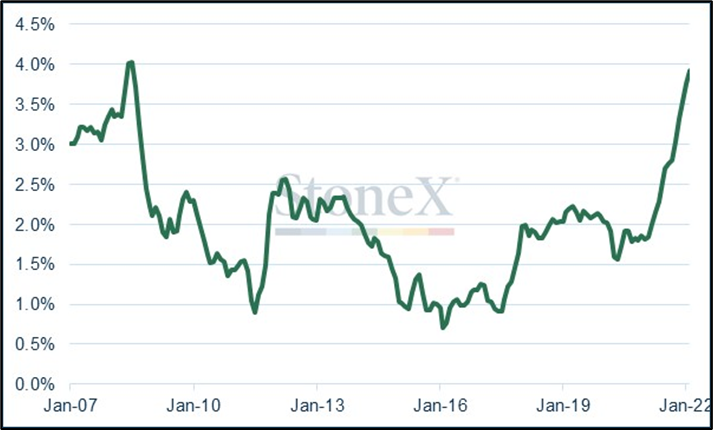
Rolling three-year annual average US CPI 
 image 31330
Source: Bloomberg, StoneX
The answer to this question needs to look at the interplay between underlying long-term economic forces and external shocks; clearly at present the two key latter elements are the pandemic and now the conflict between Russia and Ukraine, which is giving central banks additional headaches and makes next week’s Federal Open Market Committee (FOMC) meeting (15/16th March) especially interesting.  The widespread expectation, and indeed the flags coming from Fed Chair Jay Powell, suggest that there will still be a hike next week, but that this most recent conflict means that prudence is paramount so we should only expect 25 basis points.
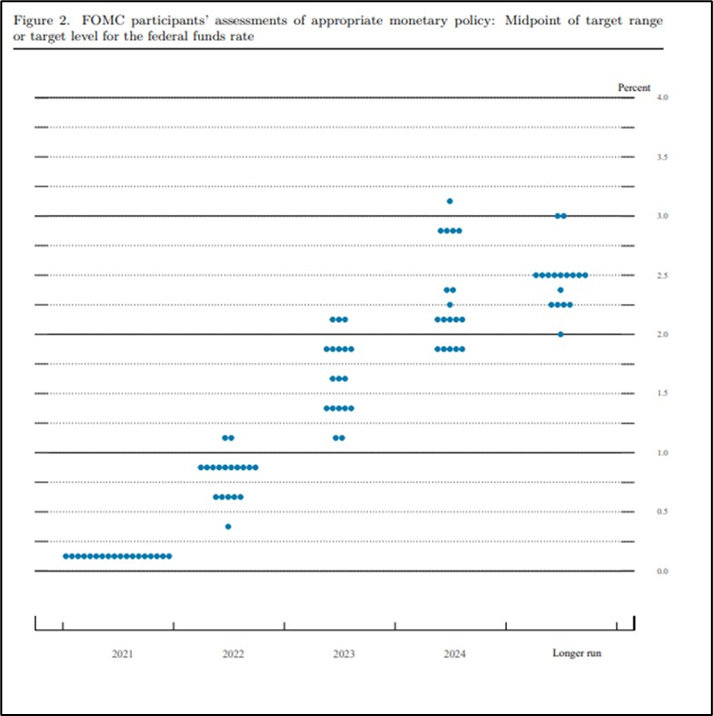
What will be absolutely key is the pattern of the dot plot.  The Fed’s “special economic projection” meetings are those in the third month of each quarter and while we won’t see the Minutes for another three weeks, the dot plot will be released with the Economic Projections and the Statement next Wednesday.
The most recent (December) dot plot is shown here: - 
 image 31331
Source: Federal Reserve
As we have noted before, we believe that the number of rate hikes is less important than the aggregate size of the hikes and this is what makes the dot plot a key tool for looking at the Fed’s thinking.
So to look at the background elements:
First, the headline numbers coming from, for example, the United States and the EU suggest strong inflationary forces.  These headline numbers, though (e.g. 7.9% CPI from the States in February vs. year-ago levels), are still a distortion of the longer-term issues because we still have some dislocations in the 2020/early 2021 numbers.  
So the next question is: – if we go back beyond the pandemic in order to strip out those shorter-term dislocations, does the overall average level come down to within the Fed’s target band of 2%?  The answer is No it Doesn’t, at least, not yet.  The annual average CPI increase between February 2019 and February 2022 is 3.9%; see Chart 1 above.
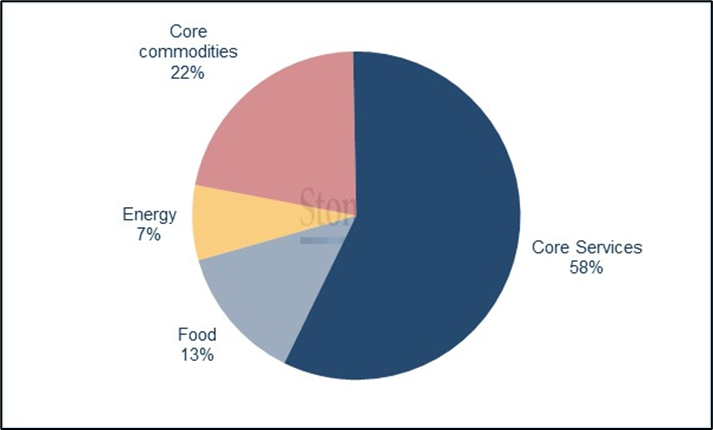
Currently the composition is as follows:
US CPI
image 31332
 
Source: Bloomberg, StoneX
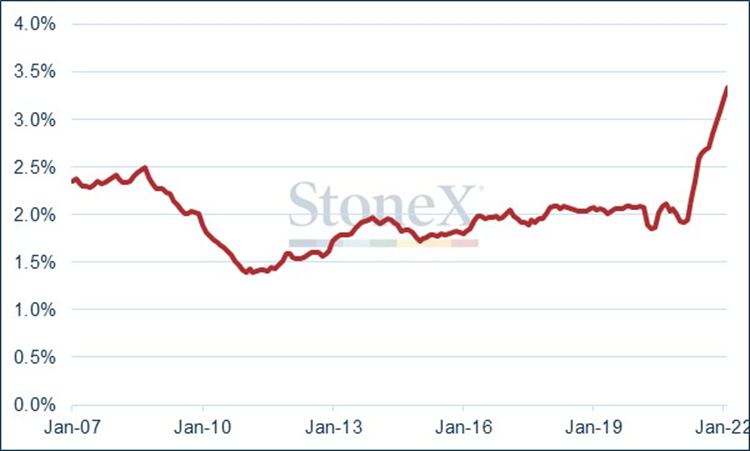
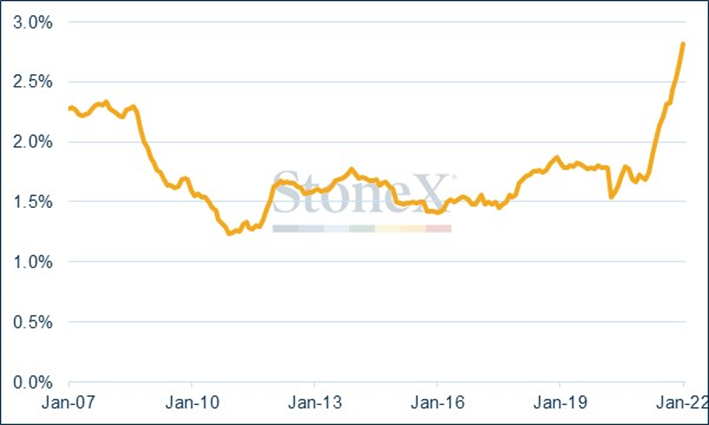
The Fed prefers to look at Core CPI, which strips out food and energy because of their volatility, although there is a variety of opinions among economists (isn’t there always!).  Core CPI posted 6.4% in February Y/Y, but the annual average taken back to February 2019 is 3.3%, still a good way above the target.  
Rolling three-year annual average core CPI
 image 31333
Source: Bloomberg, StoneX
We should also note, however, that the Fed keeps a very close eye on the core Personal Consumption Expenditure Index, the components of which are: -
Durable goods, 13%; non-durable goods, 22%; Services, 65%.
The latest core PCE number (January 2022) was 5.2% Y/Y, but 2.8% p.a. against January 2019.
Rolling three-year annual average core PCE
 image 31334
Source: Bloomberg, StoneX
The CPI figures, especially with the job market tight, show that underlying inflationary forces are indeed higher-for-longer than the Fed had been postulating during 2020 and underpins the growing hawkishness of 2021, and notably Jay Powell’s pivot after his renomination.  Indeed Mr. Powell did say in early March that with hindsight the Fed should have moved sooner with respect to interest rate hikes.
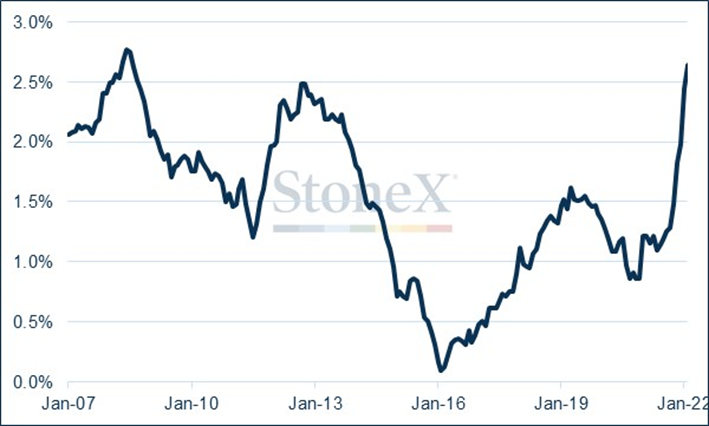
On the other side of the Atlantic, meanwhile, the EU Harmonised Consumer Price Index stood most recently at 5.6% Y/Y and an annual average since February 2019 of 2.6% p.a., which is more moderate and to some extent reflecting the fact that the EU economy is behind that of the States.  The Monetary Union Index of Consumer Prices is the weighted average of the HICP, and its three-year pattern is as follows: -
Rolling three-year annual average EU MUICP
 image 31335
Source: Bloomberg, StoneX
In summary, the rolling three-year averages in the United States started their aggressive rallies in March 2021 while in Europe, lift-off started in June 2021, giving numerical credence to the anecdotal comments that the EU is three months behind the United States.  The slower pace of EU recovery raises the spectre of stagflation (and also elsewhere) and the Governing Council of the European Central Bank meeting of yesterday (10th March) appears to have indicated a shift from its previous stance.  Following the meeting, the Head of Banque de France said that the Bank is no longer adhering to an automatic link between winding down bond purchases and raising interest rates, thus giving it some added flexibility in its rate cycle timing – “we’ll take all the necessary time”.  He was not the only member of the Council to espouse such thoughts, although more than one said that this shift does not mean a paradigm shift in timing.
Will these forces persist for the next two-to-three years?
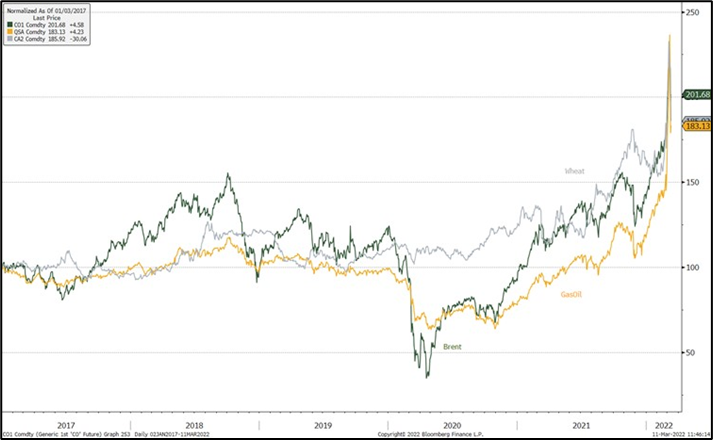
Gas Oil, Brent and Wheat

image 31337

Source: Bloomberg

Prior to the escalation of the issues in the Black Sea region, then the answer would have been that the resolution of supply chain dislocations – which would still have been some months away - would have taken some heat out of the situation and brought inflation back down towards a manageable 2‑3%.  Resolving that issue would mean that price pressures, especially those revolving around semiconductors and thus cascading into any number of industries, would fall away and the additional component of high freight rates would ebb away also. 

The Russia/Ukraine issue, however, changes the complexion.  Russia and Ukraine between them account for 30% of world wheat exports, for example and while there is evidence that some boats are getting out of China, nothing is moving from Ukraine and the supply shortfall is likely to contribute to food inflation (which is particularly high in Russia at almost 10%).  This could of course be mitigated if other producers, notably Australia, can fill the potential void.

Of more significance is the impact on energy, with Brent now trading in the region of $114/bbl, up 48% year on year and gas oil at $1,181/t, up 77%.  As and when the situation is resolved then the heat will come out of these markets, but with energy at 7% of CPI in the States, then this sector will continue to prop up prices for the next few months and the legacy at the retail level may persist for longer than that, especially with the strengthening labour market in the United States, with strong nonfarm payroll figures becoming the norm, especially for February, which was a long way above expectations, and with unemployment falling to 3.8%

Overall, therefore, the case can be made that this spike should work through in the next few months, but if central banks are to avoid knocking economic recovery off course, then the acceptable underlying manageable level of inflation may well have to be re-set towards 3%.

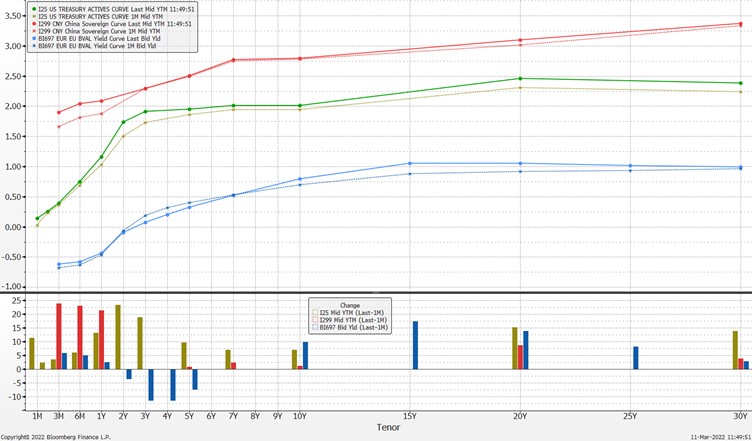
Major sovereign yield curves

image-20220311132007-9

Source: Bloomberg

And as a final note; at present, among the States, the EU region as a whole and China, the only nominal interest sovereign rates that exceed 3% are in China, starting over 15 years hence.  On balance, the geopolitical risks in the system, as well as their exacerbation of tightening commodity supply chains, as well as the prevalence of negative real rates around the world, continue to favour gold, although the checks and blackness of a reversal in Asian demand will help to keep something of a cap on prices.


  • Precious Metals

This material should be construed as market commentary and represents the opinions and viewpoints of the author, and does not reflect tailored advice associated with any specific account.


The views are current only through the date stated and are subject to change at any time based upon market or other conditions, and StoneX Group Inc. (“SGI”) disclaims any responsibility to update such views. Actual results, performance, or achievements may differ materially from those expressed or implied. Information is based on data gathered from what we believe are reliable sources. Past performance does not guarantee future results.


The StoneX Group Inc. group of companies provides financial services worldwide through its subsidiaries, including physical commodities, securities, exchange-traded and over-the-counter derivatives, risk management, global payments and foreign exchange products in accordance with applicable law in the jurisdictions where services are provided.


References to certain OTC products or swaps are made on behalf of StoneX Markets, LLC (SXM), a member of the National Futures Association (NFA) and provisionally registered with the U.S. Commodity Futures Trading Commission (CFTC) as a swap dealer. SXM’s products are designed only for individuals or firms who qualify under CFTC rules as an ‘Eligible Contract Participant’ and who have been accepted as customers of SXM.


StoneX Financial Inc. (SFI) is a member of FINRA/NFA/SIPC and registered with the MSRB. SFI is registered with the U.S. Securities and Exchange Commission (SEC) as a Broker-Dealer and with the CFTC as a Futures Commission Merchant and Commodity Trading Advisor. StoneX Financial (Canada) Inc. (SFCI) is registered in Canada and is a member of CIRO and CIPF. References to certain securities trading are made on behalf of the BD Division of SFI and are intended only for an audience of institutional clients as defined by FINRA Rule 4512(c). References to certain exchange-traded futures and options are made on behalf of the FCM Division of SFI. Wealth Management is offered through SA Stone Wealth Management Inc., member FINRA/SIPC, and SA Stone Investment Advisors Inc., an SEC-registered investment advisor, both wholly owned subsidiaries of SGI.

R.J. O’Brien & Associates, LLC (RJO) is registered with the CFTC as a Futures Commission Merchant and is a member of NFA.


StoneX Financial Ltd (SFL) is registered in England and Wales, company no. 5616586. SFL is authorized and regulated by the Financial Conduct Authority (FCA) (registration number FRN:446717) to provide services to professional and eligible customers including: arrangement, execution and, where required, clearing derivative transactions in exchange traded futures and options. SFL is also authorized to engage in the arrangement and execution of transactions in certain OTC products, certain securities trading, precious metals trading and payment services to eligible customers. SFL is authorized and regulated by the FCA under the Payment Services Regulations 2017 for the provision of payment services. SFL is a category 1 ring-dealing member of the London Metal Exchange. In addition SFL also engages in other physically delivered commodities business and other general business activities which are unregulated and not required to be authorized by the FCA.


This communication is issued in the European Economic Area by StoneX Financial Europe GmbH (SFEG). StoneX is the trade name used by STONEX GROUP INC. and all its associated entities and subsidiaries. StoneX Financial Europe GmbH (“SFEG”) is a securities trading firm registered in Germany under Company No. HRB 80844.


StoneX APAC Pte. Ltd. (“SAP”) (Co. Reg. No 200616676W) is regulated as a Dealer (PS20190001002) under the Precious Stones and Precious Metals (Prevention of Money Laundering and Terrorism Financing) Act 2019 for purposes of anti-money laundering and countering the financing of terrorism. SAP is an “Approved International Trading Company” authorized to act as a “Spot Commodity Broker” under the Commodity Trading Act.


StoneX Financial Pte Ltd (Co. Reg. No 201130598R) (“SFP”) is regulated by the Monetary Authority of Singapore and is a Capital Markets Service Licence holder (for dealing in capital market products), an Exempt Financial Adviser (for advising on investment products and issuing or promulgating analyses/ reports on investment products) and a Major Payment Institution (for domestic and cross-border money transfer services).


SFP may distribute analysis/report produced by its respective foreign affiliates within the StoneX Group of companies pursuant to an arrangement under Regulation 32C of the Financial Advisers Regulations Recipients should contact SFP at (65) 6309 1000 for any matters arising from, or in connection with, this webinar.


StoneX APAC Pte. Ltd. (“SAP”) (Co. Reg. No 200616676W) is regulated as a Dealer (PS20190001002) under the Precious Stones and Precious Metals (Prevention of Money Laundering and Terrorism Financing) Act 2019 for purposes of anti-money laundering and countering the financing of terrorism.


StoneX Financial (HK) Limited (CE No.: BCQ152) (“SHK”) is regulated by the Hong Kong Securities and Futures Commission for Dealing in Securities and Dealing in Futures Contracts.


StoneX Financial Pty Ltd (ACN 141 774 727) holds an Australian Financial Service License (AFSL: 345646) for Dealing in Securities, Exchange-Traded Derivatives Contracts, OTC Derivatives Contracts and Foreign Exchange Contracts, and is regulated by the Australian Securities and Investments Commission.


StoneX Securities Co., Ltd. (“SSJ”) (Co. Reg. No 010401047199) is regulated by the Japanese Financial Services Agency as a Type-I Financial Instruments Business Operator (Kanto Local Finance Bureau (FIBO)No.291’), is a member of the Financial Futures Association of Japan for dealing and broking FX and FX Option transactions, and is a member of the Japan Securities Dealers Association for dealing and broking stock indices and option transactions.


Trading swaps and over-the-counter derivatives, exchange-traded derivatives and options and securities involves substantial risk and is not suitable for all investors. Past performance of any futures or option is not indicative of future success. Indicators are not a trading system and are not published as a specific trade recommendation. The information herein is not a recommendation to trade nor investment research or an offer to buy or sell any derivative or security. It does not take into account your particular investment objectives, financial situation or needs and does not create a binding obligation on any of the StoneX group of companies to enter into any transaction with you. You are advised to perform an independent investigation of any transaction to determine whether any transaction is suitable for you. No part of this material may be copied, photocopied or duplicated in any form by any means or redistributed without the prior written consent of StoneX Group Inc.


The report/analysis herein is not directed to, or intended for distribution to or use by, any person or entity who is a citizen or resident of or located in any locality, state, country or other jurisdiction where such distribution, publication, availability or use would be contrary to law or regulation.


© 2026 StoneX Group Inc. All Rights Reserved.

Satellite view of Earth at night showing illuminated cities across Asia and the Middle East

Discover more insights

Our subscribers have access to comprehensive market analysis from StoneX spanning commodities, equities, currencies and more.

StoneX: We open markets

Our market expertise, advanced platforms, global reach, culture of full transparency and commitment to our clients’ success all set us apart in the financial marketplace.

Reach

With access to 40+ derivatives exchanges, 180+ foreign exchange markets, nearly every global securities marketplace and numerous bi-lateral liquidity venues, StoneX’s digital network and deep relationships can take clients anywhere they want to go.

Transparency

As a publicly traded company meeting the highest standards of regulatory compliance in the markets we serve; our financials and record of accomplishment are matters of public record. StoneX’s commitment to “doing the right thing over the easy thing” sets us apart in the industry and helps us build respect, client trust and new partnerships.

Expertise

From our proprietary Market Intelligence platform, to “boots on the ground” expertise from award-winning traders and professionals, we connect our clients directly to actionable insights they can use to make more informed decisions and achieve their goals in the global markets.