LBMA Precious Metals market volumes, March 2022 and their significance
Rhona O’Connell, StoneX Financial Ltd; 4th April 2022
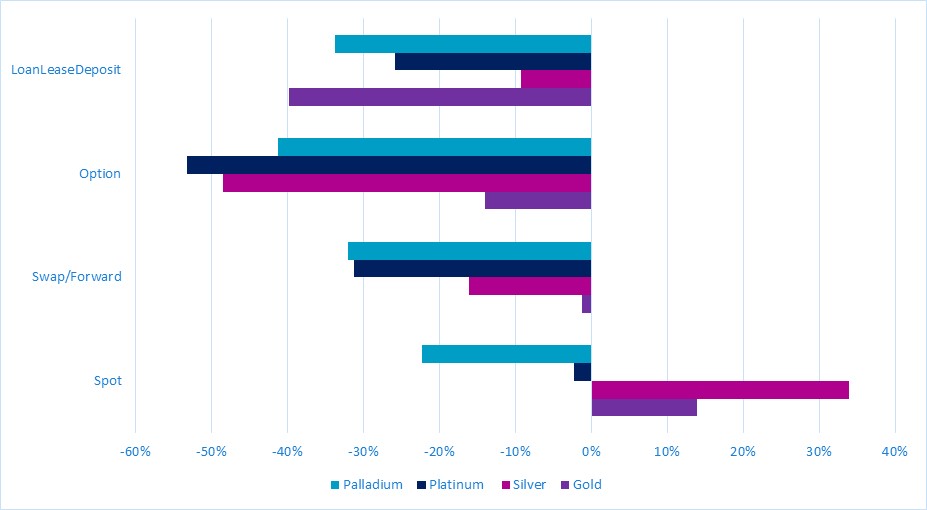
Welcome to our round-up of precious metals activity in March 2022, and a look at the context helping to influence market volumes – and vice versa. Spot gold and silver volumes were higher than the daily average over the previous twelve months, while everything else was down. Platinum spot volumes were marginally lower, but spot palladium and the derivatives in all four metals were well down. The latter were particularly affected by uncertain sentiment over Ukraine and the potential for disruption to supplies.
The latest state of play in this respect is that the LBMA has suspended Good Delivery listing for gold and silver from six Russian refineries. As we write in early April the LPPM ‘s statement on the subject is that it has decided to make no changes to the Good Delivery list, but “will continue to monitor and review the situation”.
The heaviest fall in volume across the whole suite was in platinum options, which were down 53% against the average for the previous twelve months. Platinum forwards and LoanLeaseDeposit were down 31% and 26% respectively, while palladium swaps/forwards were down 31% and LoanLeaseDeposit dropped by 34%.
Now we will examine the patterns in each of the individual metals and set them into context.
Daily average trading volumes in March, compared with March 2021-February 2022
GOLD
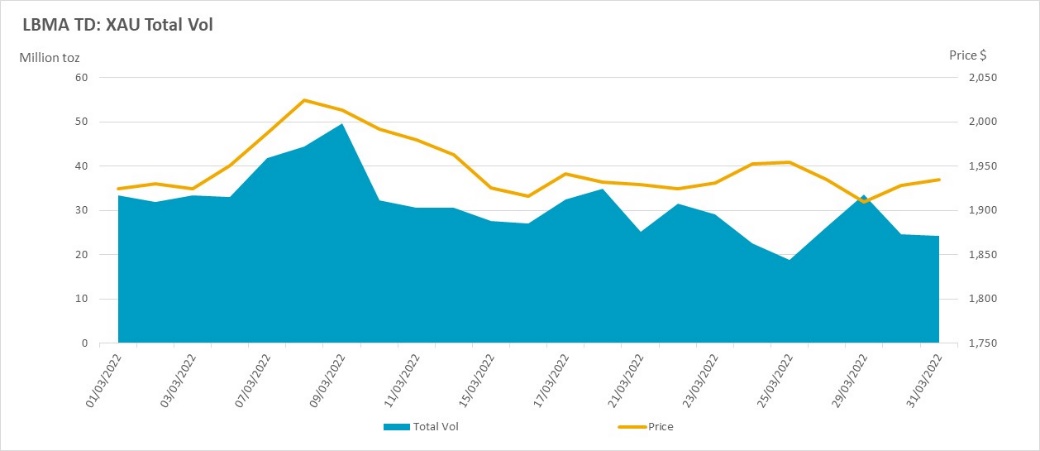
Gold’s liveliest action was clearly in the first seven trading days of the month, with the heaviest volumes unsurprisingly coming in the hard rally to the 19-month peak of over $2,000 (7th and 8th March) and the equally aggressive drop the following day, which took spot back down towards $1,975. As we have often noted before, volumes are almost invariably high during a sharp reversal as sentiment changes but in this case the breach, not just of the important psychological $2,000 level but also of $2,050, prompted profit taking on the 9th and momentum trades would have kicked in both on the way up and the way down. All three days were in exceptionally high volume in excess of 26M ounces against the monthly average, excluding those days, of 18M ounces, before subsiding.
Background features accelerating the run to the highs included the statement from President Biden that the United States would ban imports of Russian fossil fuels, as did the U.K., although the latter constrained its ban to oil. Kinross Gold also suspended its operations at its Kupol mine and the development work at the Udinsk project.
It was at this point also that news broke that some U.S. Senators, from both sides of the house, were looking for a meeting with Treasury Secretary Yellen with a view to barring any transactions in Russian official gold reserves. Since the vast majority of Russia’s reserves are believed to be onshore, this is unlikely.
In the background, physical gold demand in price-elastic countries in the Middle East and Asia went sharply into reverse; physical demand not only dried up but selling developed in much of south-east Asia.
Hefty spot activity was not closely matched in the derivatives. While there was some increased activity in options and forwards, suggesting a degree of hedging into price strength, the LoanLeaseDeposit (LLD) element was quiet and only picked up as prices declined further as we moved into mid-month and prices continued to slide towards $1,900. The figures for activity on COMEX during the price decline shows sizeable, long liquidation and some fresh shorts, and if this carries over into the OTC market as well then the higher volumes in the LLD sector would suggest some nervous hedging.
The second half of the month saw activity decline across the board, and the price held to a narrow range between $1,900 and $1,950 as the markets watched geopolitics on the one hand and fretted over central banks’ monetary policy on the other. Expectations intensified over the likelihood of a 50-basis point rate hike from the Fed at its May meeting, while on the other hand the yield curve started flipping in and out of inversion towards month-end, suggesting concerns over stagflation. With these conflicting elements swirling in the background there was little appetite to take definitive positions in the market. One supportive element was that physical demand started to re-emerge. Probably the most interesting development was that the Russian central bank was reported mid-month to have suspended gold purchases from domestic banks in order to meet domestic demand for gold bars – this following the suspension of VAT from gold purchases.
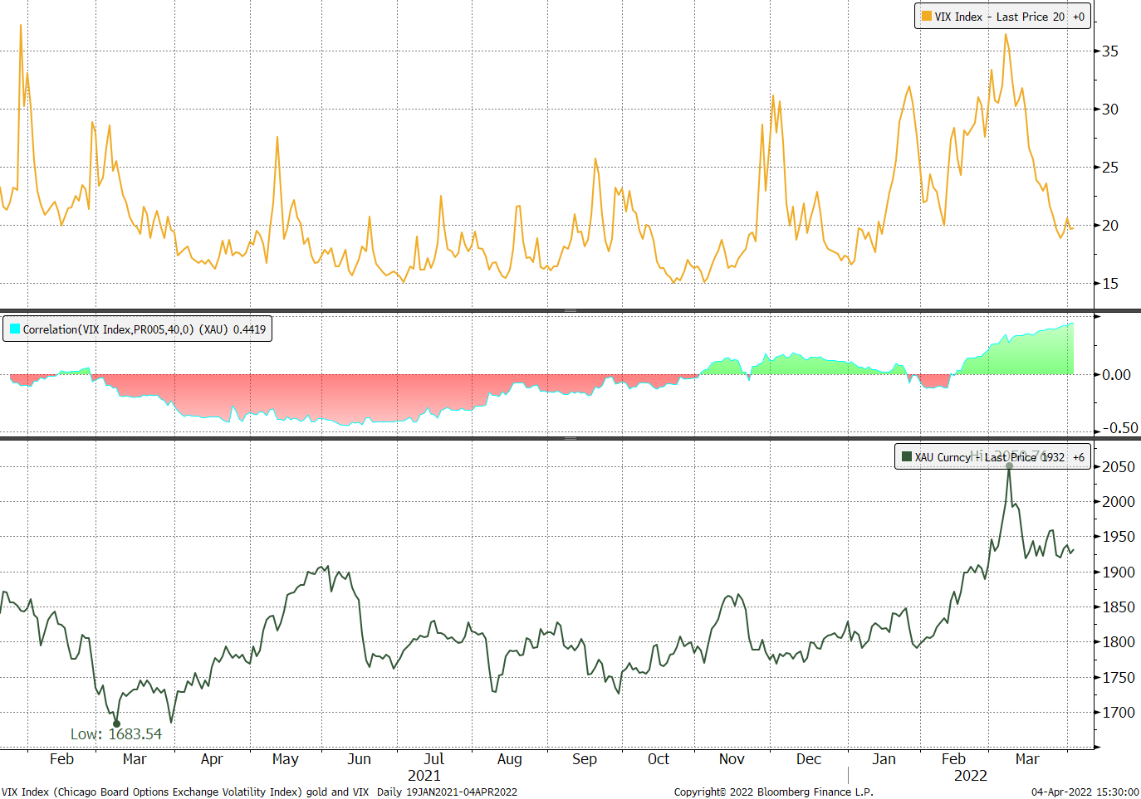
Gold and the VIX uncertainty index; the correlation moves into positive territory during the conflict
Source: Bloomberg
SILVER
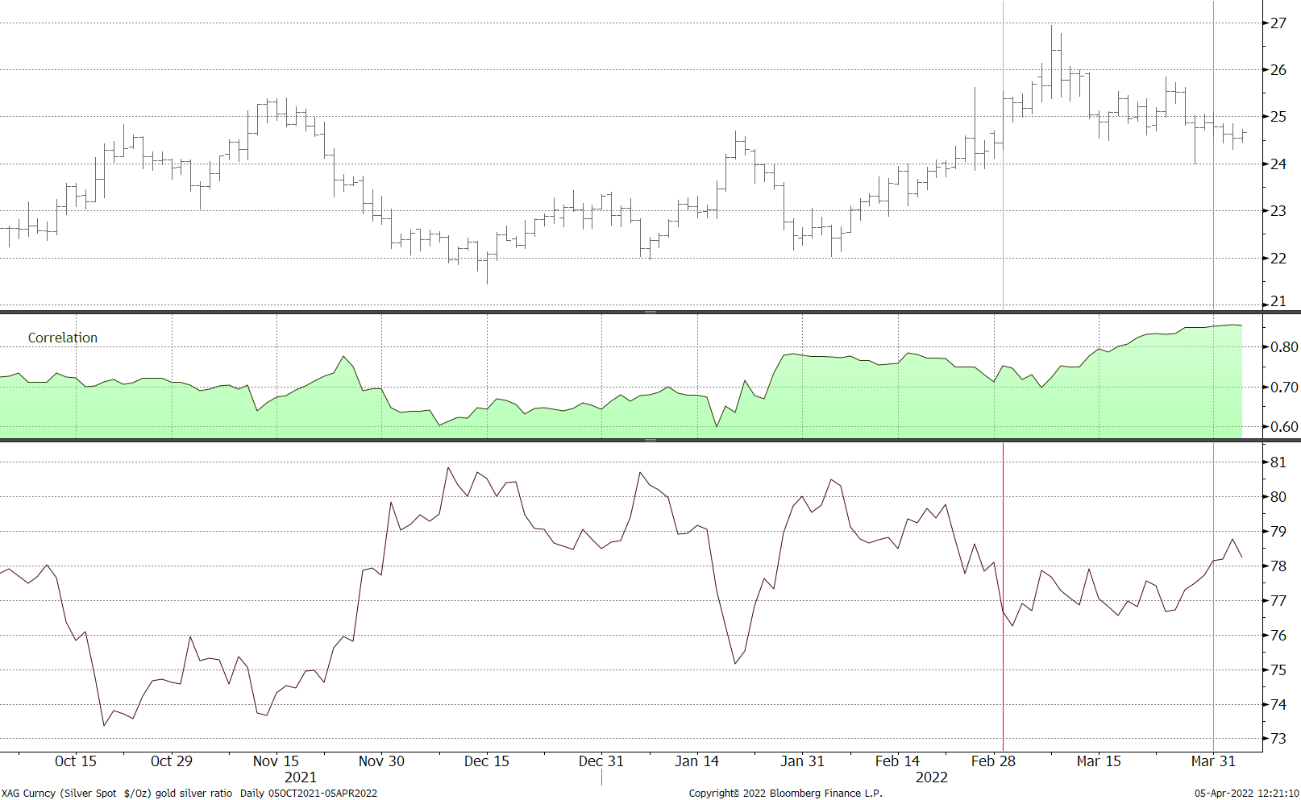
Silver was again in thrall to gold for much of March, rallying hard to test $27 as gold scaled $2,050; retreating to $24.50 consolidating mid-month around $25, but then drifting lower as $25 changed from support to resistance. The gold:silver ratio was broadly steady just below 77 for much of the month but as silver went onto the back foot the ratio widened and was above 78 by month-end. The interesting activity was in the derivatives.
Spot volumes also followed gold’s pattern, with heavy trading as both gold and silver broke higher, then tailed off remarkably in mid-month. From a fundamental standpoint the sentiment surrounding industrial side of the market (~60% of global demand) was deteriorating on increasing economic uncertainty, while speculative elements withdrew following the failure at $27. CFTC numbers underpin this assertion, with the week to 15th March showing reductions in open positions on both the long and short side. In fact this contraction in interest continued through to the end of the month, with longs falling by 16% and shorts by 22%. The only real life in the latter weeks came on the 28th and 29th as silver initially dropped below $25 and then spiked down for a brief test of $24 before recovering towards $$24.50, where a body of support seems to be developing. The key influence at this point was renewed market chatter about the Fed’s likely activity at the May meeting and U.S. yields climbing again with brief inversions in the curve underlining fears of reduced economic activity.
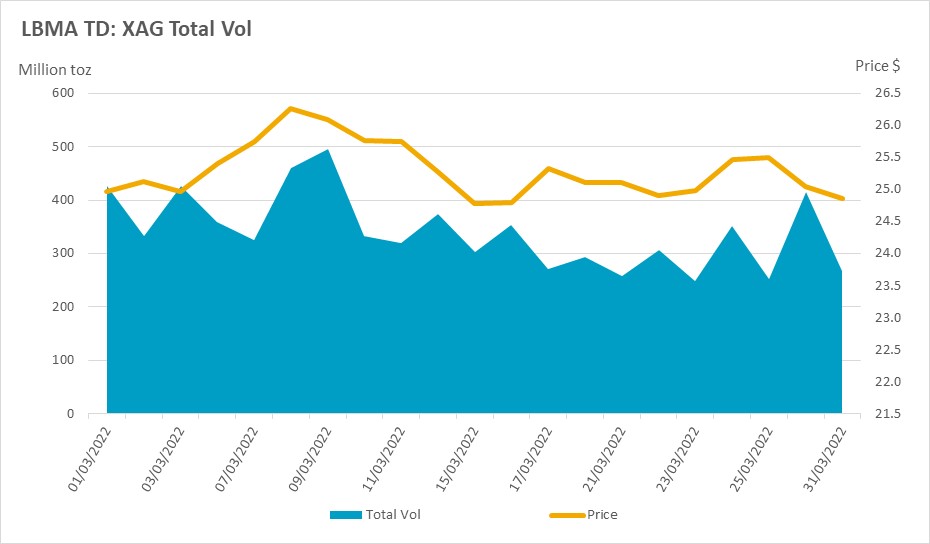
In the derivatives, however, it was much more interesting. There was very interesting volume at the start of the month in both the forwards and the LLD sectors, as silver moved above $25, suggesting some lively hedging activity and quite possibly some forward buying on expectations that silver would benefit from gold’s safe-haven rally and potentially stay high. The average daily forwards volume in the first three days was broadly in line with the daily average of the February at 106M ounces, but on the 2nd March, there was a big outlier in the LLD, at 18M ounces, compared with a daily average of 11M ounces in February. This looks like a “one-off “as silver had moved above $25 and could have helped quell the move. The reversal in prices saw derivative volume dwindle in all three sectors, with the result that average forward volume for the month was 16% lower than the previous twelve-month average, options were down 49% and LLD was down 9%. There was one final burst of life in both spot and forwards towards month-end after silver’s attack on $26 had failed, suggesting that there was more defensive hedging taking place along with some stale bull liquidation.
Gold and silver; six-month view
Source: Bloomberg
PLATINUM
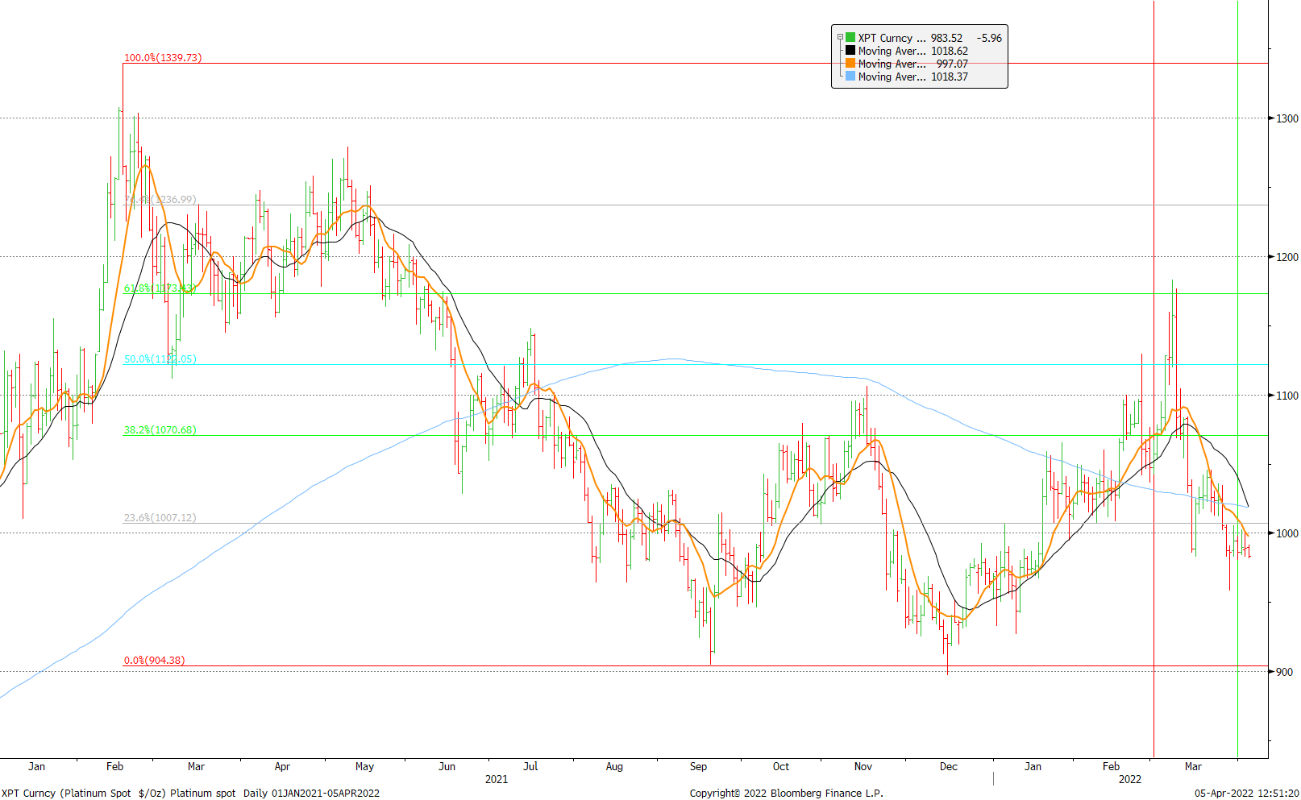
Platinum was another member of the commodity sector that rallied in the first week of March as the markets tried to assess supply risk due to the war in Ukraine, especially as Ukraine is a major producer of neon, which is important for engraving semiconductor chips, thus making that particular supply chain even more fragile, quite apart from the imposition of sanctions on Russia. As noted above, the LPPM has thus far not suspended the Russian PGM brands from good delivery, but for the sake for context, Russia supplies roughly 10% of the world’s platinum and roughly 37% of palladium. The rally was short-lived though and the price ended the month some $70 lower than it started at $986 .
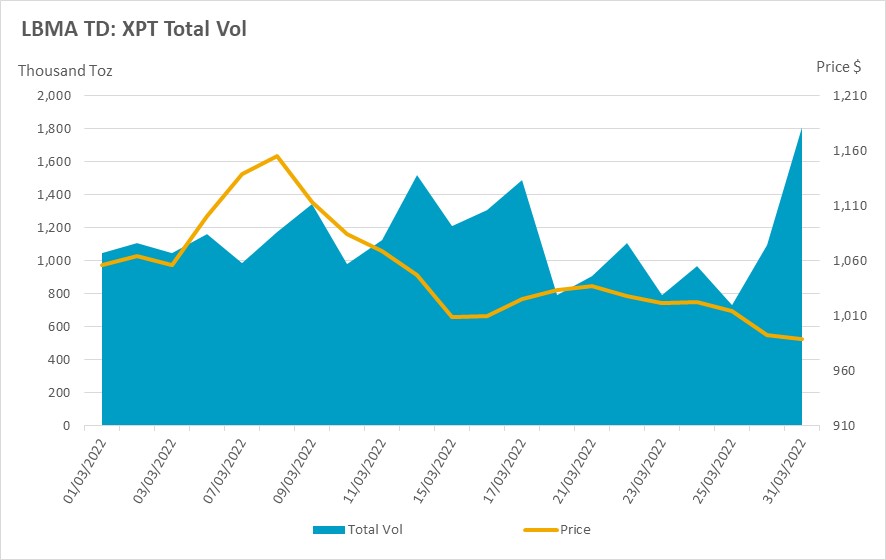
Platinum volumes did not correspond to those in gold and silver (and palladium) as conditions were thin in the first few days, both in spot and the derivatives, with LLD particularly sparse. We can almost certainly ascribe this to uncertainty about the situation overall and the possibility of brand suspension. So these numbers back up what anecdotal evidence was suggesting, i.e. that the run-up in the first few days from $1,047 to $1,183 was very largely speculatively driven, and the gains were given back as rapidly as they were made, with a 17% fall in five trading days in mid-month. CFTC numbers show substantial long liquidation over the month, with outright longs on NYMEX falling from 48t on 8th March to just 29t by moth-end. Shorts also contracted as participants moved to the side-lines in uncertain conditions.
While gold and silver rallied in high volume, platinum’s gain was in thin conditions, with spot volumes not picking up until the rally went sharply into reverse on the 9th, with prices falling from $1,177 to $1,069 in one day. The next high-volume day was the following Monday, the 14th and this too was a day of losses. The derivatives remained quiet across the board, and we only saw any real signs of life on just two days. The first was on 17th, when over 530,000 ounces turned over in the forwards on the 17th. This was during an upward correction from the sharp mid-month fall after prices had regained $1,000 and this looks like participants locking into the rally.
Spot platinum, January 2021 to early April 2022
Source: Bloomberg
The last day of March saw lively action in all four sectors. This was as the price rallied from yet another fall and got as far as $998 before coiming under fresh selling pressure. Spot volumes were 9% higher than the daily average for the month, forwards were up 55% while options and LLD were both five times higher than the average. The fact that this was on “PGMs Industry Day” mining conference in South Africa was pure coincidence! More likely was that, as well as the approach to $1,000, it was starting to look as if some progress towards peace was being made – although that proved to be short-lived, at that stage, at least.
PALLADIUM
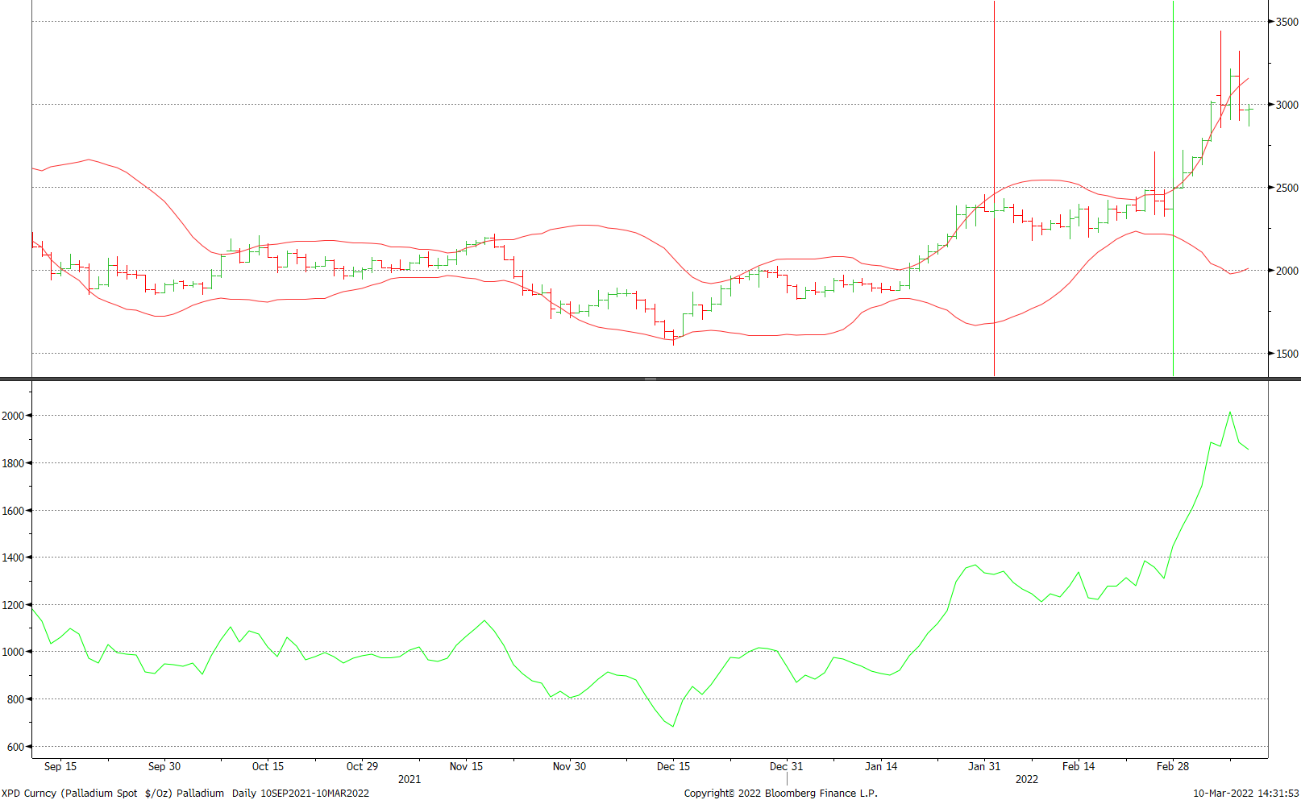
Russia is responsible for roughly 38% of the world’s palladium and the metal was, accordingly, one of the strongest performers in the early March rally, gaining 38% or $950 in the space of five trading days. Spot hit a record intraday high of $3,442 on the 7th, held largely above $3,000 for three days then started a rolling slide towards $2,040 just before month-end and an attempted correction in early April, by which stage there were signs of industrial buying interest for the first time in a number of weeks.
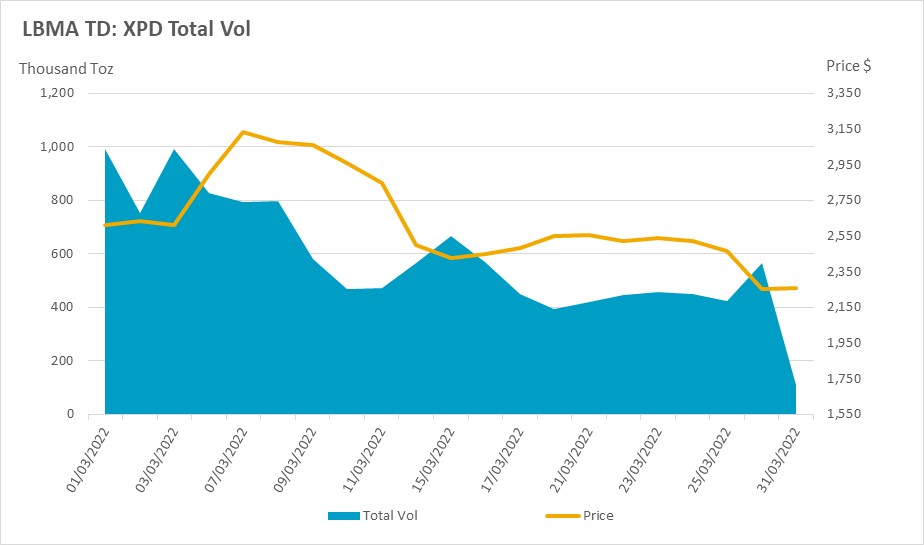
Spot volumes were consistently heavy for the first five days of the month, eclipsing the patterns of activity in gold, silver and especially platinum. At a daily average of just over 558,000 ounces those first five days were on a par with the increased volume of late February as the Ukraine situation evolved, but some 10% higher than the February average overall.
Activity was very lively in the forwards also, with the first six days averaging just over 258,000 ounces, also roughly level with the latter part of February and then posting a very high 395,026 ounces on the 8th as prices started coming off, implying that there has been some forward cover buying on the way up and likely some hedging on the way down, especially as activity was also high in the LLD sector.
Spot palladium and the spread with platinum, six months view
Source: Bloomberg
Those balmy days were short-lived, however, and the average spot turnover for the rest of March was just 327,000 ounces, falling to below 90,000 ounces on the last day of the month. The only feature of note was a sharp pick-up in LLD activity in the last week of the month and tying in with anecdotal evidence of fresh interest suggests that there may have been some additional bargain hunting and / or borrowing on the part of consumers as prices dipped towards $2,000 and started tip-toeing higher in early April.