- Resolution of the debt ceiling (for now) takes heat out of the market
- Dollar firms and some yields pick up, all of which pressures gold
- Silver (as is usual) fell by more with a near-perfect beta of two
- ETF activity reflects the cautiousness of the latter part of the month, as does COMEX activity
- Silver Eagles sales in May were up 77% over April; gold halved
Key points:
After fresh banking stresses had powered gold to an intra-day high of almost $2,090 on 4th May, the subsequent release of tension over the US debt ceiling burst the bubble. Under long liquidation and a sign of some fresh short selling gold prices have slipped over the second half of May and into early June, printing as low as $1,938 (intraday) on Monday 5th June.
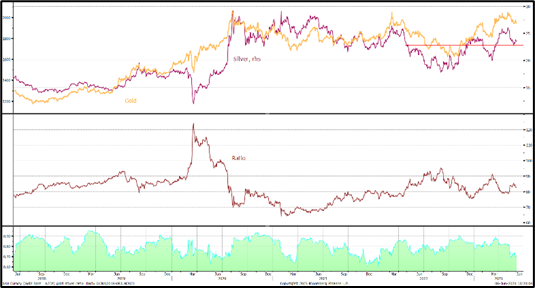
Private investor interest in the precious metals was certainly sustained during May, but the emphasis was very much on silver rather than gold. Gold had reached intraday highs early in the month and its high and volatile price probably put some would-be investors off, where as silver, as well as having a much lower unit price, came down further and faster than gold, as is usual when the two are moving with any speed. Gold’s high-to-low fall of 6.5% was outpaced by that of silver, which dropped by 13% over the same period. The ratio between the two obviously widened, reaching almost 86, after spending most of April between 87 and 80, and a January-April average of 83.0.
Gold, silver, the ratio and the correlation
Source: Bloomberg, StoneX
Spotlight back on the Fed
The main visible drivers in the background were the negotiations over the debt ceiling, which in mid-month were still looking as if they were on a knife-edge. Experience tells every-one that there would not be a default, but the polarisation in Congress was creating concern that this time might be different. In the end, however, President Biden and House Speaker McCarthy came to a compromise and when push came to shove in Congress, moderate views prevailed and the ceiling limit has been pushed back to January 2025. This suggests that the negotations won’t start, next time around, until after the elections, but it would come as no surprise if it came up during the campaign runs.
In the background, and less visible, geopolitical risk has remained supportive, along with the continued reports around sustained central bank interest in gold. The latter is important; it is not necessarily the question of the tonnage (although on the basis of World Gold Council figures, demand has been active in the first months of this year, despite some selling from Turkey in April that is believed to have fed dramatic demand domestically); of equal significance is the message that the central banks are sending to the rest of the investment fraternity in terms of the need for gold to mitigate risk, especially in a period when the geopolitical powerplays are pointing towards efforts at reducing the massive role that the dollar plays within the system.
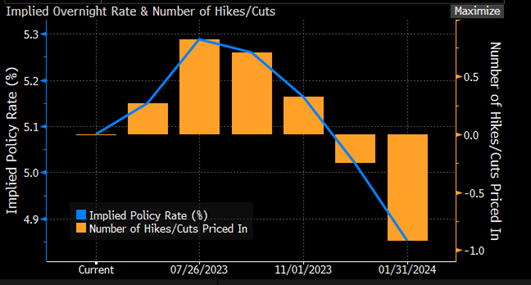
Fed funds implied overnight rate
Source: Bloomberg
Now the markets have turned, yet again, to the prospect of the next Federal Open Market Committee’s meeting (this one is June 13-14th). Opinions are mixed, given that some recent economic results have been poor, but the labour market remains strong and that is one of the key elements that informs Fed opinion. The Job Openings index for April was stronger than expected at 10.1M and the change in NonFarm Payrolls, at 339 thousand, was well above expectations, although the unemployment rate rose from 3.4% to 3.7% and average hours slowed. So the numbers were mixed, but on balance they look likely to keep the Fed on the front foot. The fed funds markets are currently pricing in a 40% chance of a 25-point hike next week.
Gold, technical indicators; the major shorter-term averages all negative. RSI neutral, MACD negative
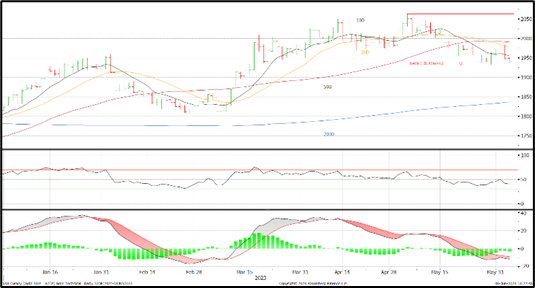
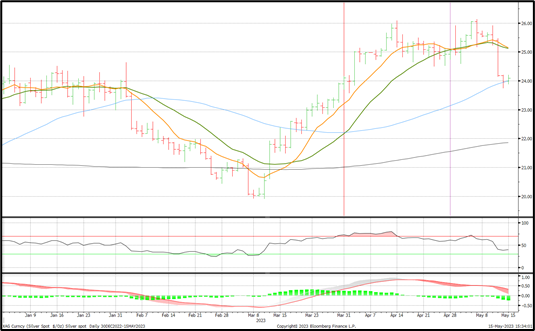
Silver, technical indicators; moving averages negative; “death cross” (50D moving below 200D) looks near
Source for both charts: Bloomberg, StoneX
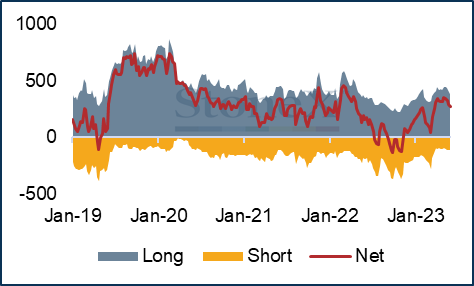
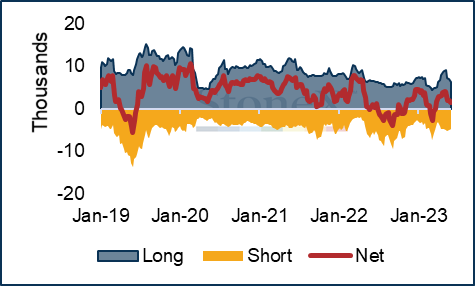
Among the Money Managers on COMEX, sentiment turned against gold and silver as the debt ceiling talks made progress and the banking system stresses seem to have taken a back-burner position, at least for now. Over the second half of May the outright long gold positions declined by 53t or 12% to 382t while the shorts increased by just 2t to 113t; this means that the gross long position was just 61t, or 15%, higher than the twelve-month average. The silver gross long overhang, by contrast, has been more or less cleared out now with a 13% fall to 6,302t, which is just 1% over the twelve-month average. There is nothing to say that the net silver position (currently 1,492t) can’t flip into a net short, but at least the imbalance on the long side has been drawn down.
Gold and silver COMEX positions (tonnes)
Gold
Silver
Source: CFTC, Bloomberg, StoneX
As far as the Exchange Traded Products are concerned, the gold screen started turning red in mid-month also, although there has been some intermittent bargain-hunting. Up to 11th May there was a net addition of 22t to 3,481t, but since then there has been steady, if relatively small-scale, liquidation with net redemptions of just one tonne to stand at 3,480t (world mine production is ~4,000t). Silver was on the defensive, but only marginally so, with nine days of net additions from a total of 25 trading days; since the start of May the silver ETPs have lost 151t to stand at 23,231t (world mine production is ~25,600t). At less than 1% of holdings, this is essentially flat, reflecting that a) more silver, proportionally, is held by retail investors than by institutional and b) that many investors – both professional and retail – have preferred to sit on their hands while the geopolitical and financial tableaux have played out over the month.

Source: Bloomberg StoneX