Precious Metals Talking Points: gold and silver weekly round-up for stonex bullion
17th july 2023
Rhona O'Connell
Head of Market Analysis, EMEA & Asia;
+44 203 580 6115; mobile +44 7384 833 897
Weekly roundup for StoneX Bullion 17 July 2023
Welcome to our newly re-branded entity ”StoneX Bullion”, which replaces the previous “CoinInvest” brand and which went live this weekend. This ties in with our very successful US franchise and thus gives a seamless global product brand within the precious metals markets.
The website is
https://stonexbullion.com/.
Weekly roundup for StoneX Bullion 17 July 2023
Welcome to our newly re-branded entity ”StoneX Bullion”, which replaces the previous “CoinInvest” brand and which went live this weekend. This ties in with our very successful US franchise and thus gives a seamless global product brand within the precious metals markets.
The website is
https://stonexbullion.com/.
- Focus on inflation numbers and rate implications
- Federal Reserve Beige Book shows a slight improvement in economic activity
- Gold’s technical picture is now supportive
- As is that of silver
- But coin sales are still sluggish
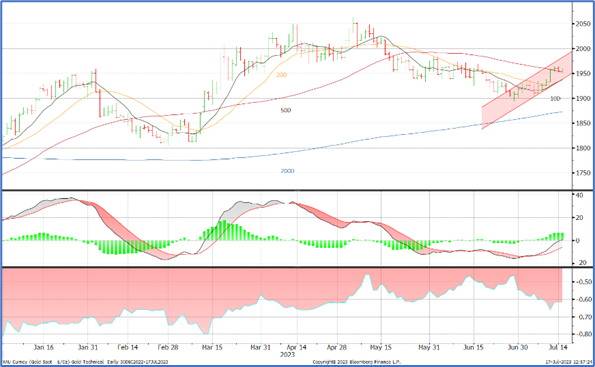
Gold and silver were both steady at the start of last week as the markets absorbed the employment numbers at the end of the previous week, and which were weaker than the markets had been expecting. Focus soon switched to the inflation figures coming from the United States on Thursday and Friday. These were generally in line with, or lower than, expectations and while the numbers are still too high for the Fed’s satisfaction, they are moving in the right direction and some gentle breezes blew through the markets accordingly. Some observers are now suggesting that there may only be one more rate hike in the offing. This may be over-optimistic and raises the possibility of disappointment further down the line, which would be bearish for gold and, by association, silver. In the immediate term, though, the results saw gold lift from its prior range of $1,910-$1,930, and rally towards $1,960. It has now pushed above the ten-day, 20-day and 50-day moving averages, having had a tussle with them at the end of the week, but ultimately breaking upwards. These averages should, in theory, support prices between $1,952 and $1,957, but the position is still slightly tenuous and more consolidation is needed.
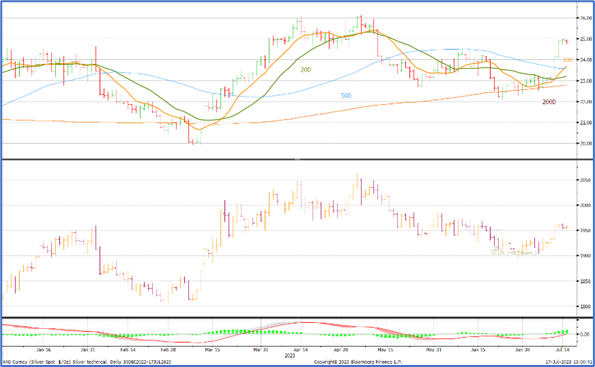
Silver’s technical position is slightly stronger, with the ten-day average now above the 20-day and the 50-day after spot prices followed gold higher, pulling away from $23 to test resistance at $25. There is a band of resistance between $25 and $26, so silver also needs to consolidate. Gold’s gain last week was just 0.5% and it now has to cope with resistance at $1,960 while that of silver was 7.5% and the ratio between the two has now dropped to 78, a level last seen in mid-January.
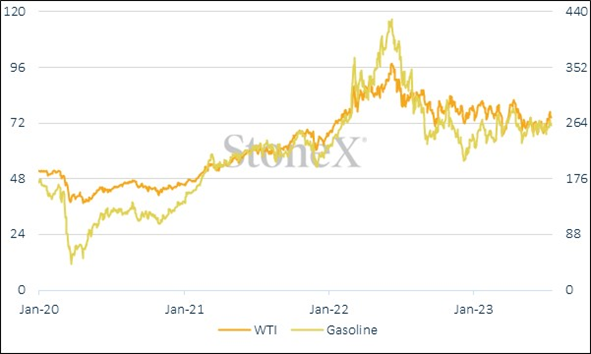
The US inflation numbers saw the Producer Price index steady at +0.2% month-on-month and 2.4% year-on-year, while the consumer price index was marginally below expectations at 0.2$% month-on-month and 3.00% year-on-year. The core CPI, which the Fed tends to prefer to monitor, was 4.8% against a survey consensus expectation of 5.0%, illustrating how the drop in energy prices has fed through to the baseline inflation numbers(see chart below).
West Texas Intermediate crude and gasoline
Source: Bloomberg, StoneX
The bond markets are now pricing in a July hike, but only a 12% chance of a further hike in September.
In the background last Friday saw the first increase in gold ETP holdings since mid-June and only the second increase since late May. It is far too early to suggest a change in trend, but the bargain hunting at lower prices has cushioned the price fall and it is possible that this has fed through and encouraged some light fresh interest. Among the Money Managers on COMEX the change in sentiment is more marked, with a 46t (14%) increase in outright longs, but also a four tonne increase in the outright shorts, taking the net long to 259t. At 389t the outright longs are 51t or 15% higher than the 12-month average. This change was prior to the rally towards $1,960 so next week’s numbers will be instructive as to whether there was further long interest, short-covering, or some profit taking. Or all three!
Gold technical and dollar relationship, year to date
Source: Bloomberg
In the silver market the sentiment was much more cautious, with continued long liquidation and additional shorts, taking the outright longs down by just 1% to 5,281t, the lowest since late March and 15% below the twelve-month average. Shorts increased again by 114t or 3% to take the net long to 1,575t. The size of the rally later in the week strongly suggests short covering.
In the retail market we noted previously that coin sales were losing momentum and that premia had contracted sharply; this is illustrated by the latest figures from the U.S. Mint, which show that the first half of the month saw gold Eagle sales running at roughly 65% of the rate in June and 60% of the monthly average for the first half-year. Silver Eagle sales are much better, though, running at roughly the same rate as gold, with the first half of July at ~64% of June but only 52% that of the first half-year.
Spot silver, technical, year-to-date
Source: Bloomberg, StoneX
| | 17 July 2023 | Previous week | % change | Year-to-date | Range Jan 2022 onwards | Range as % |
| | | | | | Min | Max | |
| Gold (pm LBMA price) | 1,953.70 | 1,922.30 | 1.63% | 5.99% | 1,628.75 | 2,048.45 | 25.77% |
| Silver (LBMA price) | 24.77 | 22.72 | 9.05% | -0.50% | 17.77 | 26.03 | 46.45% |
| Platinum (pm LBMA price) | 977.00 | 907.00 | 7.72% | -9.70% | 838.00 | 1,128.00 | 34.61% |
| Palladium (pm LBMA price) | 1,267.00 | 1,239.00 | 2.26% | -29.42% | 1,200.00 | 2,315.00 | 92.92% |
| S&P 500 | 4,505.42 | 4,398.95 | 2.42% | 17.82% | 3,577.03 | 4,510.04 | 26.08% |
| $:€ | 1.1228 | 1.0967 | 2.38% | 5.26% | 0.9594 | 1.1228 | 17.03% |