LBMA Precious Metals market volumes, March 2023, and their significance
Rhona O’Connell, StoneX Financial Ltd; 6th April 2023
This is written in conjunction wit LBMA OTC spot and derivatives trading voolumes adn will be published on the NASDAQ website later this moth. Please do not distribute
Welcome to our round-up of precious metals activity in February - March 2023, and a look at the context helping to influence market volumes – and vice versa. After a period of correction in February, gold resumed its bull phase in March, especially in mid-month when banking stresses started to surface and gold came to the fore as a hedge against risk as opposed to an imperfect inflation hedge. Silver followed a similar profile but in wider ranges (as is usually the case). Platinum, which had started the year on the defensive, became rejuvenated in mid-February while palladium remained in the doldrums and by end-March was at the lowest since June 2019.
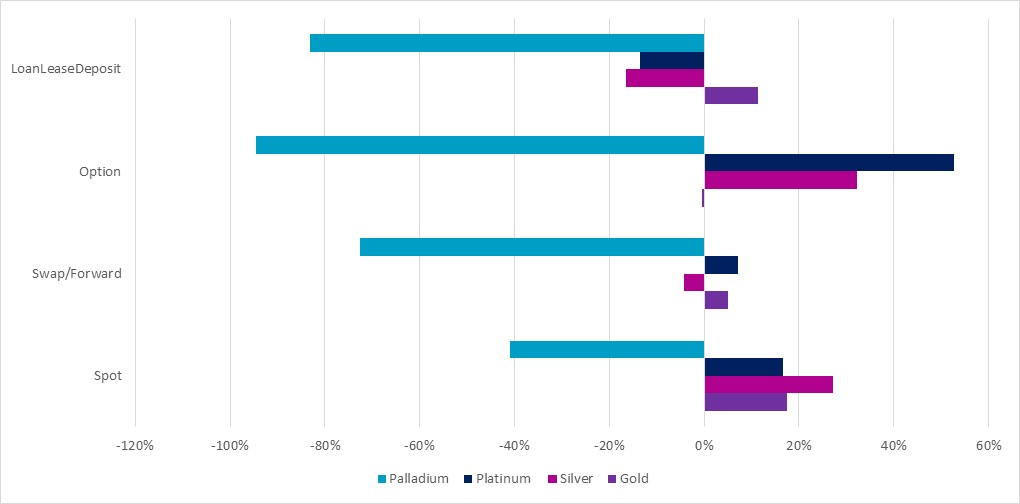
Daily average trading volumes in March, compared with January - December 2022
Source: LBMA, NASDAQ
Spot volumes were up across the board when compared with the previous twelve months, notably palladium, which staged a substantial recovery. The same applied with respect to March this year against March 2022. Among the derivatives, options took a big jump all round when compared to the previous twelve months, which could reflect the belief that a bull phase was around the corner. It may be different for palladium, in that, while prices were not turning up, the gradual revival in the automotive sector could have been enticing some operators into the market, especially as the price’s flat profile could well have meant that options were attractively priced.
GOLD
Spot volumes, March, tonnes
Source: LBMA, NASDAQ
February and March, but much more importantly March, were the months in which gold finally stepped out from the backseat behind inflationary and interest rate considerations, and moved into the spotlight in its favoured and primary role – a hedge against risk. While the failures of three American banks towards the end of March all had their own individual root causes, market observers have been postulating that the size of the rate hikes in the States (and potentially also in Europe) have exposed some weaknesses, and that the first few banks have now fractured.
This is not to say that there are major risks across the banking sector, and the speed with which the authorities moved in both the United States and in Switzerland in late March assuaged concerns, at least to start with. Persistent comments about how banking issues take time to develop, and then take time to disperse, have helped to inform nervous market sentiment and, as always, it is perception that will initially move markets, as the reality takes time to evolve.
So a reasonable interpretation here is that, after months of Fed-watching and being in thrall to interest rate movements, market operators are now giving weight to the view that the banking sector has to tread a fine line. They need to foster their own liquidity to protect their balance sheets, yet similarly, with recessionary influences growing, there is also a need to keep credit flowing to smaller industries, which are the backbone of the economy.
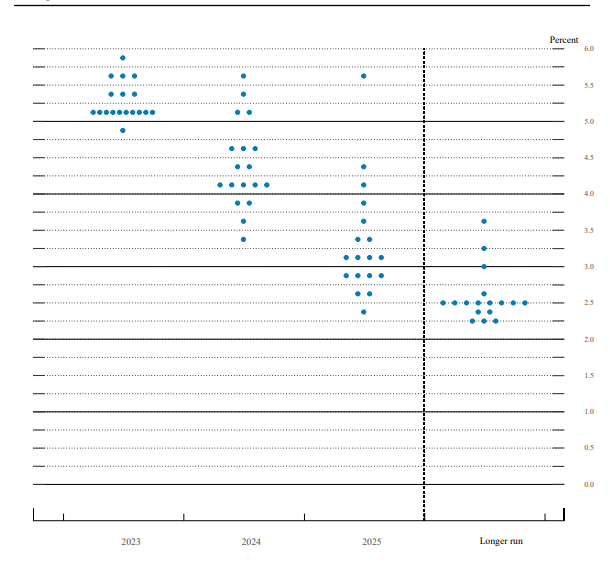
With the Fed constantly under the microscope of the financial sector and with the next meeting due on 2nd and 3rd May, the fed funds debate has not gone away. Earlier this year the fed funds markets, which have always been erring on the side of caution as against the Fed’s close adherence to the perceived strength of the labour market, were looking for a peak in June, at just below 5%, following strong labour numbers in January. As we write in the first week of April, the markets are now, following the weakening U.S. economic numbers and the stuttering in Purchasing Mangers’ Indices around the world, taking a much more cautious view and – especially following the poor Job Openings numbers (JOLTS)in early April - only putting a 25% probability of even a 25-point hike in May.
The Fed dot plot from March 2022
Source: Federal Reserve Board
So all these ebbs and flows of recent weeks have brought a change in sentiment in the gold market that almost overshadows the minutiae of movements in February and March. But the background is still important in order to understand the foreground, so here is a brief synopsis of gold’s activity since January:
Key points from February and March:
February: the months started with heavy spot volumes on 2nd and 3rd February following the Fed Statement (25 basis point hike) and expectations that the January NonFarm Payroll numbers would be strong. Prices dropped from $1,960 to $1,865 on 1st and 2nd, then reversed (briefly) on good volume. Heavy LoanLeaseDeposit (LLD) activity on the 3rd as prices dropped through $1,900 implies hedging.
Spot trading volumes were roughly level with those of January through much of the month until after a gentle slide lower, an attempt to regain $1,850 failed twice. Then thin again until a three-day period in the final week that proved to be the turning point; prices tested $1,800, found good support, and started laying the foundations for the March price rise.
Interestingly one of the very slowest days in spot was a massive outlier in swap/forward, when gold had dropped below $1,850. Since this was the first time since early January that gold had traded below $1,850, this could well have been forward buying (and given the official sector’s activity in the markets this could – could – have been a source of the interest).
Activity in the LLD sector was variable, but generally picked up when gold was trading either side of a key psychological level, notably $1,850 and $1,900. Options were generally sluggish.
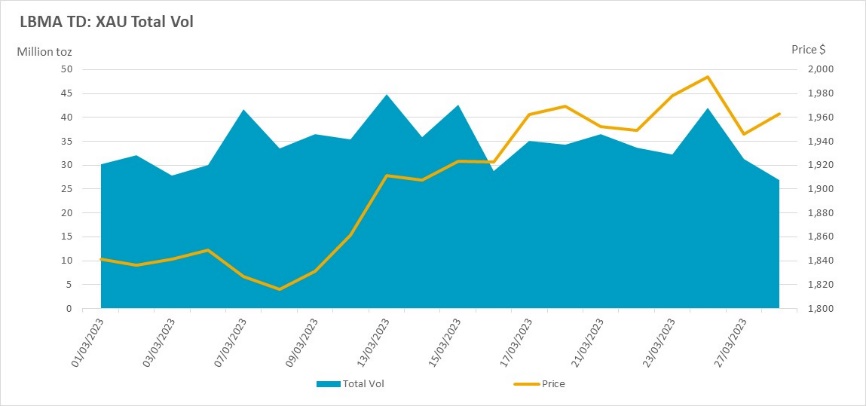
March is very simple by way of volume analysis because of the nature of the fundamental developments. -Spot conditions were sluggish in the first couple of weeks as the market fought shy of clearing $1,850, but then was propelled through that level as the first news of the banking sector turmoil filtered through (Friday 10th March and over the weekend). Then gold volumes picked up smartly and stayed strong for over a week, averaging 25.2M ounces (784t) per day, 22% higher than volumes in the year to 10th March as the banking story gained traction. Forwards and LLD were also lively although with the exception of the first day of this activity, options were quiet.
Conditions settled down around the 22nd March after challenges of $2,000 had failed and the rest of the month was a period of consolidation in a range between $1,950 and $2,000. The last day of any sizeable volume was 24th March, when the rally went into reverse.
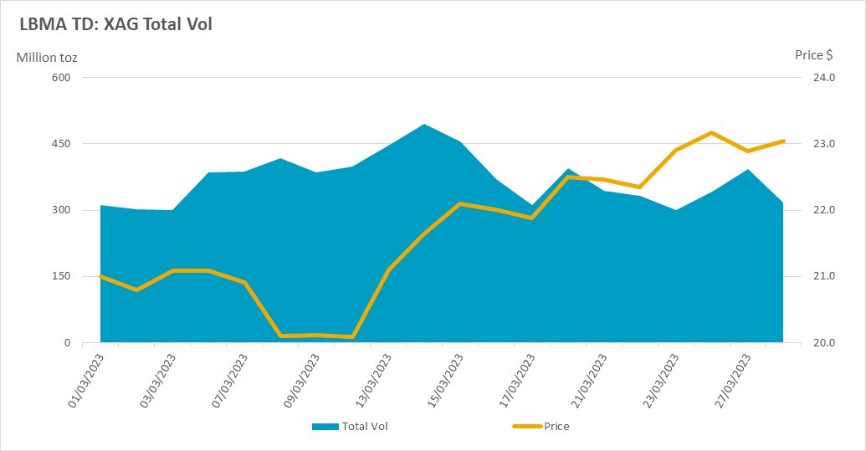
SILVER
Spot volumes, March, tonnes
Source: LBMA, NASDAQ
As noted above, silver very largely followed gold’s action during February, but with wider ranges and, indeed, similar patterns in terms of volume. For parts of 2022 silver had gone its own way but this time the two metals were pretty much in lockstep. All of the elements that applied to gold therefore cascaded into silver, so we won’t repeat what is said above.-
There were heavy spot volumes on 2nd and 3rd February as the price fell from $24.24 to $22.29 and heavy LoanLeaseDeposit (LLD) activity on the 3rd as prices dropped through $23; which could well have been mine-side hedging. As gold partially reversed silver continued to drift lower in light volumes and then loitered in the $22 region for some days, during which time there was a pick-up in activity in the derivatives, especially LLD; if this was forward buying then there would have been some opportunity cost involved as prices slipped lower and continued to slither towards $21.20.
Interestingly one of the very slowest days in spot was a massive outlier in swap/forward, when 206M ounces were traded on 16th in otherwise unremarkable price activity, so there could well have been some pricing activity going on here. Silver attempted a rally towards $22, but volumes were thin in a nervous market that wasn’t sure from where to take its direction.
Volumes picked up smartly in LLD when the price was failing to move above $21 so it is possible here that stake holders were locking in prices, which may have contributed to the failure at this level (along with gold’s lack of direction at this stage). Options were generally sluggish.
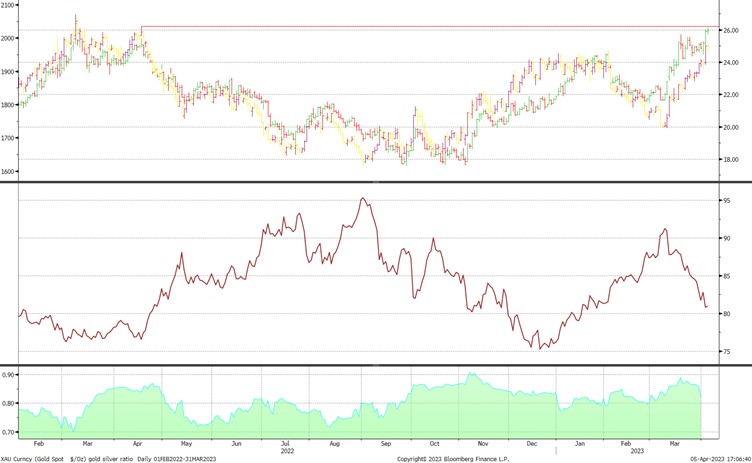
March: silver’s patterns again adhered to those of gold during month when-sentiment, and the forces behind market sentiment, changed. Even the prospect of a possible U.S. recession failed to daunt silver’s renewed spirit as gold’s upward momentum took silver with it. As shown below, the ratio widened during February when both metals were tending lower, but contracted from 91 towards 81 by end-March.
Volume patterns were also similar to those of gold, although the heavy volumes in mid-March dwindled more quickly as gold continued on its risk-on trade and the silver market stood back to take stock of the possible fall-out from banking issues and what that might do for the economy. This is a key difference – silver does remember its industrial characteristics and how they can thwart risk-driven rallies. At the end of the month, though, silver volumes outstripped those of gold in spot and LLD, when silver pushed up towards $243 and failed. In all probability there was opportunistic forward selling on the approach to $24, which may well have helped to squelch the move in spot.
Gold, silver and the ratio, February to April 2023
Source: Bloomberg, StoneX
PLATINUM
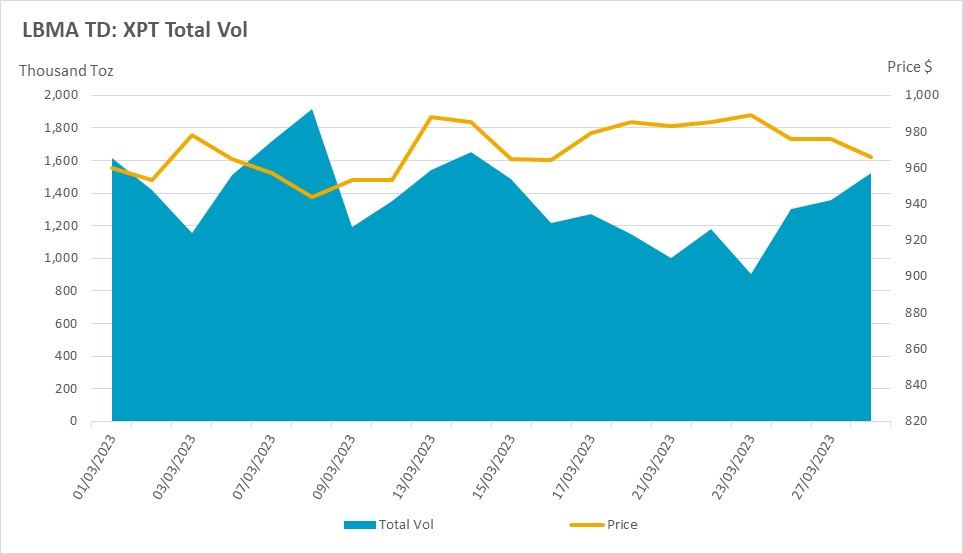
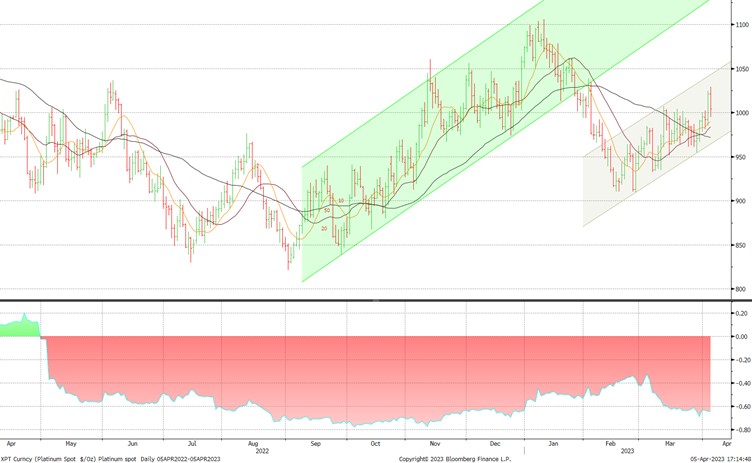
Platinum enjoyed a bull run from September to mid-January, taking spot from a 27-month low at just below $850 to a 10-month high at just over $1,100. By this stage it had run out of momentum, and the downturn continued through towards late-February towards $900. Bargain hunting re-appeared at this point as the automotive sector started to show some signs of life and supply chains eased. The longer-term view was also instrumental, in that the electrification of the vehicle fleet has positive prospects for fuel cells, which use platinum electrodes, and green hydrogen which requires platinum (and iridium) in the hydrolyser into order to produce the gas in question. By end-March $1,000 was under attack and was subsequently breached when the dollar eased in response to weaker U.S. economic numbers, while base metals dropped back at this point. Preferring to look at the fundamental picture, platinum went higher with gold, for the first time in a long time.
Spot volumes, January, tonnes
Source: LBMA, NASDAQ
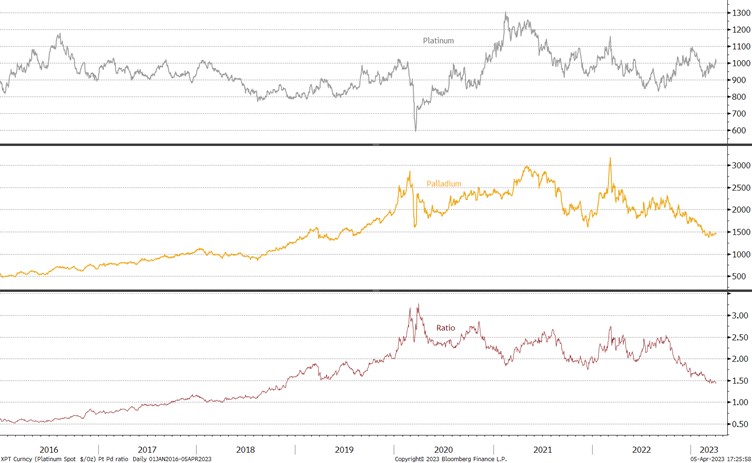
As well as the fundamental shifts in the composition of the auto sector itself, platinum is also benefiting from continued substitution for palladium where possible, in emission control catalysts, which is a legacy from the persistently high palladium:platinum price ratio from 2019 to 2021 (see below).
Platinum spot patterns and correlation with the S dollar, 12-,motnhs
Source: Bloomberg, StoneX
Form the supply side, the problems persist with Eskom in South Africa and load-shedding is expected to persist for much of this year. More than one South African platinum miner has reduced its forward guidance and the market balance is expected to tighten accordingly, which is also affecting sentiment. Arguably these issues are short-term but they have persisted for a good while now and as we write it does not look as if a resolution is near.
The CFTC figures show that Managed Money investors using NYMEX increased their outright long positions steadily for much of February, having bailed out earlier, but interestingly the fresh purchases ran to a close at end-February, while prices continued to rise through March. This is explained by the fact that short-side players, while increasing exposure during February, closed out substantially in March, partly, presumably, as the Eskom issues gained increasing coverage, and partly also on the improvements in the state of the auto sector in Europe and the likelihood that diesel loadings may have will have to rise in Europe between now and mid-2025 under new EU emission control limits.
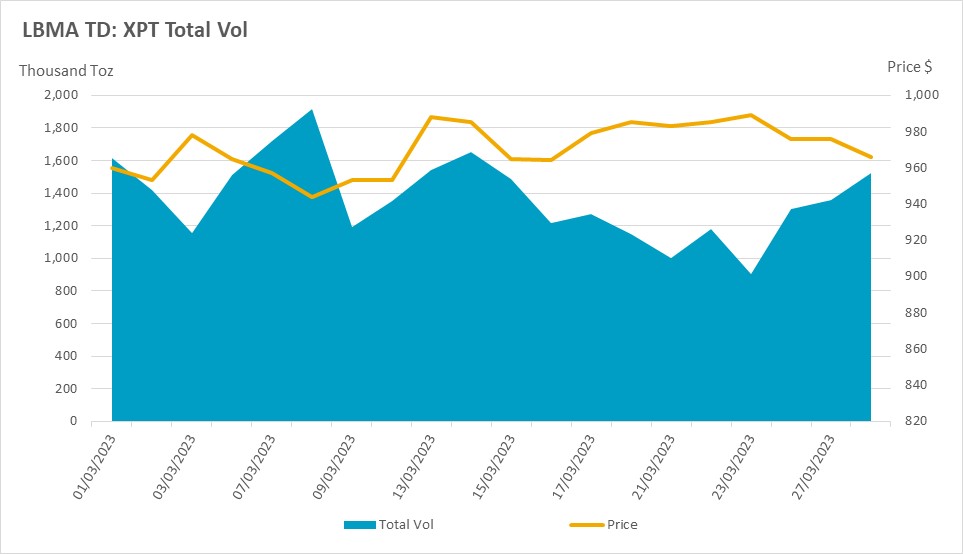
In terms of daily trading patterns, volumes in both options and derivatives were mixed as prices dropped in early February, and then option activity picked up below $950. Spot volumes picked up in the final ten days of February as interest developed and then continued to expand as prices rose further in early March, to test $1,000 in mid-month.
By then the price had not only reached an important psychological level, but this was also the 13th of the month and the industrial markets were taking a hard look at the possible fall-out from banking stresses. Derivative acidity picked up smartly, which suggests risk management as the spot market became nervous and spot volumes evaporated. LLD activity remained relatively lively as prices pushed up towards $1,000, faltered slightly and then picked up again in what looks like defence as the price eased again towards month-end, where the price finished with a new attack on $1,000.
PALLADIUM
Palladium peaked in March 2022 at just over $3,400/ounce and has been on the slide ever since. After a three-month period between June and September when it traded in the $2,000 region the bear market resumed. The year opened at just over $1,800 and was relatively stable for a while, but the falls resumed in mid-January and continued through February to touch a low of $1,350 on 9th March. Since then there has been evidence of industrial bargain hunting, which looks partly like the search for value and partly predicated on a further improvement in the automotive sector.
Spot volumes, January, tonnes
Source: LBMA, NASDAQ
The markets are aware, however, of the fact that while platinum will have some relief from the eradication of the automotive internal combustion engine (ICE) sector over the next 20 years (see above), palladium does not, at least not yet, have any such safety net.
Add this to the fact that palladium is largely a by-product either of platinum mines in South Africa or nickel mining in Russia and therefore its mine supply is not price-elastic because those mine operations will have been designed around the markets for the primary products. Primary palladium supply can’t really be nuanced the way some other metals (apart from silver) can.
Of course there is the issue of loan-shedding in South Africa, and Norilsk is tailoring its output to a minor degree, but the latter company’s production guidance has not been adjusted the way the South Africans’ has.
Platinum, palladium, and the ratio
Source: Bloomberg, StoneX
In trading terms the CFTC numbers show that there has been some nibbling at the market, with outright Managed Money longs rising, on and off, through February and the first half of March, but here, too, an already nervous market reacted badly to the banking sector developments so that the end-March numbers show an outright long of 4.21t, fractionally below the year’s opening of 4.30t. On the other side of the market outright shorts expanded from 15.6t at end-January to 25.4t in early February and while this has now contracted to 22.8t, this is well above the twelve-month average of 9.5t so there is always the possibility of a short-covering rally.
The OTC markets were mixed. Generally volumes were low across the board in the first few days of February but in mid-month forwards and options showed signs of life. This was when the fall was particularly sharp, from $1,680 to $1,440, which suggests some forward selling after the failed attempt to cling on to $1,700, and possibly some puts at $1,700.
Spot picked up over late February through to mid-March, which looks like liquidation followed by bargain hunting. Forwards were busy at the start of the month when prices were holding steady above $1,420. There was very little activity in the derivatives, which suggests renewed uncertainty. In the latter part of March the options market, which had been moribund for most of 2022, was really quite lively during “banking week”, when spot was easing from $1,500 towards $1,400 – this looks as if it, too, was action on the put side of the market.
We finished in quiet conditions with another failed attempt at $1,500, but with signs of fresh industrial interest.