

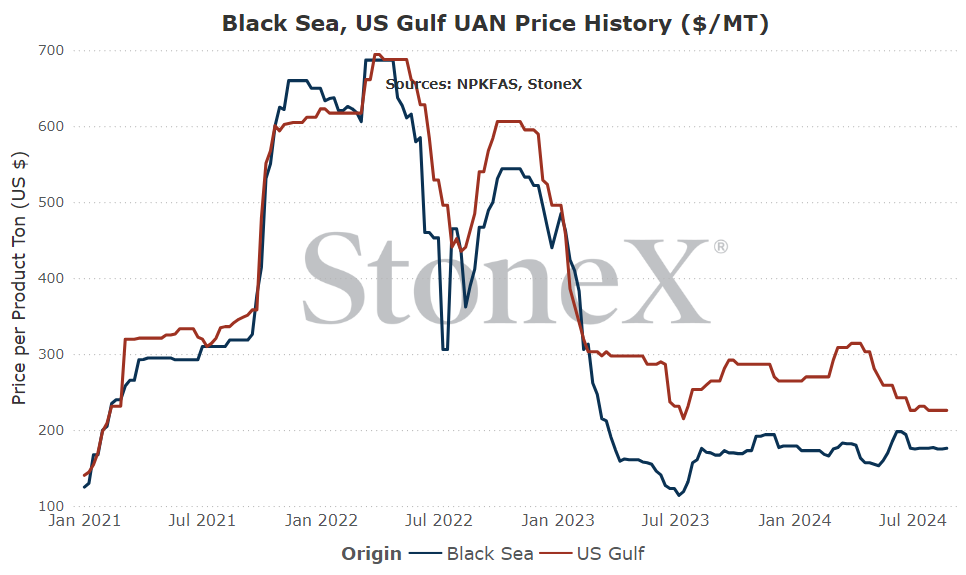
The intention of the below graphs are not to use to say "my price should be X based on this graph". These prices are derived from an FOB price point average. The intent is to show major global price movement trends. Your values will likely have significant basis difference (similar to your local grain price being different than the traded market price).
This graph is labeled as MT in USD currency.
GLOBAL
Honestly, there is not a ton wrong with the world of UAN supplies. Russian exports continue at solid rates. EU production rates continue at 75% of normal, but that is normal and highly expected. Plants are always expected to take some timely turnarounds to make repairs but again, that is factored in each and every year.
However, Trinidad manufacturers having to reduce production rates due to unsteady and unreliable gas supplies was not factored in and does help limit global supplies. It seems like they are near back to normal but is something that needs to be watched.
All that said, UAN continues to look steady...for now. The thing that I am watching is honestly urea. If urea starts to move higher, there is a very real possibility that UAN values track higher with it. Why would that happen? If UAN stayed low price while urea ran up, any demand that could switch would and then that demand wave would force prices higher. That is why there is a tight correlation between the nitrogen sources.
Simply put, short term things appear flat but watch the horizon. If urea breaks higher, UAN is going to try and follow.
Global production update (there are issues...)
As listed in the urea newsletter, there are some production/supply issues around the world. Unlike urea, the UAN list is mostly bad for farmers....
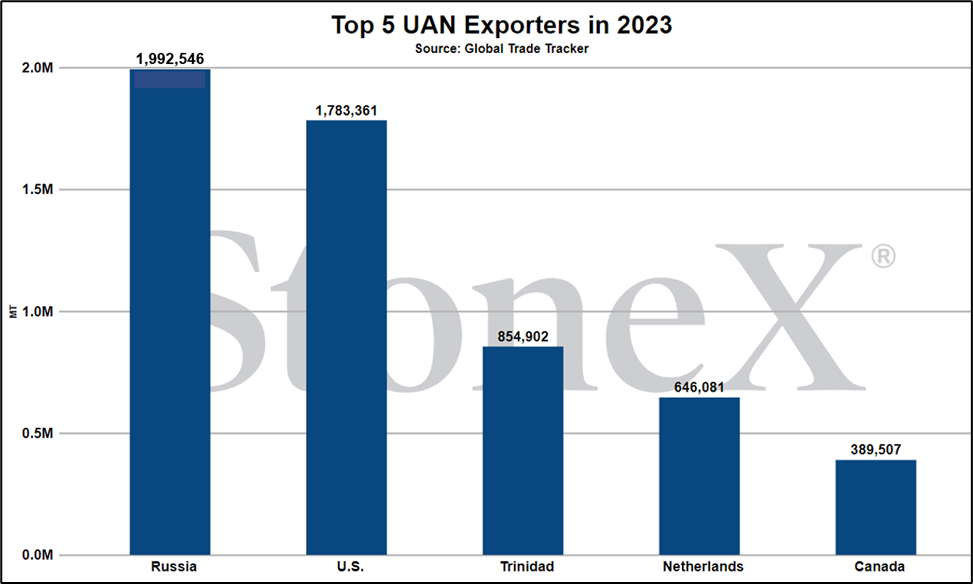
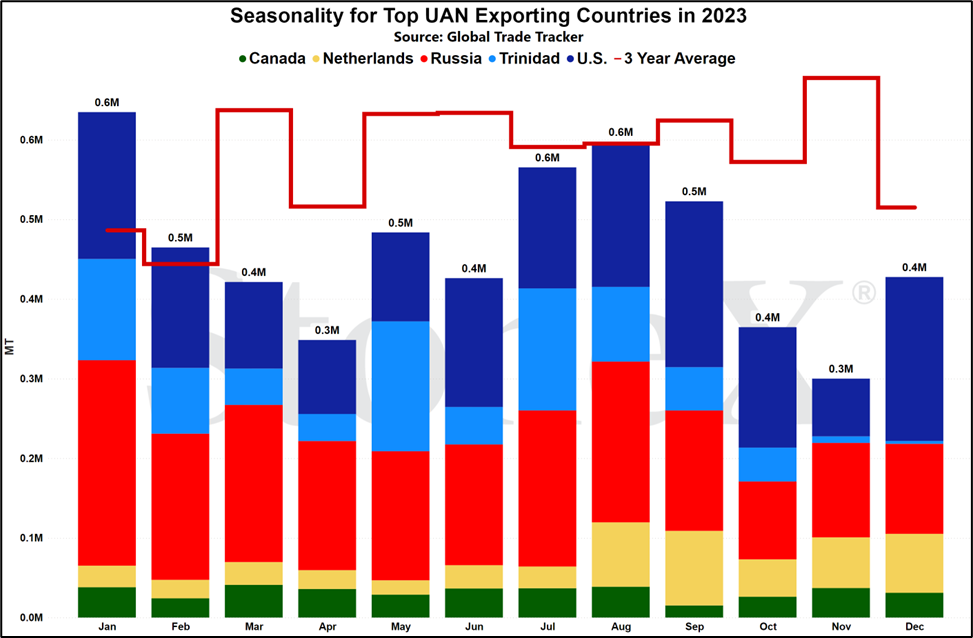
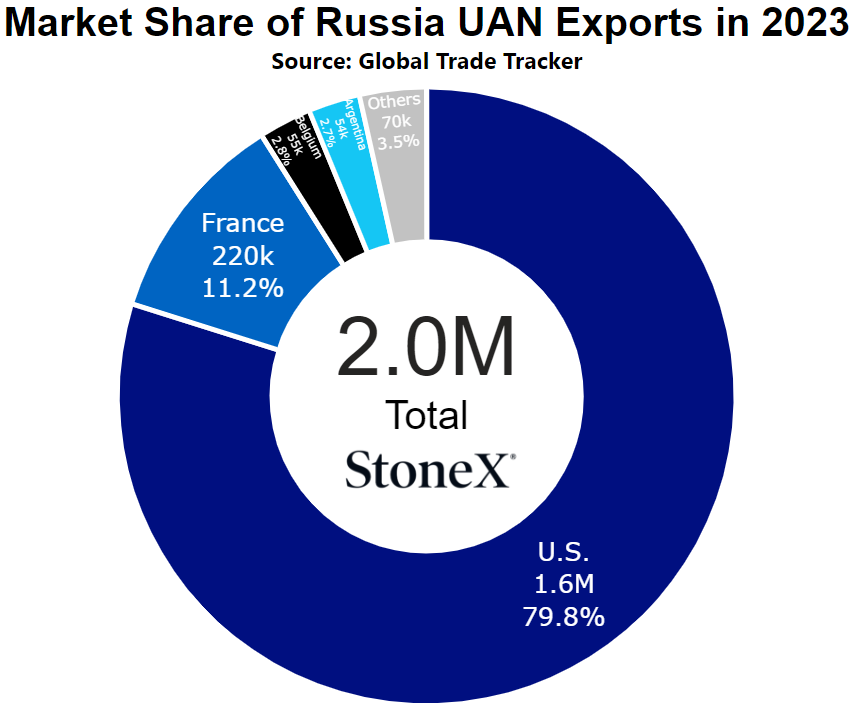
Russia (good for farmers) - actually, Russia stands out as a bright spot in the global UAN marketplace. They continue to export higher than normal volumes and while they are cut from certain markets (Canada/Australia), they are finding enough homes to stay comfortable.
U.S. (bad for farmers)- there have been planned production downtime...and unplanned production downtime. For the planned facilities, both Borger, TX and Pt. Neal, IA saw plants go down for scheduled repairs. This downtime was factored into forecasted markets and everything seems to have gone to plan. Unfortunately, Verdigris, OK saw storms cause damage (reportedly). I say reportedly because information on situations like this are typically thin with the owning company not wanting to give a lot of information. What we have seen were plenty of reports as well as statements from the plant that customers were not to send trucks or expect any deliveries for the short term.
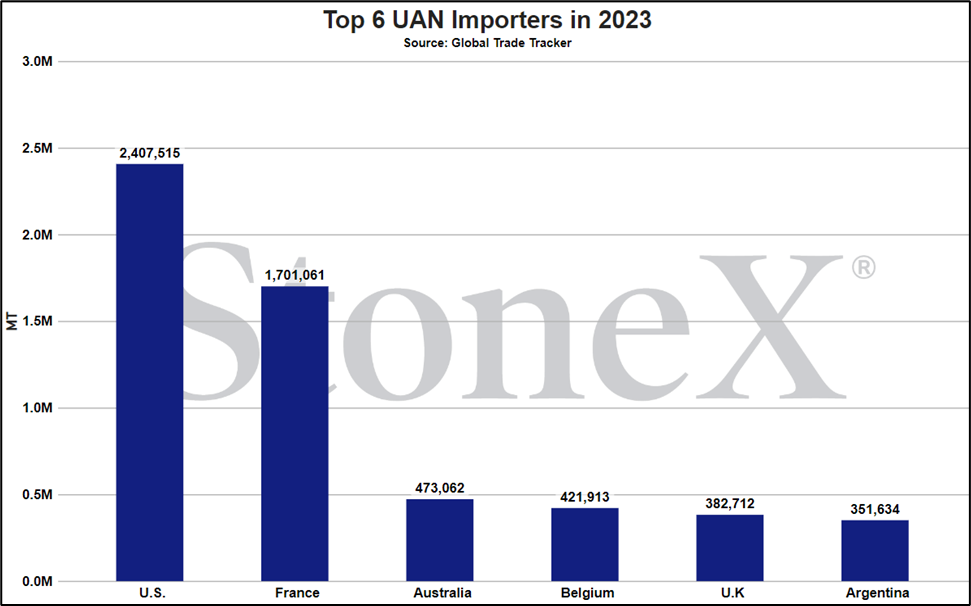
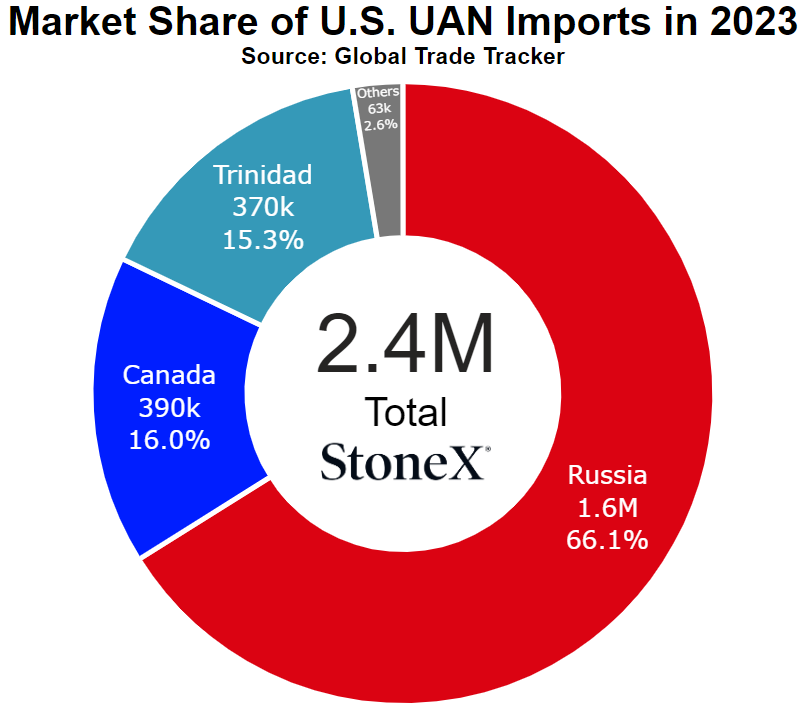
Trinidad (bad for farmers) - gas supply issues has been a story around Trinidad for some time. Fortunately, they recently approved the exploration and development of new territorial waters with the intention of boosting natural gas supplies. This is great...when it happens. It isn't as though these rigs and infrastructure were already in place. It will take time to develop. In the meantime, gas shortages will continue to hamper production rates. Hopefully, the hiccups will be relatively far and few between but when they happen, they dig into expected supplies. In 2023, product flowed to U.S. (43%), France (28%), and Canada (9%). That not only tightens supply availability for these nations but also think about what it means for the U.S. Imports shrink while export opportunities rise.
There are other manufacturers/exporters but those are the main 3 that I track. Good news from the Russian angle but not so good news from the others...
Why does this matter for Australian farmers?
The tighter the supplies, the more easily a price can go higher.
No, it does not guarantee that to be fact. That is especially true today with demand so unwilling to engage the market. However, our 2025 forecast continues to point to relatively even nitrogen demand to 2024. Farm economics suck, but demand should be there.
Hopefully these production hiccups can be solved and we can move forward relatively unscathed but if they continue, supplies are lower with demand level. Econ 101 says prices trend higher in that environment.
...have I mentioned lately to please do not shoot the messenger?!
Market stalemate continues
So there are some supply hiccups in the U.S. and Trinidad but market prices are not moving higher. What gives?
Well, you all!
The biggest story for the last couple months has had less to do with fertilizer directly and more to do with grain prices continuing to fall. There are a lot of younger people in the industry that have not seen grain prices as low as they are today. Not only that, a lot of more mature (...yes, old which I am in) folks got spoiled the last few years. I hate to say it but the last few years have been easy. Everyone was making money and it was easy to make sales. Not perfect, but much easier.
Now, farmers are hoping that they can make enough this year to make payments. When they look to 2025, it isn't much better. So after years of profitability, grain prices have fallen hard while most inputs have held steady. That does not put farmers in a spending mood...and that weighs on the market.
Most folks that I talk with agree that nitrogen demand should remain relatively steady and also that there are production problems but without buyers, it is hard for prices to reflect that. No one wants to try and push it higher in this environment.
So for now, the market continues in a stalemate. This will not last forever. Eventually, buying has to occur. It is possible that demand stays away long enough to impact market pricing, but that would be short lived I'm afraid.
Why does this matter for Australian farmers?
This was a piece stolen from the North American newsletter, but it is pertinent to Aussie farmers.
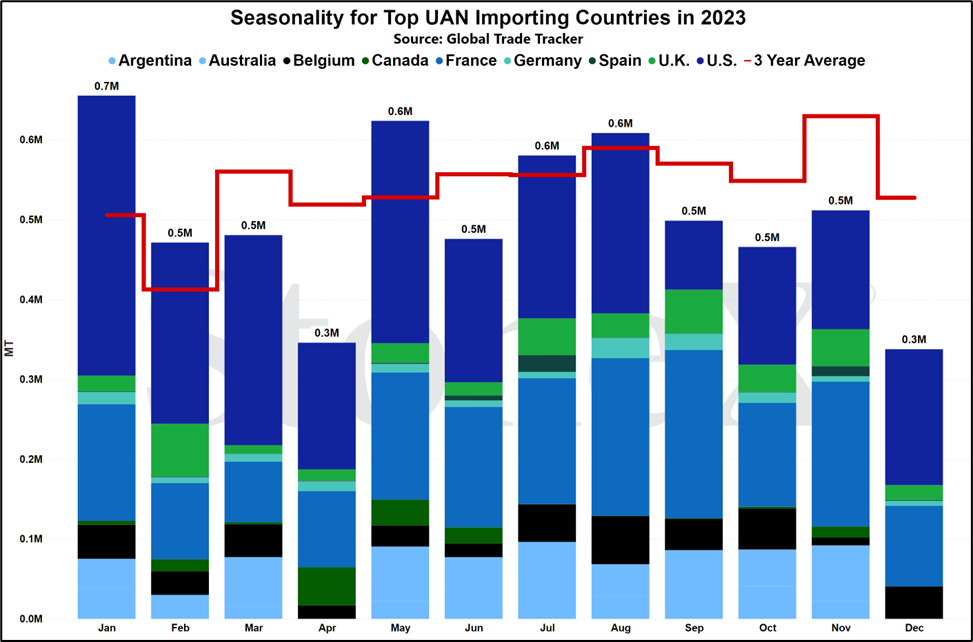
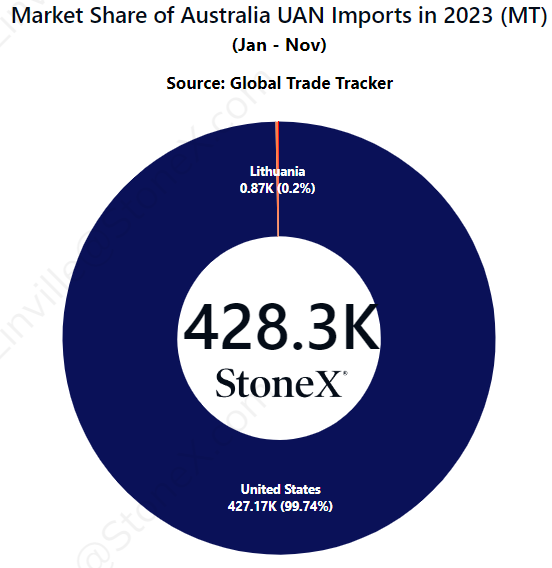
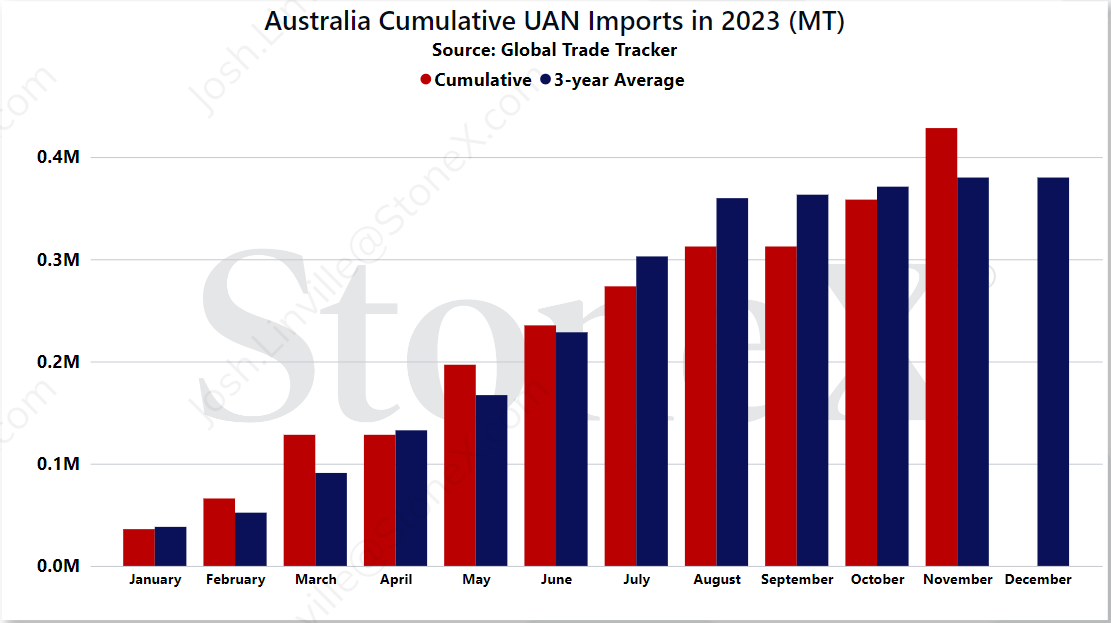
Because Australia is reliant almost solely on the U.S. for UAN supplies, what happens there has an effect here. This story is especially true.
U.S. / N.A. farmers are struggling. Grain values have tanked and income is much lower than what has been normal in recent years. They are holding back on making any purchases. With UAN not needed until April/May of next year, that is especially true...which could be an opportunity for Austrlia.
It behooves U.S. manufacturers to keep their domestic S&D balanced to tight. Most of their tonnages go to that market so if they can keep the price higher, they make money. If unsold inventories start to get high, they can be forced to lower their price to find demand which craters the whole of their biggest market.
So, rather than do that, if you can export product at a lower price, the justification is there. Take a discounted price on some vessels to rebalance the S&D in your biggest market. Sacrifice some boats for your greater good.
UAN prices feel high...but are they
Short answer is yes they are, but they are more in line than they seem!
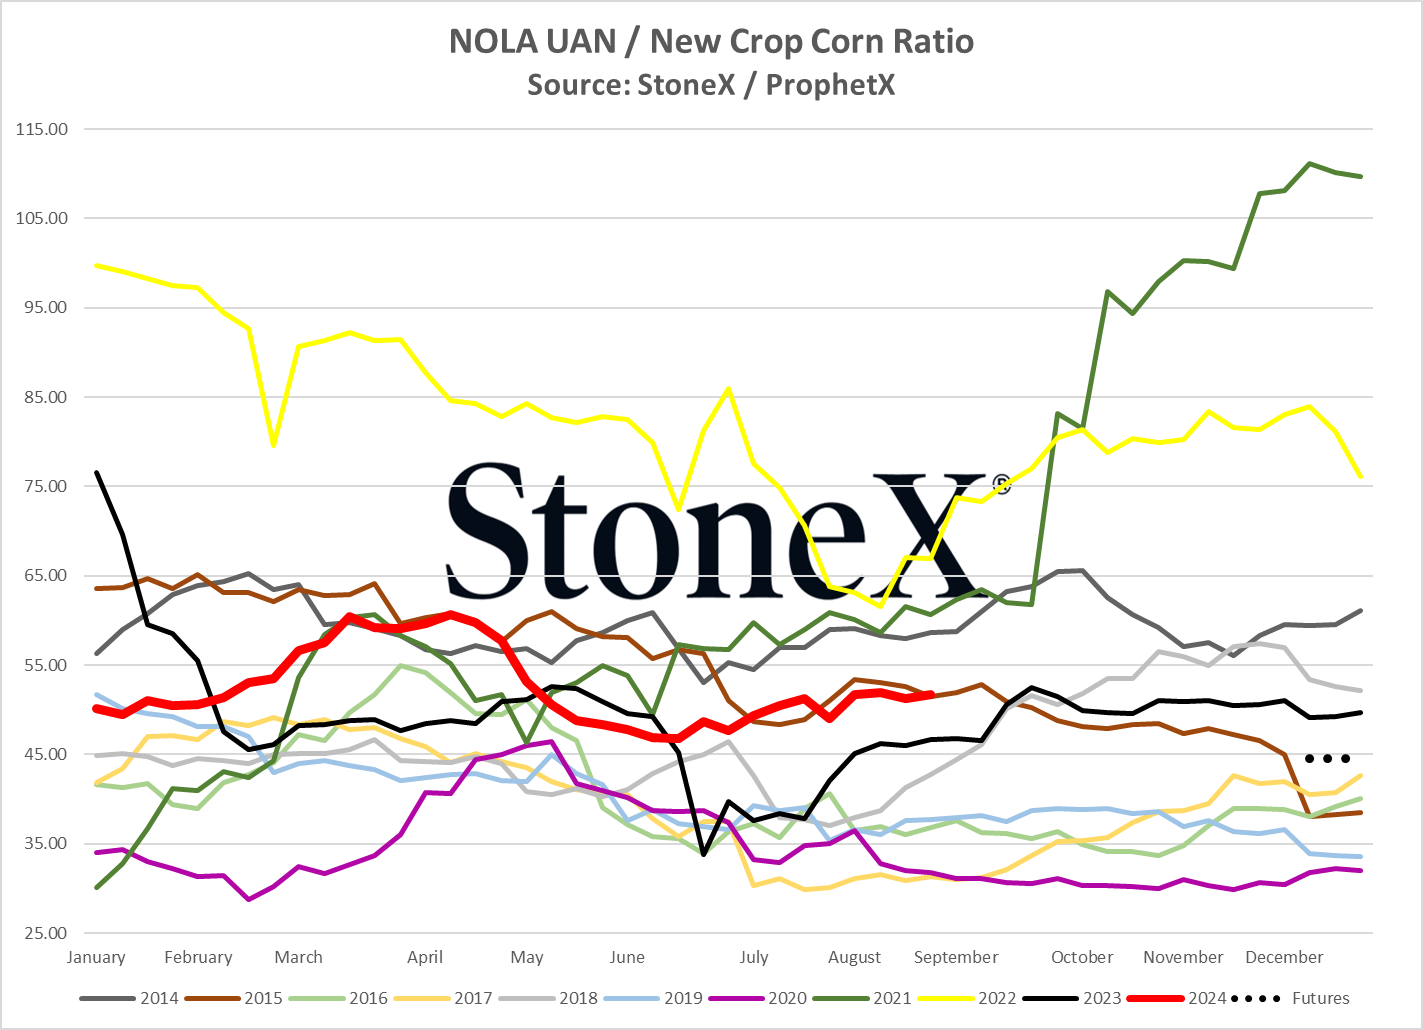
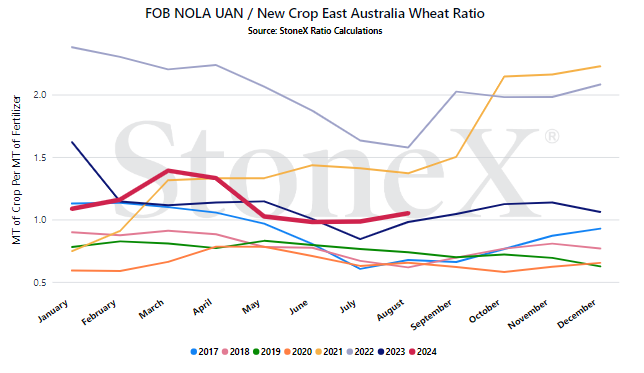
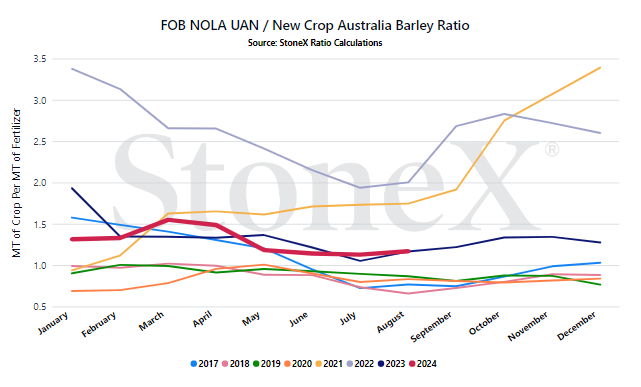
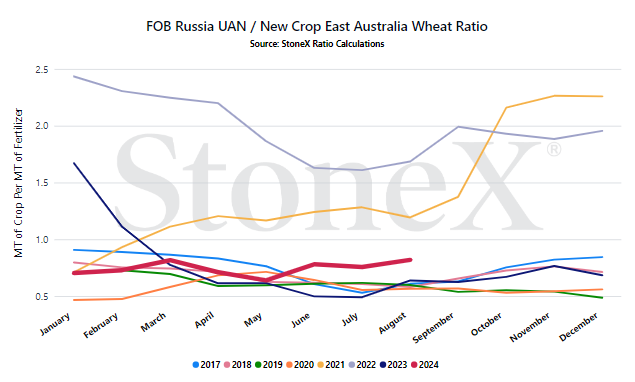
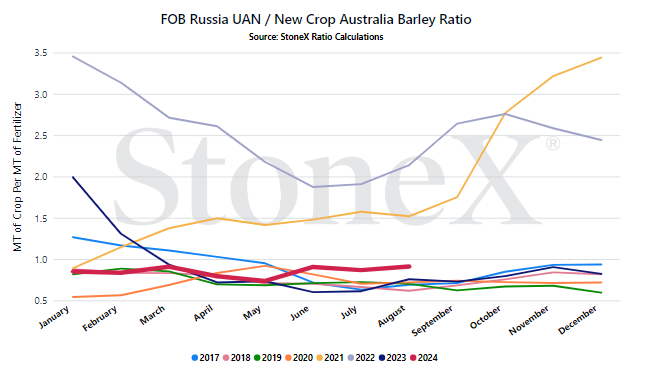
If you have seen any of my stuff, you have likely seen the ratio charts. All these charts do is look at how many bushels of X it takes to pay for 1 ton of fertilizer Y. If only looking at this input/output relationship, the flat prices do not matter (they do on the larger scale). The question becomes "would you rather spend 50 or 80 bushels of corn to pay for 1 ton of UAN". I have yet to have anyone get it wrong. Everyone wants to do the lower number so to me, it is the better indicator of "value".
That said, the first chart below is the NOLA UAN/Chicago New Crop Corn Ratio graph. Now, your numbers will look different. I do not know where everyone is reading this from so I go as high level as I can. Please remember that your charts locally will look different because of basis. I have run this graph back to 2014 to give a decade of history. The larger red line is this calendar year. When glancing, I hope that you will see that while it is certainly on the higher side of the last decade, it is still "in range" of what can be considered normal. It has been much better (look to summer 2023 for recent example), but it has also been worse.
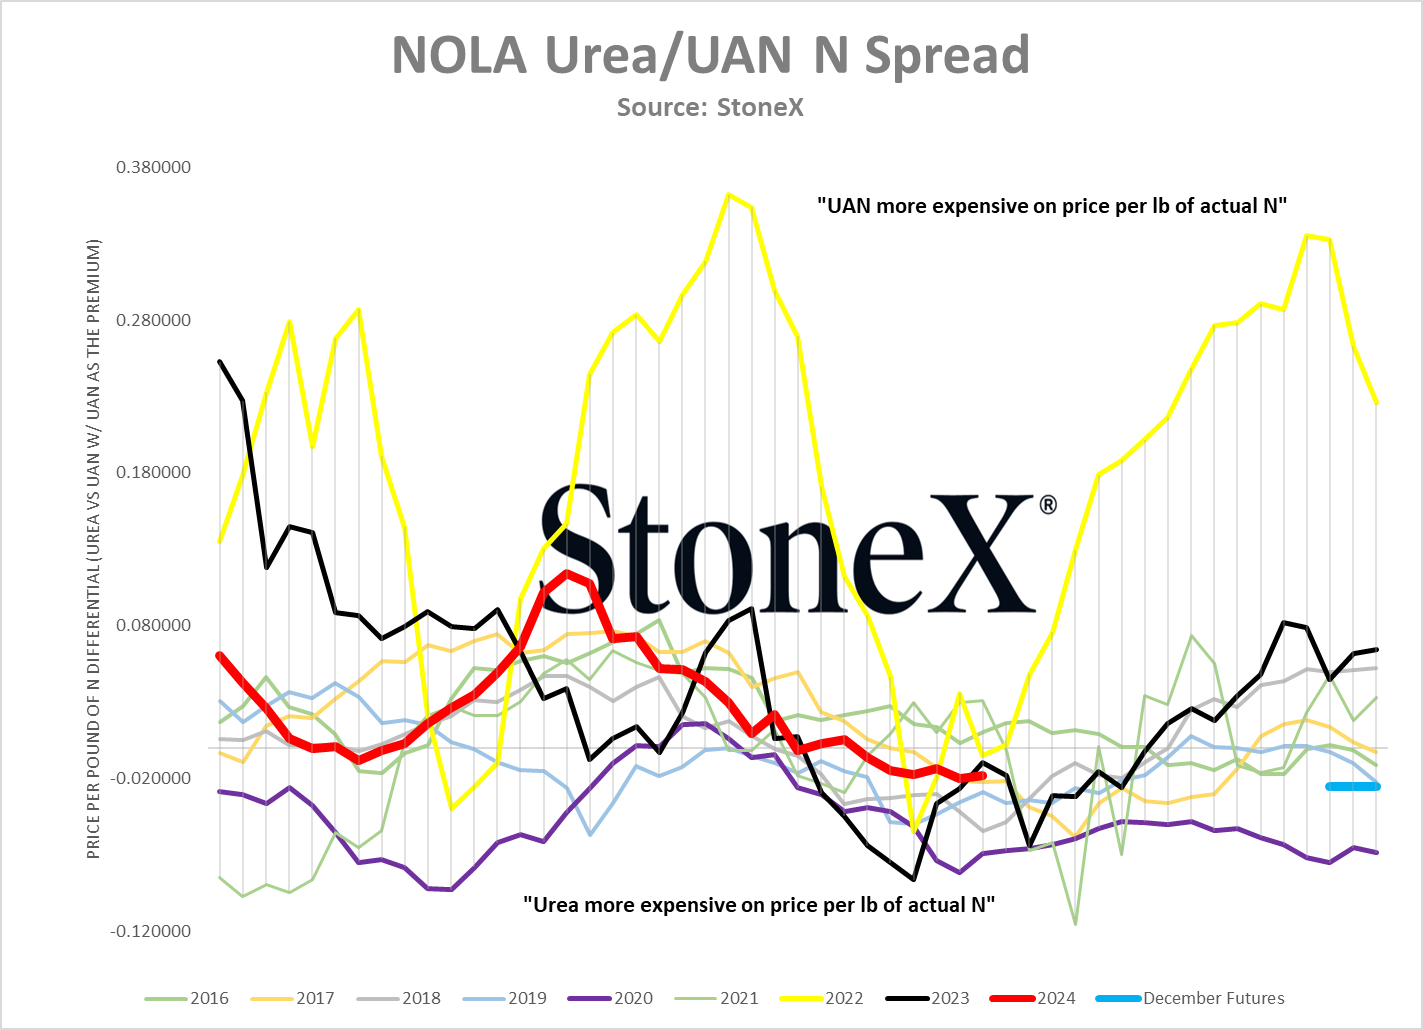
The other comparison is again urea which is shown on the 2nd chart. Again, I am looking at NOLA (New Orleans, Louisiana). I'm trying to stay high level. That chart breaks down urea and UAN to a price per pound of actual N basis because that is what really matters. It then looks at the difference. Anything below the horizontal line means urea is more expensive than UAN. Anything above the horizontal line means UAN is more expensive than urea. Again, UAN is "right priced" vs urea. It isn't a steal, but it isn't overpriced.
I guess I really do not have a "message" for this section or any sort of great ending wisdom. This is more to just show how it is priced relative to some comparisons that I watch. Again, trying to give further insight into the industry.
Why does this matter for Australian farmers?
Again, I stole this from the N.A. version because Aussie farmers need to be aware.
If/when U.S. farmers start purchasing, suddenly manufacturers have less need to export. They get more proud of their price.
It does not look like farmers there are in any rush to spend money today but if they change that approach, it matters here.
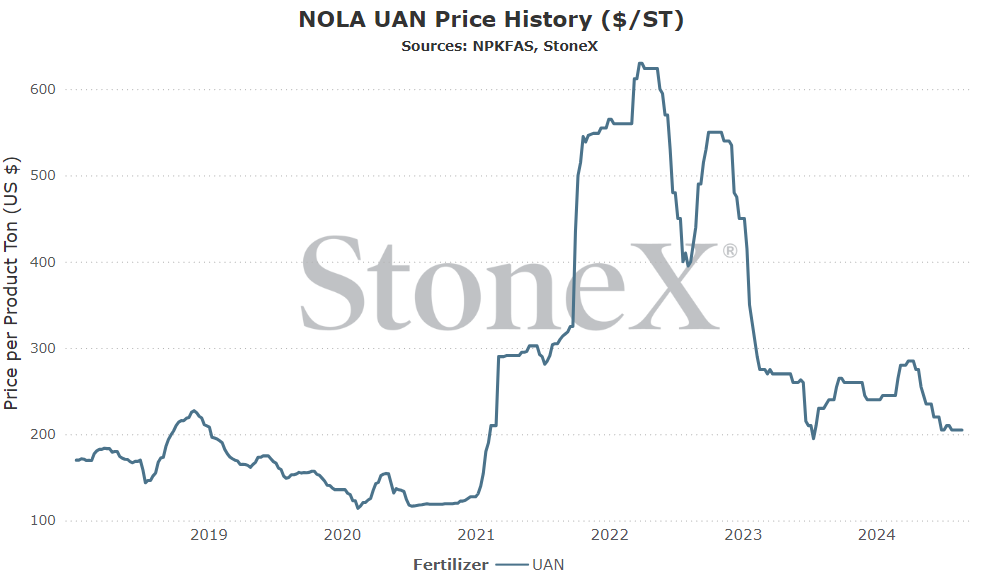
NOLA/New Orleans, Louisiana
Number 2 global importer in 2022
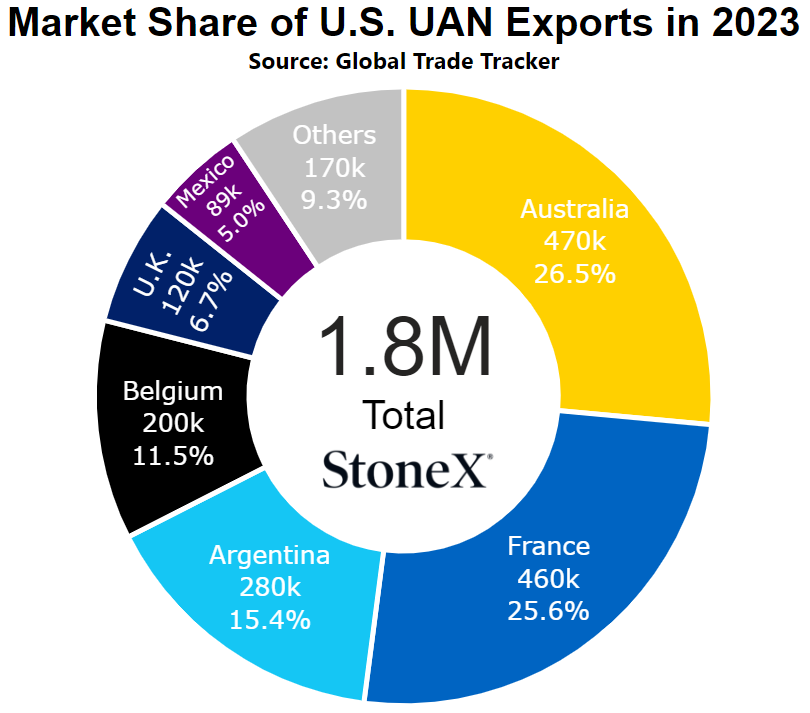
Number 1 global exporter in 2022
Price Comparisons
Vs 30 days ago - unchanged vs last month
Vs 90 days ago - -13% or approximately $30 lower
Vs 6 months ago - -23% or approximately $60 lower
Vs 1 year ago - -15% or approximately $35 lower
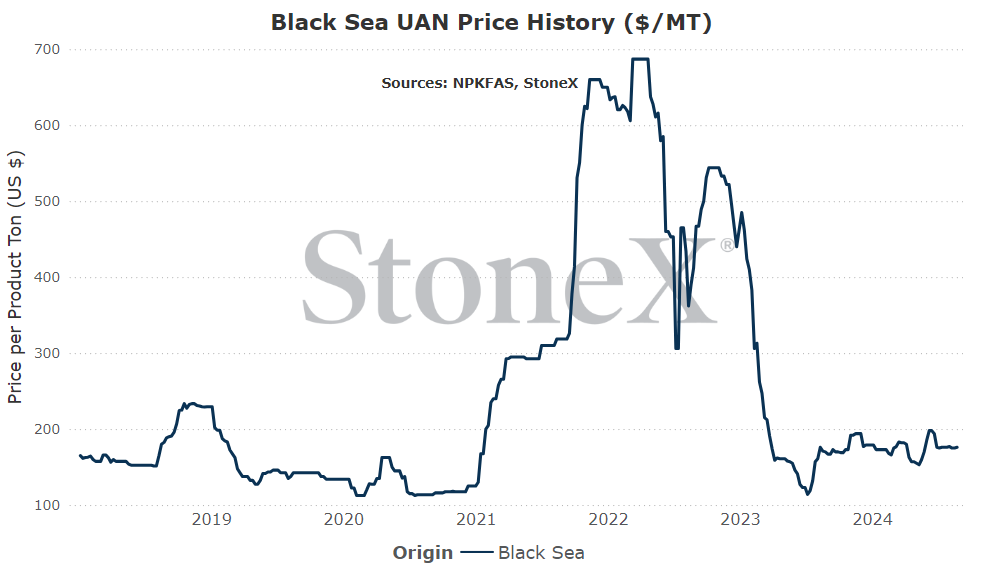
Black Sea (Russia)
Number 2 global exporter in 2022
Price comparisons
Vs 30 days ago - unchanged vs last month
Vs 90 days ago - 4% or approximately $6 higher
Vs 6 months ago - 1% or approximately $1 higher
Vs 1 year ago - 4% or approximately $6 higher
- Trinidad production hiccups hurt supply, could continue in the future – insufficient gas supplies in Trinidad has been an off/on story for a while. Fortunately, new waters have been opened to exploration and development which should mean the future sees much more reliable flows...eventually. But that isn't today. That process takes time and that means until then, further UAN production issues could continue to pop up.
- EU production continues to suffer, creating unnatural buyer – unfortunately, this looks very feasible. Dutch TTF gas values continue to hold with few signs of falling. As a result, EU production rates appear steady at 75% of normal. That means they are still an unnatural buyer in the market that helps certain nations clear "excess" tonnages.
- U.S. government could seek Russian import sanctions – this is especially dangerous for Australia. The government has blocked Russian imports. That has meant Aussie UAN imports coming almost solely from the U.S. If the U.S. blocks Russia as well, manufacturers there have VERY little need to export. In fact, there is a chance that the U.S. government might impose export restrictions if they blocked imports.
- U.S. farmer economics are poor and spring is a long way off – if U.S. farmers are refusing to spend money, that means manufacturers there start building unsold inventories. They can withstand that...to a point. After a while, they are forced to put out a value that buyers will step forward for. It is in their best interest to keep those unsold stockpiles/tanks low. That is where Australia can come in as a relief valve.
- Russian imports continue to balance U.S. exports – as long as Russia continues to push UAN into the U.S., U.S. manufactures will continue to export to balance the S&D which is a benefit to Australian farmers.
- I am struggling with a 3rd bearish factor – you know I do not like doing this but I am struggling with a convincing, actually possible 3rd bearish factor. I am really hoping I can come up with something before I publish this...
We believe that only looking at the flat price of either grains or fertilizer can be misleading:
-
Only selling grain can hurt you if fertilizer prices rise substantially
-
Only buying fertilizer can hurt you if grain prices fall
We look at the ratio "value" to get a better indication of where we are or how many bushels of X does it take to pay for 1 ton of fertilizer.
Would you rather:
-
Spend 100 bushels to pay for 1 ton of UAN
-
Spend 60 bushels to pay for 1 ton of UAN
When we compare the current ratio value against recent years, we start to see if we are high or low.
YOUR VALUES MAY LOOK DIFFERENT
This graph looks at the NOLA UAN price vs the flat grain price. There are no logistics on either product. Your location will look different due to fertilizer logistical costs, grain basis, etc.
- Remember that even though things are calm now, they can get out of hand still - how the hell can it get worse?! I'm guessing that is the thought going thru your mind right now!!! There are still plenty of avenues to worse conditions for urea. Iran attacks Israel. Russia escalates against Ukraine. China invades Taiwan. Any/all of these possibilities have the ability to really mess up the market. It can get worse.
- There is plenty of time between now and demand time...but not forever - right now there isn't a lot of reason to panic on needing anything for most. However, time goes fast (faster by the year it seems). Do not lose sight of the markets because the next round will be here before we know it.
- Watch the politics (globally) - Australia/Canada continues to block Russia, which is a benefit to the U.S. U.S. could block Russia, which would hurt U.S./Canada/Australian farmers. Today, politics is playing far to large a role in global fertilizer trade...and it can/probably will continue to change.
StoneX Ratio Calculation
The ratio calculation is derived from Bloomberg historical grains values as well as fertilizer values from StoneX, NPKFAS, and Argus.
The calculation is simply dividing the fertilizer price by each grain price.
All data was sourced from StoneX unless otherwise noted.




