

FX Weekly Overview (Brazil Issue)
Dollar to reflect US economic data, Central Bank minutes, inflation in Brazil, and the Middle East

Leonel Mattos
- Currencies
Quarterly Commodities Outlook is available for free now. Download your report →
By: John Kicklighter, Head of Market Research
Another week of volatility shook US markets, this time leaving the S&P 500 and other major indices at the floor of their congestion bands. The ‘risk off’ pressure is bleeding US asset premium, but what happens after holiday conditions pass?
Talking Points:
The frequency of tremors in the market are increasing. That is not a favorable sign for the health for the 10-month bull trend that the major US indices managed to sustain since mounting a recovery after the Liberation Day tariffs walk back. This past week, we experienced yet another swell in volatility - the third such intra-week about face in 2026 – but it once again fell short of the critical threshold of a decisive technical break in the loaded charts, much less a spillover to other major representative markets of the ‘risk appetite’ orientation. This time around, the S&P 500 ended out the week anchored to the floor of its extended congestion pattern, defined by a six-month trendline support and the 100-day simple moving average.
Notably, the previous two swoons (Tuesday, January 20th and Thursday, February 5th) managed a substantial recovery before the weekend liquidity drain. While the proximity to a chart cliff will raise some anxiety, the holiday conditions will perhaps further ward off a critical breakdown. Both the US and Chinese markets will be offline to start next week; but a little more time off doesn’t exactly protect the market from speculative fallout if an overt fundamental threat were to arise.
Chart of S&P 500-to-VEU ETF Ratio with 8-Week Rate of Change (Weekly) 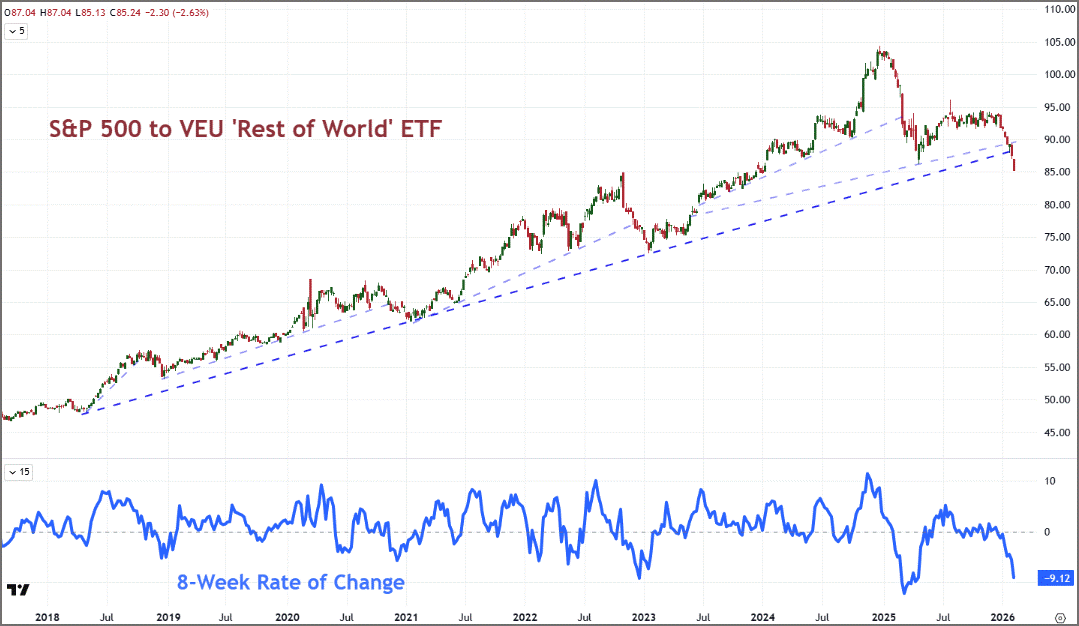
Source: TradingView.com; Standard & Poor’s; John Kicklighter
Historically, the 8th calendar week of the year has averaged a modest loss from the S&P 500 over the past century. That said, the dispersion of those instances or performance ranges widely. Far more consistent is the drop in volume for the benchmark, which we can adapt to as a market factor. A drain in participation can lend to extremes in price action. During the height of holiday conditions, if there is a fundamental shock weighty enough to override broader inertia, there can be to a sharper move in price action that stalls out more quickly. Otherwise, the carry over of a quieter environment can undercut nascent moves – which we have already struggled to establish before liquidity was an issue. Again, that does not mean it is impossible to establish traction, rather the threshold is set higher.
As such, looking for a more robust signal of commitment to a systemic view would be even more helpful in the immediate future than it might have otherwise been previously. In practical terms, conviction may need to hold out for more than a break of the S&P 500 below 6,800 and/or a charge in the VIX above 25. I find a broader alignment to risk aversion (or risk appetite if we hold bullish) with more productive moves and higher correlation across the spectrum of risk-sensitive assets more often reflects a deeper motivation.
Chart of S&P 500 Performance and Volume by Calendar Week 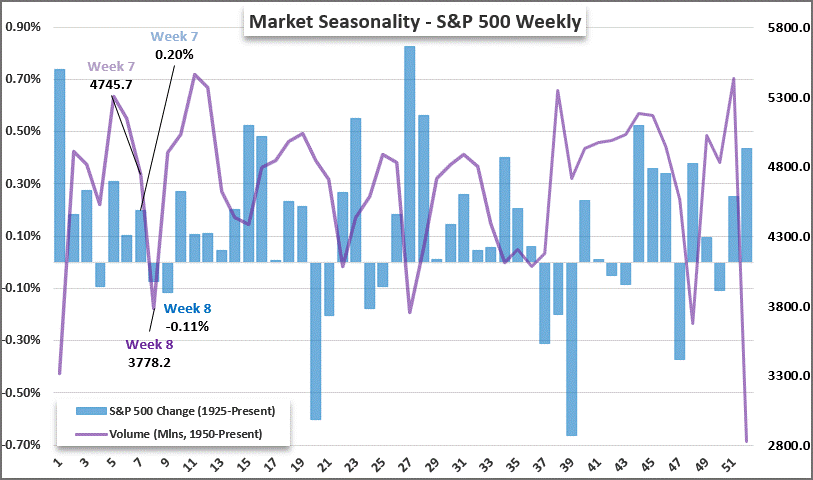
 Source: John Kicklighter; Standard & Poor’s
The week ahead is not well tuned for responsiveness to scheduled event, nor is the docket well stocked for high profile fodder. With the difficult backdrop of consolidating risk trends compounded by seasonal restraint, it is important to set expectations for known catalysts against a reasonable probability spectrum. There doesn’t seem to be a single event on tap that reasonable carries the heft to unilaterally dictate global risk trends. Without something on the scale of influence of say a controversial FOMC rate decision, we are more likely to see a localized market impact (either asset and/or region) or an abbreviated charge for the wider sentiment spark.
Calendar of Top Global Macro Event Risk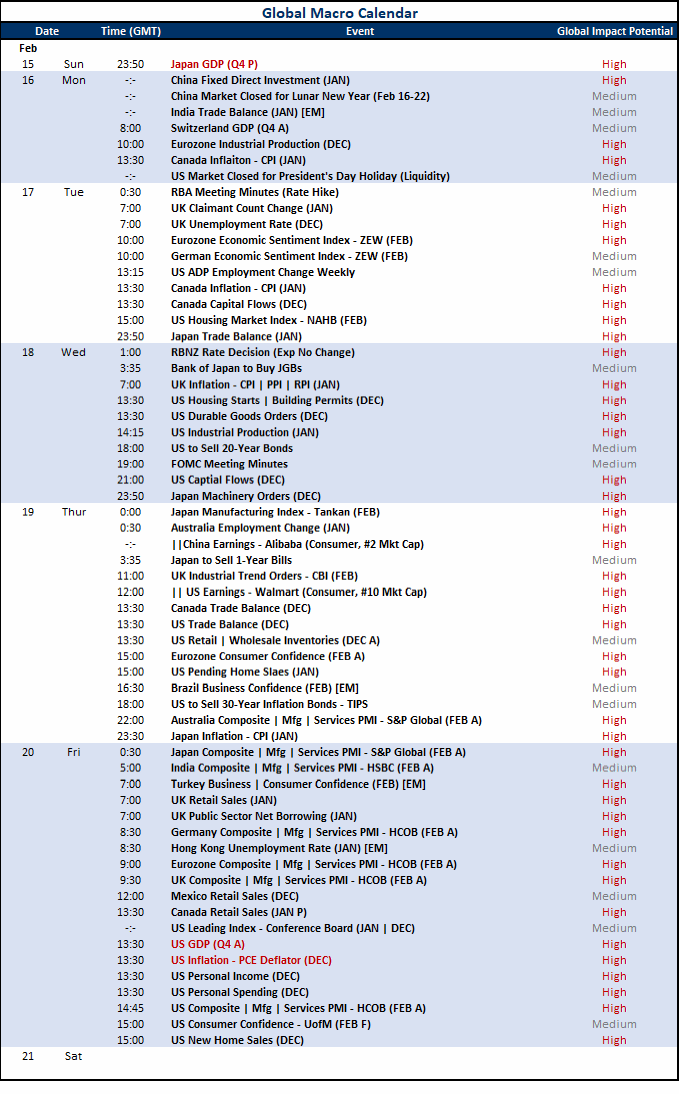
Source: John Kicklighter
Regionally, there are a few major economies with a heavily populated docket, but Japan arguably has the most impressive calendar of the ‘majors’. It starts off with a headline-worthy release of the advanced reading of Japan’s Q4 GDP. The world’s fourth largest economy by GDP is expected to recovery from a steep contraction in the previous quarter to the tune of a 0.5 percent quarter’s growth and a 2.0 percent year-over-year expansion. Scenario analysis for different possible outcomes likely finds a disappointment to carry substantially more weight than a ‘beat’.
Moving forward in the week, Japan’s January trade balance is projected to deliver a steep deficit anticipated at the beginning of calendar years – though it would remind of other fundamental pressure points the country faces. Thursday morning provides an update on manufacturing activity via December orders and the February Tankan sector report. Finally, Friday will provide both the last month’s CPI reading for Bank of Japan (BOJ) fodder as well as the Standard & Poor’s PMI for a timely economic health reading.
Chart of Nikkei 225 Overlaid with 3 Month – 10 Year JGB Yield Spread (Weekly)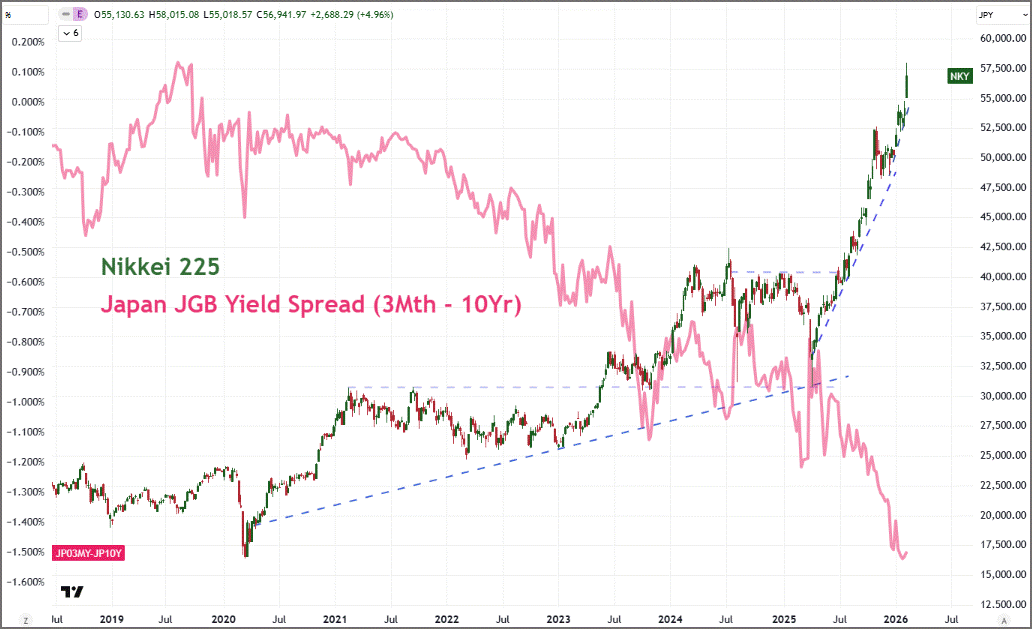
Source: TradingView.com
In a very different vein to the traditional global macro event listings, the waning earnings season will provide us with a very particular update in the spectrum of corporate performance. While we should reserve some attention for the number one market cap release the following week – Nividia – the combination of Walmart’s and Alibaba’s quarterly performance Thursday morning will offer an important comprehensive and competitive update. China’s consumer tech company is the nation’s second largest by market cap but it is the most indicative when it comes to domestic consumption trends – an increasingly critical node of economic contribution given the uneven backdrop for trade.
Where China is struggling to shift its dependency from external demand to domestic consumption, the United States’ status quo is one in which its own citizens’ appetite represent the major of its economic performance currently. For that reason, Walmart’s corporate performance may represent far more of the world’s largest economy than any of the large tech or bank names we have registered in previous weeks.
Chart of USDCNH Overlaid with Walmart-Alibaba Ratio (Daily)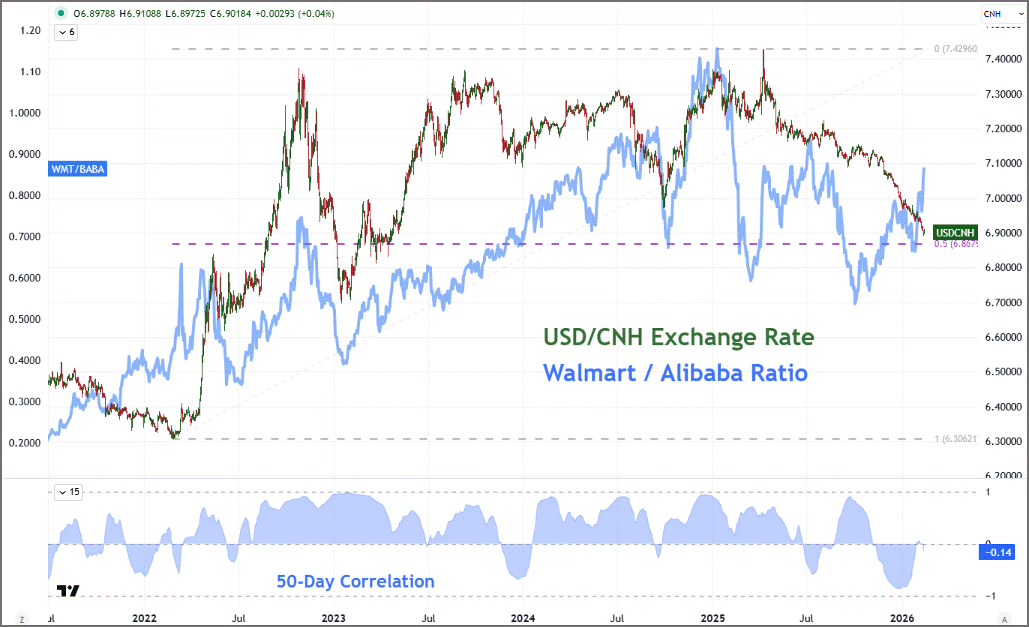
Source: TradingView.com; John Kicklighter
In a final prioritization of scheduled event risk, the US docket deserves more than just an honorable mention. This calendar hosts event risk that could materially alter key economic themes for the largest economy and market. Tuesday offers the NAHB housing market index, Wednesday durable goods and industrial production, Thursday the trade balance and Friday the Standard & Poor’s PMIs for February. All of that considered, it is the combination on Friday of the advanced reading of Q4 GDP and the December PCE deflator that represents the most important update.
For the economic activity report, we have a dated – even more so due to the government shutdown – report, but it is also the official mile marker for activity. As for the PCE deflator, it is the Fed’s favorite inflation indicator – though it is dated relative to the CPI release we received this past week. Controversy from the PCE in any pick up will likely to deflated by the belief that it will be overridden by the more timely BLS reading. Nevertheless, if we are tracking key matters such as the Fed’s likely path for monetary policy through 2026, this is data not to be overlooked.
Chart of DXY Dollar Index Overlaid with Implied FOMC Cuts Through 2026 (Daily) 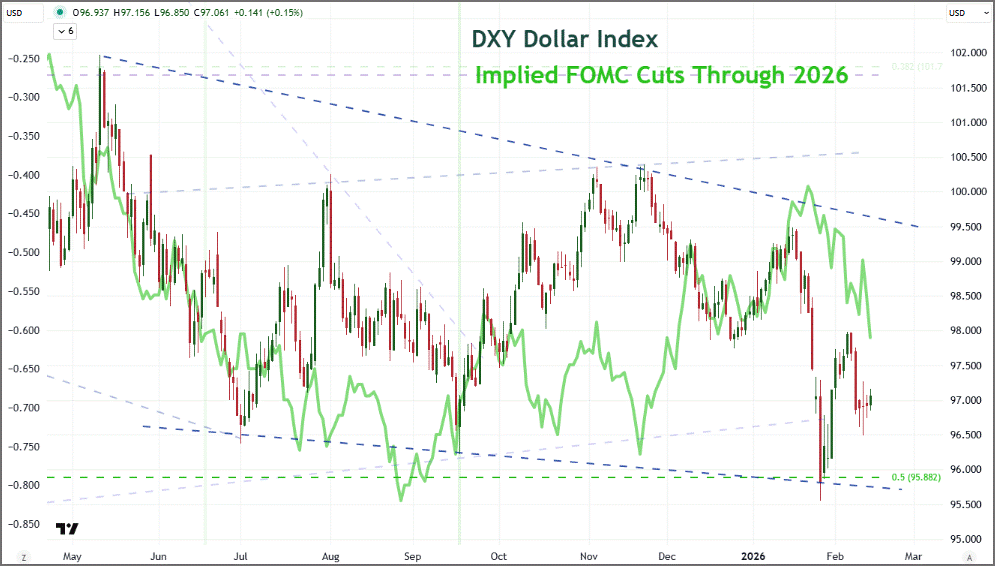
Source: TradingView.com; ICE; CME
Stay connected to timely global macro analysis designed to help market participants navigate shifting economic conditions and evolving risk. Gain access to regular market commentary, updated quarterly forecasts, a comprehensive two-week forward economic event calendar, and specialized tools built to support informed trading and risk management decisions.
-- Written by John Kicklighter, Global Head of Content
© 2026 StoneX Group Inc. all rights reserved.
The subsidiaries of StoneX Group Inc. provide financial products and services, including, but not limited to, physical commodities, securities, clearing, global payments, risk management, asset management, foreign exchange, and exchange-traded and over-the-counter derivatives. These financial products and services are offered in accordance with the applicable laws in the jurisdictions in which they are provided and are subject to specific terms, conditions, and restrictions contained in the terms of business applicable to each such offering. Not all products and services are available in all countries. The products and services offered by the StoneX
Group of companies involve risk of loss and may not be suitable for all investors. Full Disclaimer.
This content is not intended for residents of any particular country, and the information herein is not advice nor a recommendation to trade nor does it constitute an offer or solicitation to buy or sell any financial product or service, by any person or entity in any jurisdiction or country where such distribution or use would be contrary to local law or regulation. Please refer to the Regulatory Disclosure section for entity-specific disclosures.
No part of this material may be copied, photocopied or duplicated in any form by any means or redistributed without the prior written consent of StoneX Group Inc. The information herein is provided for informational purposes only. This information is provided on an ‘as-is’ basis and may contain statements and opinions of the StoneX Group of companies as well as excerpts and/or information from public sources and third parties and no warranty, whether express or implied, is given as to its completeness or accuracy. Each company within the StoneX Group of companies (on its own behalf and on behalf of its directors, employees and agents) disclaims any and all liability as well as any third-party claim that may arise from the accuracy and/or completeness of the information detailed herein, as well as the use of or reliance on this information by the recipient, any member of its group or any third party.
The subsidiaries of StoneX Group Inc. provide financial products and services, including, but not limited to, physical commodities, securities, clearing, global payments, risk management, asset management, foreign exchange, and exchange-traded and over-the-counter derivatives. These financial products and services are offered in accordance with the applicable laws in the jurisdictions in which they are provided and are subject to specific terms, conditions, and restrictions contained in the terms of business applicable to each such offering. Not all products and services are available in all countries. The products and services offered by the StoneX Group of companies involve risk of loss and may not be suitable for all investors. Full Disclaimer. This content is not intended for residents of any particular country, and the information herein is not advice nor a recommendation to trade nor does it constitute an offer or solicitation to buy or sell any financial product or service, by any person or entity in any jurisdiction or country where such distribution or use would be contrary to local law or regulation. Please refer to the Regulatory Disclosure section for entity-specific disclosures. No part of this material may be copied, photocopied or duplicated in any form by any means or redistributed without the prior written consent of StoneX Group Inc. The information herein is provided for informational purposes only. This information is provided on an ‘as-is’ basis and may contain statements and opinions of the StoneX Group of companies as well as excerpts and/or information from public sources and third parties and no warranty, whether express or implied, is given as to its completeness or accuracy. Each company within the StoneX Group of companies (on its own behalf and on behalf of its directors, employees and agents) disclaims any and all liability as well as any third-party claim that may arise from the accuracy and/or completeness of the information detailed herein, as well as the use of or reliance on this information by the recipient, any member of its group or any third party.
© 2026 StoneX Group Inc. all rights reserved.
Our subscribers have access to comprehensive market analysis from StoneX spanning commodities, equities, currencies and more.
Dollar to reflect US economic data, Central Bank minutes, inflation in Brazil, and the Middle East

US indices have led sentiment to fresh highs this past week even as the fundamental backdrop struggles to present a solid foothold. Will thin liquidity aid or hamper the swell and what does the event risk ahead propose?


A softer run of U.S. data is doing more to move the U.S. dollar than any chart, with a jobs report and an inflation print set to land back to back. A cooler U.S. CPI report would hand the Federal Reserve room to ease, and that prospect is already loosening the dollar's grip.

Our market expertise, advanced platforms, global reach, culture of full transparency and commitment to our clients’ success all set us apart in the financial marketplace.
Reach
With access to 40+ derivatives exchanges, 180+ foreign exchange markets, nearly every global securities marketplace and numerous bi-lateral liquidity venues, StoneX’s digital network and deep relationships can take clients anywhere they want to go.
Transparency
As a publicly traded company meeting the highest standards of regulatory compliance in the markets we serve; our financials and record of accomplishment are matters of public record. StoneX’s commitment to “doing the right thing over the easy thing” sets us apart in the industry and helps us build respect, client trust and new partnerships.
Expertise
From our proprietary Market Intelligence platform, to “boots on the ground” expertise from award-winning traders and professionals, we connect our clients directly to actionable insights they can use to make more informed decisions and achieve their goals in the global markets.