Below, our analyst team highlights our top surprises from 2025 – read on to help you prepare for the new trading year!
EUR/JPY: 2025’s Biggest Surprise – The Great Short That Wasn’t (Matt Simpson)
This time last year, I genuinely thought EUR/JPY was set up for a bearish 2025. The European economy looked weak enough to justify multiple rate cuts from the European Central Bank, while the Bank of Japan appeared primed to hike rates to levels not seen in decades. This was exactly the kind of policy divergence currency traders look for, with the added tailwind of yen demand amid expectations of a volatile first term for US President Donald Trump.
From a technical perspective, EUR/JPY was on track to print a shooting star on the yearly chart, while a loose head-and-shoulders formation appeared to be developing on the monthly chart. Taken together, it looked like a clear recipe for a materially weaker EUR/JPY.
Why EUR/JPY Looked Set for a Bearish 2025
At the macro level, the setup appeared straightforward. Europe’s growth outlook was deteriorating, inflation pressures were easing, and markets were positioning for an extended ECB cutting cycle. Japan, by contrast, was finally emerging from decades of ultra-loose policy, with traders expecting the BOJ to normalise rates more aggressively.
Technically, the warning signs were also there. A potential shooting star near long-term resistance suggested exhaustion, while the developing head-and-shoulders structure pointed to downside risk if support gave way. With fundamentals and charts aligned, the bearish EUR/JPY case looked compelling.
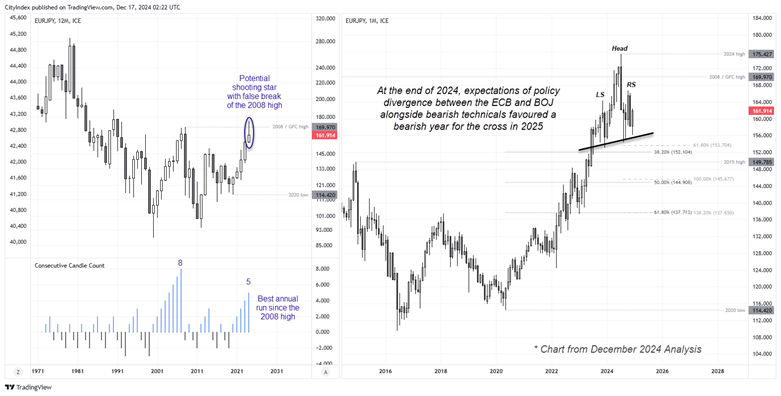
Chart analysis by Matt Simpson - data source: ICE, TradingView
2025 Had Other Plans for EUR/JPY
Instead, EUR/JPY is up 13.3% year to date at the time of writing — or nearly 20% from the February low — proving that view decisively wrong. Not only has the cross risen for a sixth consecutive year, 2025 has been its strongest year in 12, and it now trades just 2% below its 1990 high.
So what went wrong? The macro logic wasn’t entirely flawed, but the intensity and market impact were misjudged. The short EUR/JPY thesis looked promising in Q1, with long yen positions surging on expectations of a hawkish BOJ. In reality, the central bank has only just hiked rates to 0.75% in recent weeks — well short of the multiple hikes traders were positioned for a year ago. At the same time, the ECB proved less dovish than expected, helping underpin the euro.
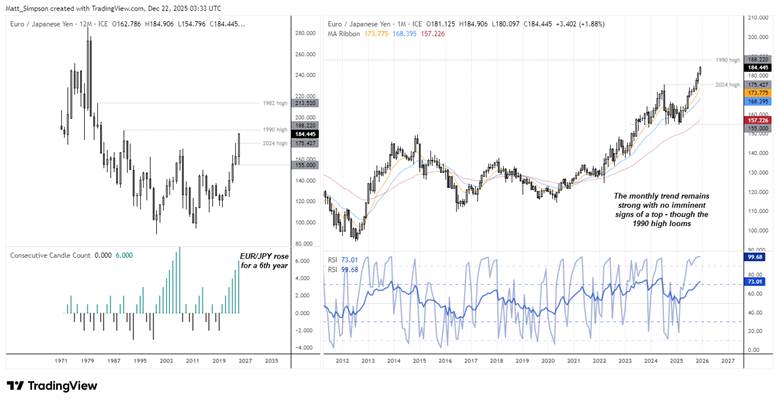
Chart analysis by Matt Simpson - data source: ICE, TradingView
Trump’s Tariff Reversal Undermined Yen Support
The real fly in the ointment may have been trade policy rather than central banks. While the initial threat of aggressive tariffs triggered risk-off flows that supported the yen, the subsequent reversal of those tariffs proved far more bullish for risk appetite than the original threats were ever bearish.
As risk sentiment improved, safe-haven demand for the yen faded, undermining one of the key pillars of the bearish EUR/JPY case. That shift ultimately worked against the yen — and helped keep EUR/JPY bid despite what initially looked like a textbook setup for a lower cross.
EUR/JPY Technical Outlook: Euro vs Japanese Yen
The monthly chart remains in a strong uptrend, with no imminent sign of a top. While prices are clearly extended from their 10- and 20-month moving averages and monthly RSI is overbought, those conditions alone are not reversal signals.
A pullback at some point is inevitable — particularly if the Bank of Japan delivers another rate hike — but stripping away expectations and focusing purely on price action, it is difficult to argue for a sustained bearish reversal. At this stage, the more likely outcome remains a series of natural retracements within a broader bullish trend.
After disappointing hawks for most of the past year, the BOJ has already shown it can underdeliver. There is little reason to assume next year will be materially different.
-- Written by Matt Simpson
Follow Matt on Twitter @cLeverEdge
Silver’s Record Rally and the Anatomy of a Momentum Breakout (Michael Boutros)
Silver Surges to All-Time High- Breakout Confirmed with RSI
It was a strong year for metals with the entire block outperforming broader risk assets 2025. Year-to-date, Copper is up more than 30%, Gold has rallied more than 60% and Platinum surged more than 100%. The strongest performer was Silver with XAG/USD more than doubling into the close of the year. Demand remains strong, supported by its critical role in the rapidly expanding solar sector, medical applications, and modern electronics. The recent AI-driven rally has only amplified the importance of this metal across key industries. Although strength commodities was not unexpected, the sheer magnitude and breath of the silver advance highlights a core market truth: powerful uptrends can remain overbought far longer than many anticipate — often a hallmark of a healthy and persistent bullish phase. Here is a quick look at the anatomy of an overbought market.
Silver Price Chart – XAG/USD Monthly
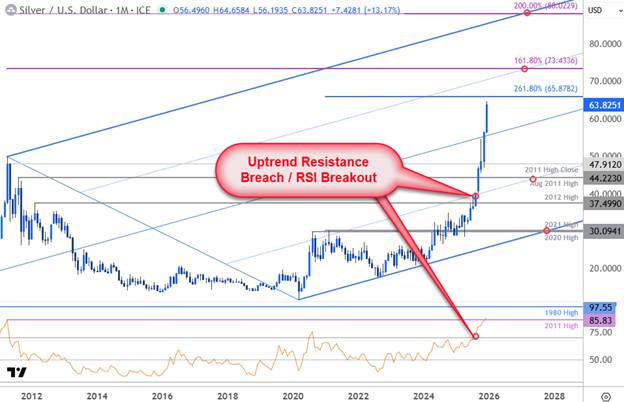
Chart Prepared by Michael Boutros, Senior Technical Strategist; XAG/USD on TradingView
Silver was a top performer in 2025 with XAG/USD rallying more than 120% as of late-December. The break above uptrend resistance in August was a flashpoint for the bulls with XAG/USD surging past the record high in the following weeks. The pivot in price was accompanied by a momentum breach above 70 with monthly RSI climbing to the highest level since the 2011.
While the break above resistance did keep the focus higher, the stretch towards overbought conditions left many “waiting for the pullback” for entry. Well, the pullback never materialized with momentum now firmly above 70 for a fifth-consecutive week. Can this rally keep going?
Silver Price Chart – XAG/USD Weekly
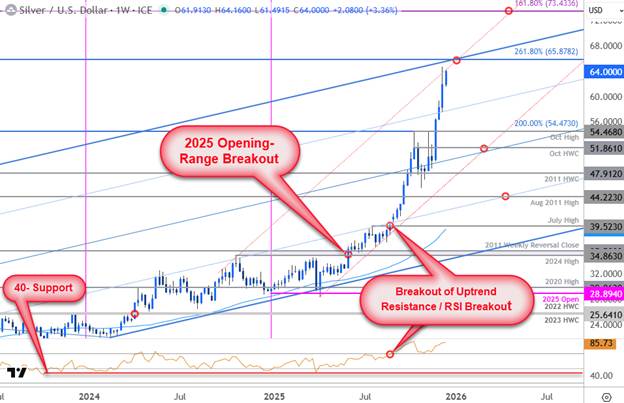
Chart Prepared by Michael Boutros, Senior Technical Strategist; XAG/USD on TradingView
A closer look at the weekly chart illustrates how the yearly rally unfolded. The 2025 opening-range took shape just below technical resistance at the 2024 swing high and the 2011 weekly reversal close at 34.86-35.58. A brief test of yearly-open support in April reversed sharply, with silver breaking through the 2025 opening-range in June.
Note that RSI did not break into overbought condition until August- that signal was accompanied with a breakout of uptrend resistance at the 25% parallel and the July high at 39.52. The subsequent move marked an eight-week rally into December with silver now approaching the upper bounds of this formation.
Key Takeaways
A few reminders to note here. First, a breakout into overbought conditions in relative strength can often be the largest and fastest stretch of a given advance- this is healthy in strong uptrends. The notion that the rally may be vulnerable because the advance is “overstretched” has misled many a trader. Remember, the indicator only tells you how much torque the rally has exhibited and should be viewed as a simple observation on the condition of an advance- a snapshot in time.
The second reminder is that there is no time value in this indicator- no predictive properties. RSI can remain in overbought territory and even signal divergence for an indefinite time-period. Note that the oscillator has been in overbought territory since August on both the weekly and daily timeframes. The bulk of the yearly rally happened as RSI was above 70. It is the break back below the 70-zone that typically signals the threat of exhaustion and waning momentum.
Another aspect to consider is that RSI behavior can also offer some insight on the state of a given trend. The oscillator will tend to hold above 40 in strong uptrends, and below 60 in strong downtrends. Silver’s relative strength has held above 40 since October of 2022- just months after the yearly lows were registered. Multiple stints into overbought found support ahead of 40 and the momentum profile has been constructive in Silver for the past two-years.
Bottom line: the relative strength is a useful tool—nothing more, nothing less. It should never supersede basic support and resistance. RSI is most powerful when a break of price levels is accompanied by extraordinary momentum, or when divergence emerges into key pivot zones to help identify potential exhaustion at support or resistance. These moments of alignment between price structure and momentum can provide greater conviction in the validity of a developing move. The key is to use the oscillator to confirm what price is already signaling—not the other way around. RSI has been a critical part of my process for years, but it belongs in its proper place: price dictates the break; RSI simply highlights the stakes.
Silver Price Outlook: The silver breakout is on its way towards uptrend resistance in one of the most impressive commodity rallies seen in years. The AI rally is likely to continue fueling growing demand for electronics and the broader outlook remains constructive heading into 2026 with momentum still in favor of the bulls.
That said, the rally may be vulnerable into the turn of the year and the immediate focus is on a reaction into the highlighted resistance confluence near 65.88 – threat for exhaustion / price inflection into this zone early in the year. Pullbacks should be limited t 51.86 IF price is heading higher on this stretch with a close above the upper parallel needed to fuel the next major leg of the advance. Subsequent resistance objectives are eyed at the 1.618% extension of the 2011 decline at 73.43 and the 200% extension at 88.
--- Written by Michael Boutros, Senior Market Analyst
Follow Michael on X @MBForex
EUR/USD Two Surprises from 2025 (James Stanley)
My top surprise from last year is actually two different items in the same market; and really, there’s a surprising item behind the move(s), as well.
Perhaps what was most surprising to me from 2025 was just how aggressively President Trump pushed into the rate cut conversation. Given his first term, I did expect some commentary on where he wanted rates to go, but in his second term this has seemed to take on an entirely new life where he was vociferously pushing for what could best be described as radical monetary policy. Towards the end of the year, Trump opined that he thought rates should go below 1%, which is far cry from the 3.5-3.75% range that we have into the end of 2025. At multiple points throughout the year, he threatened to fire Jerome Powell for not having cut rates more aggressively – and sooner.
In his first term, in which he originally nominated Powell for the position, some commentary or remarks around dissatisfaction from the Fed hiking rates were not abnormal. This would usually receive some condemnation from the media, usually around threats of Fed independence, but by and large those comments seemed somewhat distant and at least partially innocuous. It was out of the norm, however, by a traditional Presidential standard.
In his second term, however, he resorted to name calling and threats to fire Powell, even though it remains questionable as to whether a President can actually fire a Fed chair. And perhaps more interesting is the fact that Trump was soon going to get the chance to replace him anyways as Powell’s term atop the bank is set to end next year.
This had a big impact in the US Dollar and in-turn, EUR/USD. As we came into 2025 it seemed almost a foregone conclusion that EUR/USD would revisit the parity handle. US Treasury rates were skyrocketing and the Euro had fallen by 1,000 pips from the Q3 2024 high down to the lows in early 2025 trade. But that’s around the time a major Fibonacci level came into play to soften the bleeding. In February it was all about bears getting pushed back as an ascending triangle formed – and then in March, as threats of a recession in the U.S. took over and drove rate expectations lower, EUR/USD broke out in a very big way.
This is my first surprise on EUR/USD for 2025.
EUR/USD Weekly Chart
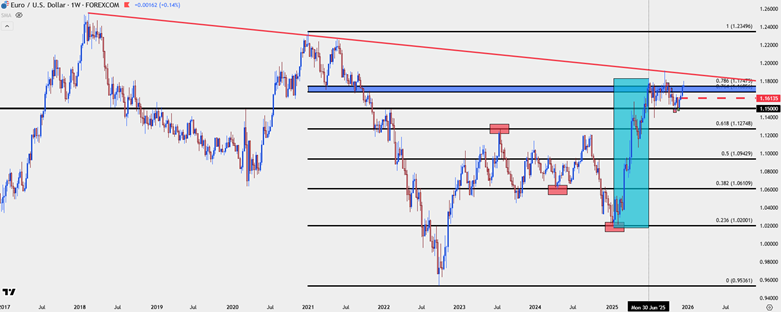
Chart prepared by James Stanley; data derived from Tradingview
My second surprise on EUR/USD is what happened in the second half of the year, or perhaps more accurately – what did not happen. The pair found resistance at a familiar Fibonacci level in early Q3 trade and that resistance has largely remained in place ever since.
That rally in EUR/USD was largely relegated to the first half of the year. That’s when the 76.4-78.6% retracements from the same Fibonacci setup came into play to mark the highs and for most of the second half of the year this remained a stumbling block for bulls.
On the fundamental side, it was as the Fed was opening the door for cuts that the backdrop for EUR/USD seemingly opened for bullish continuation. But after pushing up to a fresh three-year-high on the initial rate cut announcement, the pair stalled, and then actually started to sell-off, all the way until the 1.1500 level came into play and held the lows over two instances in November.
On the other side, the ECB opened the door to hikes in Q4, thereby increasing the potential for rate compression between the two economies but as of right now, the pair still has yet to take out that swing high from September 17th. At this point the trend on the daily chart remains bullish, even if the weekly chart shows digestion at a major level of longer-term resistance.
But a key fact to remember as we move into 2026 is that the pricing in of rate cuts can be very bearish, as we saw in the first half of 2025. But rate cuts themselves don’t necessarily have to carry that same negative connotation for trend as perhaps the more important factor is ‘what’s next.’ This is like what we saw in the final four months of 2024 when the US Dollar rallied, EUR/USD dropped and Treasury yields jumped even as the Fed was cutting rates.
Don’t be surprised if the fundamental drivers don’t lead directly to logical price movements, as the bigger factor for market behavior is positioning and sentiment.
EUR/USD Daily Chart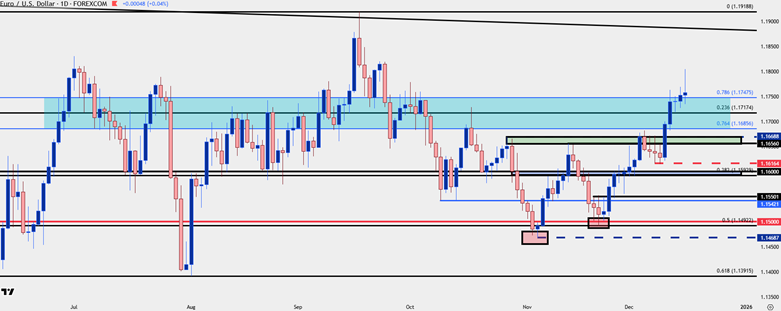
Chart prepared by James Stanley; data derived from Tradingview
--- written by James Stanley, Senior Market Analyst, Global Macro
Biggest 2025 FX surprise: USD/JPY (Fawad Razaqzada)
It has been a bearish year for the US dollar, but the biggest surprise has been the USD/JPY pair for me in the FX space. By Christmas eve, the Dollar Index (DXY) was down 9.6% year-to-date, trading around 98.00, its weakest level since 2022. The DXY was primarily driven by the strength in the EUR/USD exchange rate, which was +13.7% YTD, and to a lesser degree the GBP/USD (+7.7% YTD). The likes of the Swedish Krona (+17% YTD) and Swiss franc (+13% YTD) also played a part in the DXY’s weakness, although these currencies have a combined 7.8% weighting on the DXY, compared to the 57.6% of the euro, 11.9% of the pound and the 9.1% of the Canadian dollar. The only other major currency with a 13.6% weighting on the DXY is the Japanese yen. But the latter was barely holding a gain made earlier this year. The yen’s weakness stood out for me as the most surprising development in the FX space. And it wasn’t just against the US dollar.
The yen has had a year to forget
Since bottoming in April, the USD/JPY managed to climb more than 12% just before Christmas, despite the US dollar weakening against all other major currencies during this period. The yen weakened to multi-decade lows and in some cases hit all-time lows against the other major currencies, with the EUR/JPY, for example, surging to near 185.00 handle. The yen sold off despite the Bank of Japan delivering two further rate hikes at the time when other central banks were turning neutral, or in the case of the Fed, dovish. At +0.75%, the benchmark interest rate in Japan was now the highest since September 1995. Bond yields climbed accordingly to multi-decade highs in Japan as JGBs sold off. But that did not translate into any yen strength. So, what’s going on?
What caused the USD/JPY strength?
One argument why the yen has been a weak spot was to do with the fact that this has been a year where we have seen a big risk rally, keeping demand for the low-yielding JPY downbeat, with traders using the currency as a carry trade. This argument would have made more sense had gold or the likes of Swiss franc also had a weak year, but as we know, it was far from that.
What about interest rate differentials? While the Fed delivered 3 rate cuts, the benchmark US interest rate was still at a relatively-high level of 3.75%, similar to the UK, while rates outside of Switzerland and Japan were all above 2% by the end of 2025. By that logic, you’d expect both the USD/JPY and USD/CHF to be among the best performers in the FX space. Yet, the yen was the weakest while the franc was among the strongest. Indeed, the performances of the yen and franc could not be any more contrasting. Despite interest rates being at zero in Switzerland and 0.75% in Japan, the CHF/JPY pair had a rather strong year, and was up for the 7th consecutive month by December, almost reaching the 200.00 level.
So, relative interest rates could not explain the yen’s weakness either.
Another argument for the surprise strength in the USD/JPY pair was this: shorting the dollar was expensive as the overnight financing costs were significant given that US interest rates have been among the highest in the world. But this didn’t stop traders shorting the likes of the USD/CHF, so why would this impact the USD/JPY alone?
The yen’s weakness was therefore driven almost entirely by domestic factors.
Japan’s fiscal expansion vs. monetary tightening
In Japan, Sanae Takaichi become the new prime minister in October, making her the first woman to hold the office. Under Takaichi’s governance, a fiscal dove, traders have been betting on aggressive fiscal expansion. The hope from Takaichi was to boost economic growth significantly, arguing that by sustaining a higher level of longer-term growth would more than offset increased short-term increases in the debt-to-GDP ratio. In theory, that sounds like a decent plan, if enough growth is generated and sustained. In practice, growth may not materialise as much as expected, especially when your central bank is trying to normalise monetary policy after decades of extraordinary-low rates and numerous stimulus packages.
Investors worried that the fiscal expansion would not lead to sustainable GDP growth, while elevated inflation was increasing the pressure on the Bank of Japan to respond by tightening policy faster. Japan was pressing the accelerator and brake at the same time. That sort of a policy is usually not sustainable, and this was reflected in bond yields climbing steadily while the yen was weakening throughout the year. Investors were demanding better fiscal discipline from the government, but all they got was some lousy verbal warnings.
How much of an impact will Japan’s intervention have on USD/JPY?
With all major risk events of the year behind us, could the Japanese government use the thin holiday period to intervene in the FX markets? They have been warning against “one-sided and sharp” currency moves. That signals Japan’s readiness to intervene in the FX markets by buying the yen and selling US dollar reserves. But this alone will not be enough to turn the tide in the yen selling, although it will most definitely have a short-term impact.
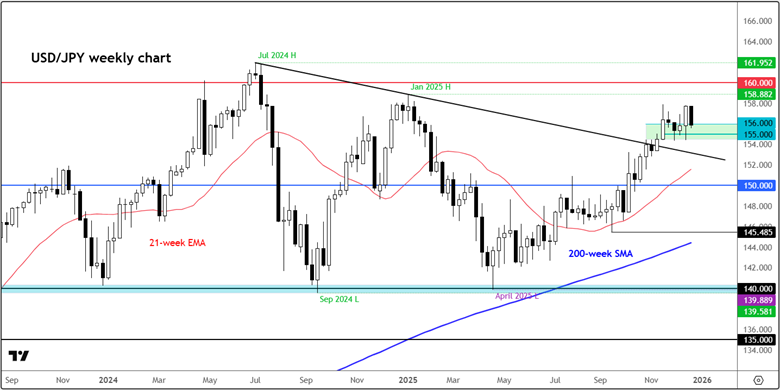 Source: TradingView.com
Japanese policymakers will be watching the yen closely, and history shows they’re not shy about intervening. Should USD/JPY surge towards the 160.00 region, Tokyo could step in to support the yen once more. Until then, the USD/JPY trend is likely to stay bullish amid existing macro factors supporting it.
-- Written by Fawad Razaqzada, Market Analyst
Follow Fawad on Twitter @Trader_F_R
FTSE 100 in 2025: FTSE 100 outperforms S&P 500 (Fiona Cincotta)
- FTSE 100 rallied 21% in 2025, outperforming the S&P500’s 17% gains.
- Winners beyond tech: Low-tech exposure paid off as financials and miners drove gains.
- 2026 outlook: cautious optimism with 10,000, in focus
- FTSE 100 technical analysis
While a rally in tech stocks and AI helped drive record highs in the US this year, the FTSE 100 has not only kept pace but also outperformed in 2025. The UK index is on track for its seventh-best year ever, with the highest returns since the aftermath of the global financial crisis.
Despite political and economic uncertainty, the FTSE 100 rallied 21% year to date as of the 23rd December, ahead of the 17.3% gains experienced by the S&P 100 across the course of the year and double what the UK index gained last year. You need to go back to 2009 to see a better annual return; that year was a recovery from the losses of the financial crisis.
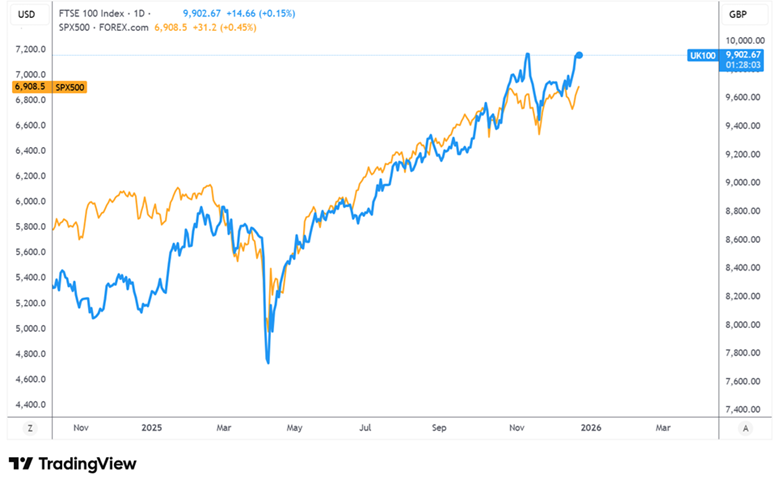
The FTSE 100 rallied to a record high of 9930, benefiting from a broad diversification away from the US earlier in the year. The move in the wake of Trump’s Liberation Day tariffs, which spurred a sell America trade, fueled a rotation into – anywhere but the US. However, this tapered off towards the end of the year.
While the UK faced plenty of political and fiscal uncertainty, particularly in the lead-up to the Chancellor’s Budget on November 26, this had little lasting impact on the FTSE 100.
Instead, the FTSE proved to be a good play on global growth and inflation, given that it's composed of cyclicals, multinationals, commodity plays, and financials.
What’s most interesting is that the FTSE has a clear lack of tech stocks, which in previous years has been a distinct disadvantage, but not in 2025. Technology firms account for just 3.5% of the FTSE, compared with approximately a third of the S&P 500. While tech stocks have been key to driving growth in international stock indices in recent years, doubts about AI spending and monetization have made the tech trade more volatile in recent months.
Fifteen of the FTE 100 companies reported returns over 50%, including retailer Next, precious metals miner Fresnillo (+365%), and copper miner Antofagasta. Nine of the top 20 performers were in the broader financial sector.
The other noteworthy point is that the FTSE 100 rallied despite GBP/USD rising 7% across the year. A stronger pound is typically negative for the FTSE 100, as it yields a less favourable exchange rate for FTSE multinationals (80% of the FTSE 100 are multinationals).
Outlook for 2026
The question now is whether the UK index can continue outperforming. The FTSE 100 could see cautious gains in 2026, with the 10,000 psychological level a key focus.
Resilient corporate earnings, attractive dividend yields, and ongoing share buybacks are expected to be tailwinds in the near term. Meanwhile, further Bank of England rate cuts should support demand for stocks appeal relative to bonds. At the same time, the index’s global exposure provides some insulation from weak domestic growth and potential political risks ahead.
FTSE 100 Forecast – Technicals
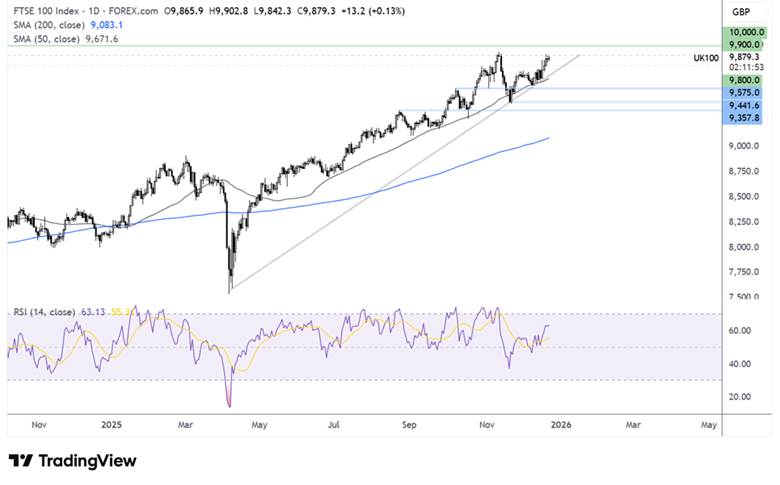
The FTSE 100 recovered from the 7535 2025 April low, rallying to a high of 9932 on November 12. The price eased back to 9425, to test the rising trendline support, before rebounding higher and is once again approaching 9900.
Buyers will look to extend gains above 9900 and 9930 to create a higher high and head towards 10,000.
Support is seen at 9700, the 50 SMA, and rising trendline support. Below here, support is seen at 9575, the October 8 high. It would take a break below 9450 to create a lower low.
Crude Oil in 2025 Supply Dynamics Continue to Dominate the WTI Market (Julian Pineda)
As 2025 comes to an end, one of the most important lessons for the oil market is that the balance between supply and demand expectations continues to dominate the main oscillations in crude prices. Oil is on track to end the year with WTI below 60 dollars, levels not consistently seen since 2021. Much of this decline stems from global supply changes that unfolded throughout the year. If this same dynamic persists, it could become a key factor to monitor in crude oil movements heading into 2026.
Events That Drove the Main Market Movements in 2025
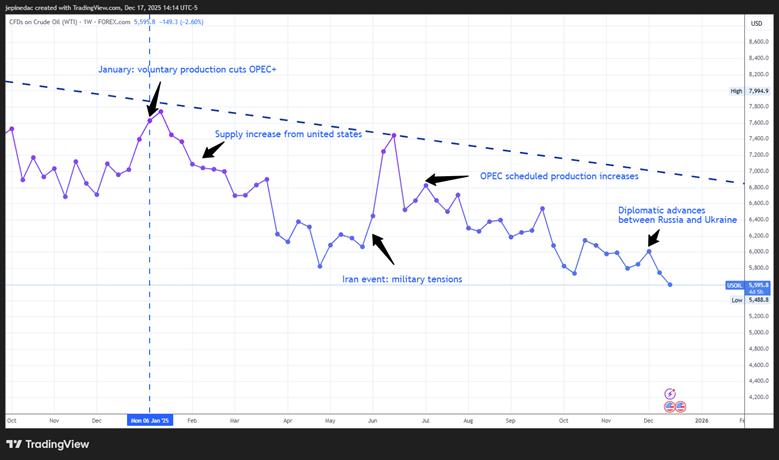
Source: StoneX, Tradingview
- The year began on a positive note for WTI as OPEC+ countries, including Saudi Arabia, maintained voluntary production cuts, reducing global supply by almost 1.5 million barrels per day. This helped sustain an outlook of reduced supply during the early months of 2025.
- However, as the year progressed, a structural weakness in crude prices began to emerge, driven by a steady increase in U.S. production—a country outside OPEC+. In April, U.S. inventory data showed buildups far above expectations, and together with increasingly aggressive comments from OPEC+, this heightened concerns over a potential global oversupply, reinforcing a broader bearish bias.
- Later in the year, the market experienced a significant rebound, again tied to supply expectations—this time triggered by a geopolitical event in the Middle East. During June 2025, tensions between Israel and Iran escalated following a series of airstrikes and the launch of more than 150 ballistic missiles by Iran targeting Israeli facilities. Crude surged more than 20% amid fears over the stability of the Strait of Hormuz, through which roughly 20% of the world’s oil is transported. However, the conflict de-escalated quickly due to U.S. intervention, and crude prices soon returned to a downward trajectory.
- Shortly afterwards, in July, a new bearish catalyst emerged when OPEC+ announced a more aggressive production increase, raising supply by more than 400,000 barrels per day. These increases, which continued steadily through year-end, reactivated concerns over oversupply, restoring strong downward pressure on crude oil.
In summary, the main events of the year shared one common denominator: constant shifts in production expectations. This reinforces the lesson that supply dynamics remain one of the most decisive factors in assessing crude strength. For most of 2025, the market was shaped by expectations of higher production, a dynamic that became the central pillar behind the persistent weakness in crude prices, pushing WTI to levels not seen since 2021.
A Possible Peace Agreement Shapes the End of the Year
Toward the end of 2025, one of the key events contributing to WTI weakness has been progress toward a potential peace agreement between Russia and Ukraine. Markets reacted optimistically to recent comments in which Trump stated that an agreement is “closer than ever,” citing structured dialogue based on security guarantees for Ukraine. It is estimated that about 90% of the key points have already been negotiated among Ukraine, the European Union, and the United States; only Russia’s official approval remains before moving toward a formal agreement and an eventual ceasefire.
It is important to remember that, according to the latest available data, Russia produced roughly 9.8 million barrels per day in August, making it one of the three largest oil producers in the world. If a peace agreement leads to lifting economic sanctions, a full return of Russian crude to the market could intensify oversupply concerns.
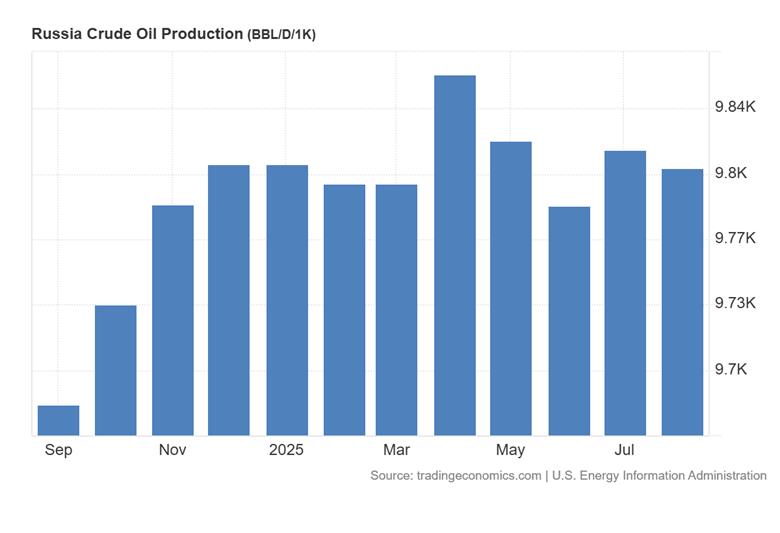
Source: TradingEconomics
With this in mind, greater supply—already a central driver of weakness in 2025—combined with demand that still shows no signs of solid recovery, could continue pressuring prices downward. If a peace agreement is finalized, together with ongoing OPEC+ increases and rising U.S. production, 2026 could be marked by a global oversupply scenario, likely sustaining persistent selling pressure in the months ahead.
What to Expect for WTI in 2026
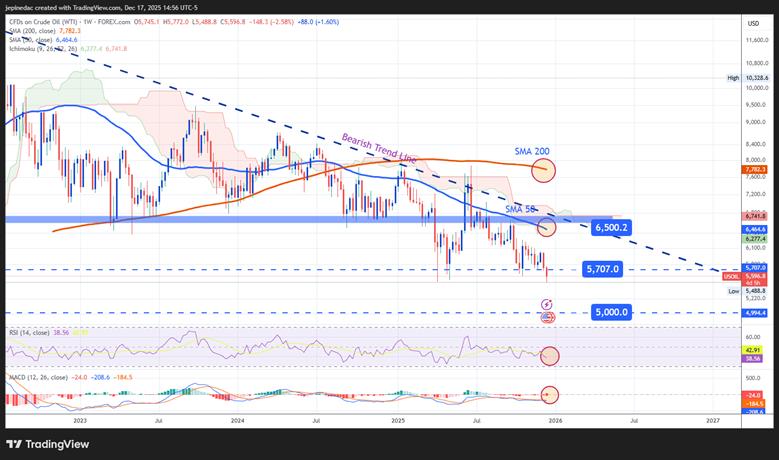
Source: StoneX, Tradingview
- The Downtrend Remains Dominant: Since May 2022, the WTI weekly chart has shown a consistent downward trend, with selling momentum once again pushing the price below 60 dollars. The absence of significant bullish corrections throughout 2025 keeps this formation as the most relevant long-term technical structure, likely to continue dominating downward movements in the coming months, especially if key support levels below psychological thresholds such as 60 and 50 dollars are broken. As long as price remains below the 50-week simple moving average, the market bias may remain bearish heading into 2026.
- RSI: The RSI has remained below the neutral 50 level for several weeks, suggesting that the average momentum continues to reflect a bearish bias. As long as RSI maintains consistent downward oscillations without entering the oversold zone (30), bearish pressure is likely to continue dominating WTI.
- MACD: The MACD shows slight oscillations below the zero line, indicating that the prevailing strength of the moving averages remains bearish. If MACD readings continue to decline in the coming months, selling pressure could intensify further.
Key Levels:
- 65 USD – Relevant resistance: This level corresponds to the zone where the long-term downtrend intersects with the 50-period moving average. Bullish movements that manage to return to this region could put the downtrend at risk and activate a stronger bullish bias in WTI.
- 57 USD – Nearby barrier: A level of persistent neutrality that has generated indecision in recent weeks. If prices fail to break above this zone, a more defined sideways range could develop.
- 50 USD – Key support: A level not seen since January 2021 and a significant psychological threshold. Bearish movements that reach or break below this area could reinforce a consistent selling bias, extending WTI’s ongoing downtrend.
Written by Julian Pineda, CFA, CMT – Market Analyst
Follow him at: @julianpineda25
2025’s Biggest Surprise: The (Lack of) Market Impact from Economic Policy and Data (Matt Weller)
Key Points
- My biggest surprise in 2025 was the lack of impact from economic data and policy decisions on markets.
- From the US tariff policy to central bank meetings to the US government shutdown, seemingly major traditional economic developments were less impactful than in previous years.
- Traders may want to take any official policy announcements and data with a grain of salt and at least become more aware of alternative data sources in 2026.
While there were plenty of surprising market moves in 2025 (the big rally to record highs in Gold and Silver, multi-year lows in oil, the continued march higher in equity indices all come to mind), my biggest surprise in 2025 was the lack of impact from economic data and policy decisions on markets.
The clearest example of this phenomenon comes from the US’s impositions of the highest tariffs in a century, a policy that many economists suggested would tip the world’s largest economy into a recession, with obvious implications for markets. As the chart below shows, the S&P 500 did see a quick decline on the release, but that move was rapidly reversed, before the imposition of most of the tariffs, and powered onward to new highs in short order:
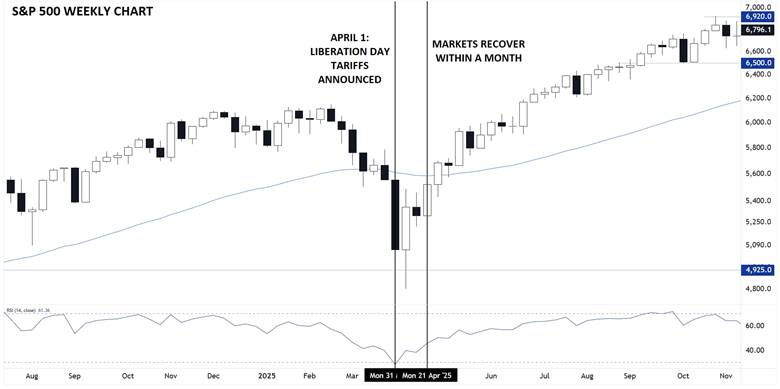
Source: StoneX, TradingView
Of course, there were ostensibly logical explanations ex-post: The tariffs ultimately haven’t been implemented to the extent outlined on the world’s second-largest economy, companies have used alternative shipping points to sidestep the tariffs, carve outs have limited their impact, the impact hasn’t fully emerged due to inventory cycles, etc. Regardless, the ultimate impact for any traders who viewed this shift as anything but a couple week blip was that they overreacted
This same dynamic has played out in other policy announcements, from tax cuts to increased fiscal spending to central bank interest rate decisions to the longest government shutdown in US history.
Likewise, we’ve seen a widespread decline in the impact of historically significant economic data. Especially in the US, but to an extent in other countries as well, traders have quickly shrugged off “surprising” readings on inflation, jobs, GDP, and sentiment.
From my perspective, there are at least two reasons why we’ve seen this dynamic play out. Most importantly, the dominant theme of the rise of AI and the associated wealth effect have rendered more traditional economic measures less significant. As long as the AI “Hyperscalers” continue to invest in building data centers, the other aspects of economic growth and other data will continue to take a back seat:
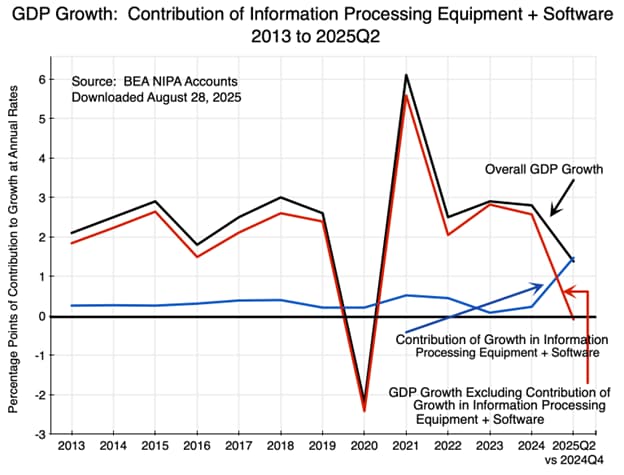
Source: BEA, AnEconomicSense
The other reason traders have mostly disregarded economic surprises is that there are reasons to believe that the underlying data is increasingly not representative of the underlying economic conditions. Most economic data has been compiled via surveys for decades…and post-COVID, fewer and fewer people are responding to those very surveys:
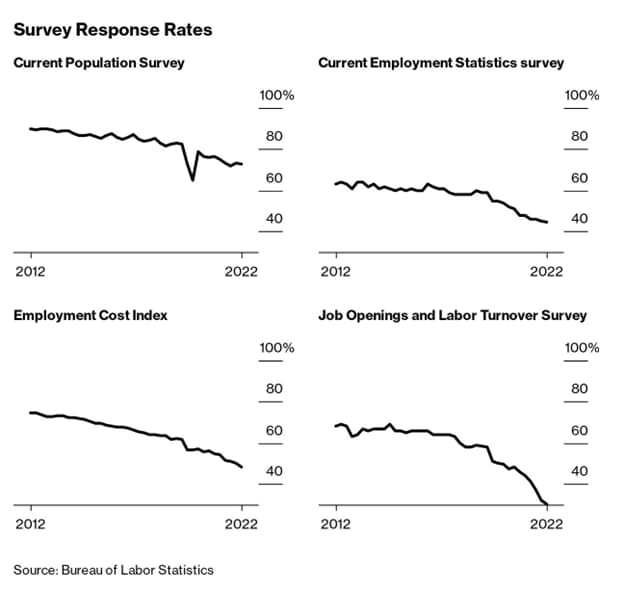
Source: BLS, Bloomberg
Tautologically, a survey with fewer respondents is inevitably going to be less precise and indicative of the underlying conditions. At the same time, the widening political gulf is leading more and more consumers to evaluate the economy through their own political lens, rather than an objective view of the underlying business conditions. The UofM Consumer Sentiment survey, for example, has documented wild fluctuations in sentiment around elections, based solely on the current occupant of the White House:
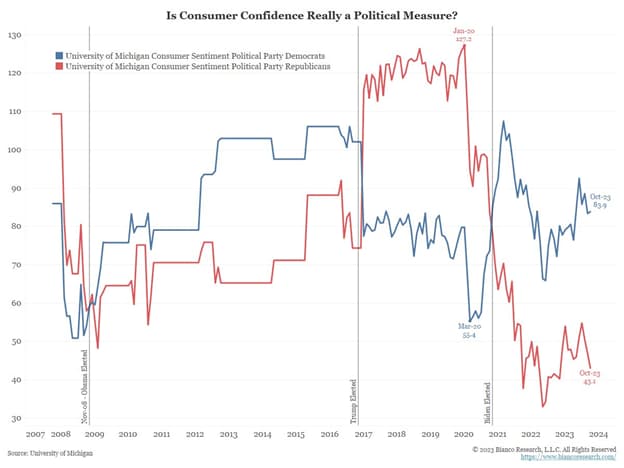
Source: UofM, Jim Bianco
The good news, at least for news- and data-focused traders, is that this surprise may not be permanent. If the AI trade cools down or political biases become less salient in the coming years, traditional economic policy and data could quickly regain its previous importance for markets. Additionally, as we saw during the US government shutdown, alternative forms of data can help fill the gaps and provide a more holistic view of economic conditions, even if the standard data is marred by issues with response rates and political biases.
One key takeaway for traders heading into 2026 would be to take any official policy announcements and data with a grain of salt and at least become more aware of alternative data sources to help inform their trades and maximize their chances of success.
-- Written by Matt Weller, Global Head of Research
Check out Matt’s Daily Market Update videos on YouTube and be sure to follow Matt on Twitter: @MWellerFX
Top Lesson of 2025 – Gold (Razan Hilal)
2025 delivered one of the clearest trading lessons of the decade: in a parabolic trend, overbought is not a sell signal. Shorting Gold without protection became one of the heaviest burdens traders carried this year, as the metal surged an unprecedented +64%, repeatedly defying historic RSI extremes and conventional momentum logic.
Gold opened 2025 near 2624, rallied almost 900 points into the 3500 high, consolidated for five months into a tight continuation structure, then launched another 900-point leg toward 4400. Trend followers and hedge traders navigating the new Trump policy cycle captured exponential upside. But for short sellers anchored to the idea of “overheating,” the relentless rise pushed portfolios to breaking points — not via reversals, but through brief consolidations that simply reset the uptrend.
This raised a deeper question for global investors: How high can Gold go? And what does that imply about confidence in today’s monetary and financial architecture?
Gold, US 500 Monthly Time Frame - Log Scale
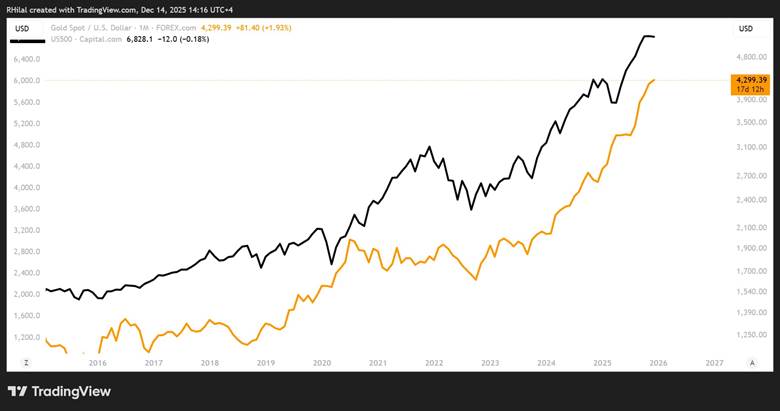
Source: Trading view
For the first time in years, the positive correlation between Gold and US equity indices strengthened, sending both assets on synchronized exponential rises. Gold fulfilled a dual role:
- A safe haven during geopolitical shocks
- A liquidity beneficiary during risk-on expansion
A softer US Dollar, dovish policy expectations entering the Trump administration, and persistent central bank accumulation all reinforced the bullish cycle. This combination kept Gold almost exclusively in uptrend or consolidation mode, effectively suspending traditional overbought principles across 2025.
Will a proper correction emerge? Probably, with confirmation from major monthly technical levels.
Key Technical Structures and Lessons Ahead
Gold Monthly Time Frame – Log Scale
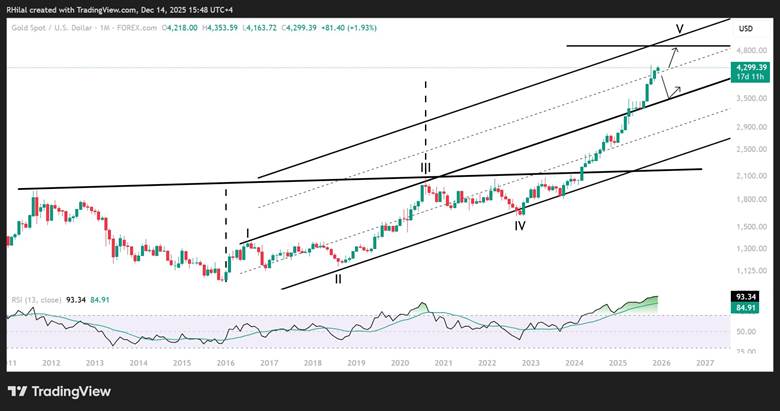
Source: Trading view
Cup & Handle Completion
Gold’s nearly 4400 peak — accompanied by a record 93 RSI — aligns with the measured move of a decade-long cup and handle formation extending back to 2011. This marks a natural exhaustion and reaction zone.
Duplicated Channel Mid-Zone
Price has reached the mid-point of a duplicated channel framing Gold’s primary structure from 2016 to 2025. Historically, mid-zones act as equilibrium areas where markets pause, consolidate, or retrace before the next structural move.
But as the saying goes, the trend is your friend until a confirmed reversal emerges. As long as Gold continues to break through psychological and structural resistance levels, the broader bullish framework remains intact.
Market consensus, including major US banks, increasingly points toward a $5,000 target. This scenario becomes viable if Gold delivers a sustained monthly close above the 4,400 breakout zone, which would open the path toward the upper boundary of the duplicated long-term channel near the 5k region.
However, Gold is currently positioned near a neutral mid-channel zone, where trend hesitation or corrective phases often develop. A drawdown toward the 3700–3500 channel support area remains a realistic risk before the next leg higher. Such a move would not invalidate the primary uptrend but would require careful monitoring of trend shifts and key breakouts to avoid bull traps, bear traps, and prolonged consolidation structures. For now, 3900 stands as the pivotal support level; losing it would be the first meaningful indication of deeper corrective pressure.
Written by Razan Hilal, CMT
Follow on X: @Rh_waves
Bitcoin: How the Most Anticipated Trade of 2025 Fizzled (David Scutt)
- ETF approvals drove early optimism
- Fed pivot boosted liquidity expectations
- GENIUS Act added regulatory clarity
- Price trades in bearish wedge warning of resumption of October rout
Summary
Bitcoin’s 2025 story was built on powerful catalysts: spot ETF approvals, a dovish Fed, and regulatory progress. The final quarter flipped the script. Price action now dominates the conversation, with BTC/USD coiling within a rising wedge following an extended bearish move. A break lower could open the door to November’s lows and beyond as we approach 2026.
Price action over hype: A reminder for 2026
Institutional access was the dominant bullish theme for Bitcoin in 2025. U.S. spot ETF approvals early in the year were heralded as a watershed moment, unlocking regulated exposure for both retail and institutional investors. Heavy inflows into products such as BlackRock’s IBIT reinforced the narrative that structural demand would tighten supply and underpin higher prices. Later, Vanguard’s move to allow its vast client base access to Bitcoin ETFs was seen as another game-changer, adding strength to the bullish case.
The macro backdrop added further conviction. A pivot from the Federal Reserve toward rate cuts and looser financial conditions was widely interpreted as a tailwind for risk assets, with Bitcoin positioned as a beneficiary of dollar weakness and liquidity expansion. Combined with persistent fiscal deficits and swelling money supply, the environment appeared tailor-made for digital assets to outperform.
Regulatory clarity was deemed another pillar of confidence. The U.S. administration pushed forward with the GENIUS Act, easing pathways for banks to engage with digital assets. Combined with the April halving, which tightened miner supply, the bullish narrative was clear: structural demand, constrained supply, and improving regulatory optics.
Yet, the script did not play out as expected. Despite the tailwinds, Bitcoin faltered in the final quarter, defying consensus and exposing the fragility of narrative-driven positioning. For me, this was the biggest surprise of 2025 and a valuable lesson, providing a reminder that price action trumps headlines. No matter how compelling the apparent catalysts, respecting the tape remains the ultimate discipline in trading.
Rising wedge signals risk of trend continuation
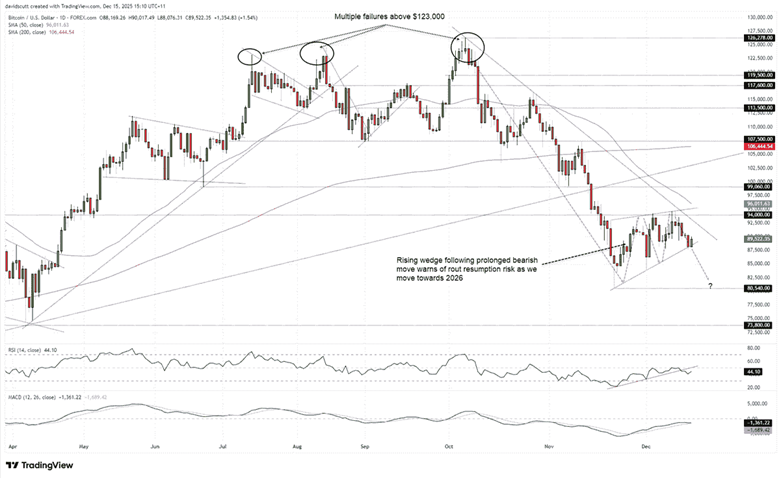
Source: TradingView
Over the course of 2025, it really was a tale of two halves, to borrow a sporting analogy, with BTC/USD ripping higher between April and July before stalling repeatedly above $123,000. That zone remains one to watch in 2026 if the price returns there. As things stand in the week before Christmas, the technical picture looks very different.
Bitcoin is sitting in a rising wedge following an extended downtrend, a setup that often warns of trend continuation. The price is now resting against the November uptrend, with a breach of this level opening the door for another potential wave of selling. If we see a sustained break of the uptrend, convention suggests we may see a retest of the 21 November low of $80,540. Should that be achieved, traders could assess whether to cut, hold, or reverse the position depending on price action at the time. Downside levels to watch include the 2025 year-to-date low around $74,500 and March 2024 high of $73,800.
Should downside risk fail to materialise with BTC/USD pushing above the October 2025 downtrend from the record highs, the 50-day moving average, $99,060, the 200-day moving average and $107,500 are topside levels of note.
With RSI (14) breaking its uptrend and moving further away from the neutral 50 level, downside pressure is building yet again, favouring bearish setups. While not yet confirmed by MACD, it too is curling over towards the signal line, moving closer to a crossover that would strengthen the bearish signal.