Although crop losses in south america are currently in the spotlight, the planning of the us spring crop, which will start to be planted in april, is also on the market's radar.
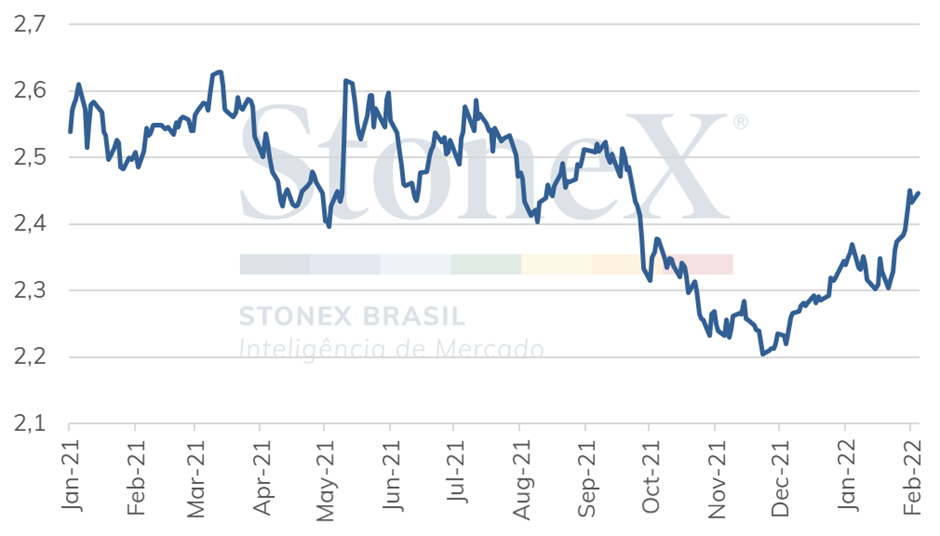
One of the most followed indicators is the ratio between the soybeans and corn prices on the CBOT, which would signal to the producer which crop is more profitable, possibly indicating area switching between the grains. The indicator represents the ratio between the two commodities prices and is always monitored when the planting decision is made from December to March. Historically, the ratio is observed between the November soybean contract and the December corn contract, representing the price of the crop entering the market after harvest. A higher ratio (above 2.35/2.4) would indicate a more advantageous soybean return than corn. On the other hand, a lower ratio would be favorable to expanding the cereal area. It is important to note that this ratio reference level may vary over the years due to production costs, productivity, etc. In a long historical series, it is observed that the ratios tend to oscillate around 2.5.
For most of 2021, the ratios were higher as soybean prices were supported by the prospect of limited stocks in the US. However, this scenario has changed since last September, with the US harvesting an excellent crop and the country's soybean exports trending lower. In addition, the corn balance sheet situation is also not quiet, supporting grain prices. As a result, the ratios have started to rise again, standing at around 2.4, with South American crop failures standing out. Therefore, this level would not offer much "advantage" to either commodity. Still, it should be pointed out that the current situation of soybean losses is more worrying since Brazil harvests most of its corn in the second crop. On the other hand, it is always good to remember that the North American producer has a tradition of growing corn and likes to plant this cereal, which ends up conferring a certain preference, even when the ratios are not favoring this choice.
Soybean-Corn Ratio on the CBOT (SX2/CZ2)
Source: CME. Design: StoneX.
Besides the profitability factor, translated through the ratios, for the 2022/23 cycle, to make his decision, the farmer also needs to take into account the issue of production costs, especially fertilizers. For being a crop more dependent on fertilizers for good development, corn historically demands a higher expense for its production, a great disadvantage when the exchange ratios are at very degraded levels for farmers.
According to the USDA, fertilizers historically represent about 6% of soybean production costs. For corn, this representation rises to about 17%.
Over the last few months, fertilizer prices have been climbing steeply, approaching all-time highs earlier this year. However, regarding the competitiveness factor between corn and soybean today, nitrogen fertilizers should be the point of attention for the spring crop of the 2022/23 cycle in the United States.
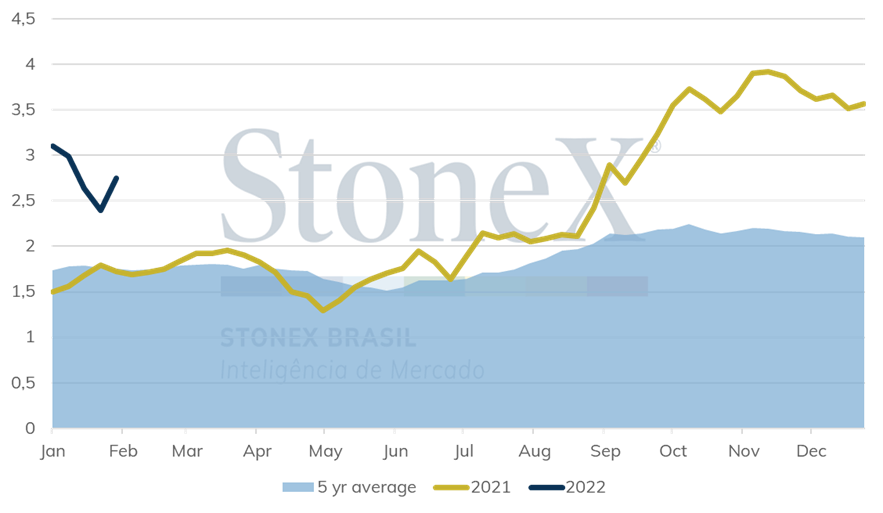
Nitrogen applications, in turn, are essential for seeding corn, unlike soybeans, which fix nitrogen naturally in the soil. Only in the second half of last year, the urea price indicator in the US Gulf region jumped 80%, currently priced at USD 590/ton, 56% more expensive than a year ago. It is worth noting that since the turn of the year, urea has been undergoing major corrections; in any case, the exchange ratios remain at very high levels and are bad for the farmer.
Urea-corn exchange ratio in the US (a ton of corn/ton of urea)
Source: StoneX. Design: StoneX.
When looking at the P market, for example, important for soybean sowing, the situation is also of higher prices, but at a less accelerated magnitude than nitrogenous. For example, DAP in the US showed a 19% increase in the second half of 2021, priced at USD 738/ton CFR in the first week of this month. The farmer should thus find prices 33% higher compared to February/21, a less alarming situation than urea.
Considering the nutritional needs of each crop and the price behavior of fertilizers in recent months, there is an economic incentive to plant soybeans, at least from the production costs perspective. With the escalation of fertilizer prices last year much has been discussed on switching corn area for soybean in the next American crop. However, this decision depends on several other variables, such as the price of commodities themselves and each region's ratio and intrinsic cultural factors.
In any case, although discussions about the North American area will remain for quite some time, the situation of a world balance without much slack for both soybeans and corn should direct a planted area that has the potential to avoid major rationing on the supply side.
Considering the current situation, in which the shortfall in South America is of more concern for soybeans (which have the production extremely concentrated) than for corn, the US would need to plant about 90 million acres of soybeans and 91 million acres of corn to ease the problems in the south of the continent. This would mean an increase in area for the oilseed and a decrease for the grain compared to last year. In addition, it is necessary to assume that yields would remain within the historical average. According to the USDA, 93.4 million acres of corn and 87.2 million acres of soybean were sown in the country in the last cycle.