
Nasdaq 100 Volatility Erupts as Futures Positioning Warning Plays Out
Nasdaq 100 volatility surges after an 8% pullback, while futures positioning data suggests traders were already preparing for risk.

Matt Simpson
- Equities
By: Matt Simpson, Market Analyst
The Nasdaq 100 has suffered its sharpest pullback in months, with volatility surging after the index failed to hold above the 30,000 milestone. While traders debate whether this is a routine correction or the start of something larger, futures positioning data had already begun flashing warning signs before the selloff accelerated.
It has been a week since the Nasdaq 100 last printed a record high. Since then, the tech-heavy index has fallen as much as 8%.
Naturally, the rise in bearish momentum has been accompanied by a surge in the Nasdaq’s volatility index (VXN). The VXN measures implied volatility over the next 30 days, with a reading of 29.78 representing an annualised level of expected volatility. The daily chart shows the VXN has risen back above its long-term average of 25.05, while Tuesday’s 8.1-point jump marked its largest daily increase since November.
What makes the 8-point rise particularly interesting is that daily increases of this magnitude have historically occurred near turning points for the Nasdaq 100, whether at major peaks or troughs. However, the absolute level of the VXN is not yet extreme, nor is the Nasdaq 100’s 8.3% decline from its record high to Tuesday’s low. Therefore, the jury remains out on whether the worst of the decline has already passed or if the bears are only just getting started.
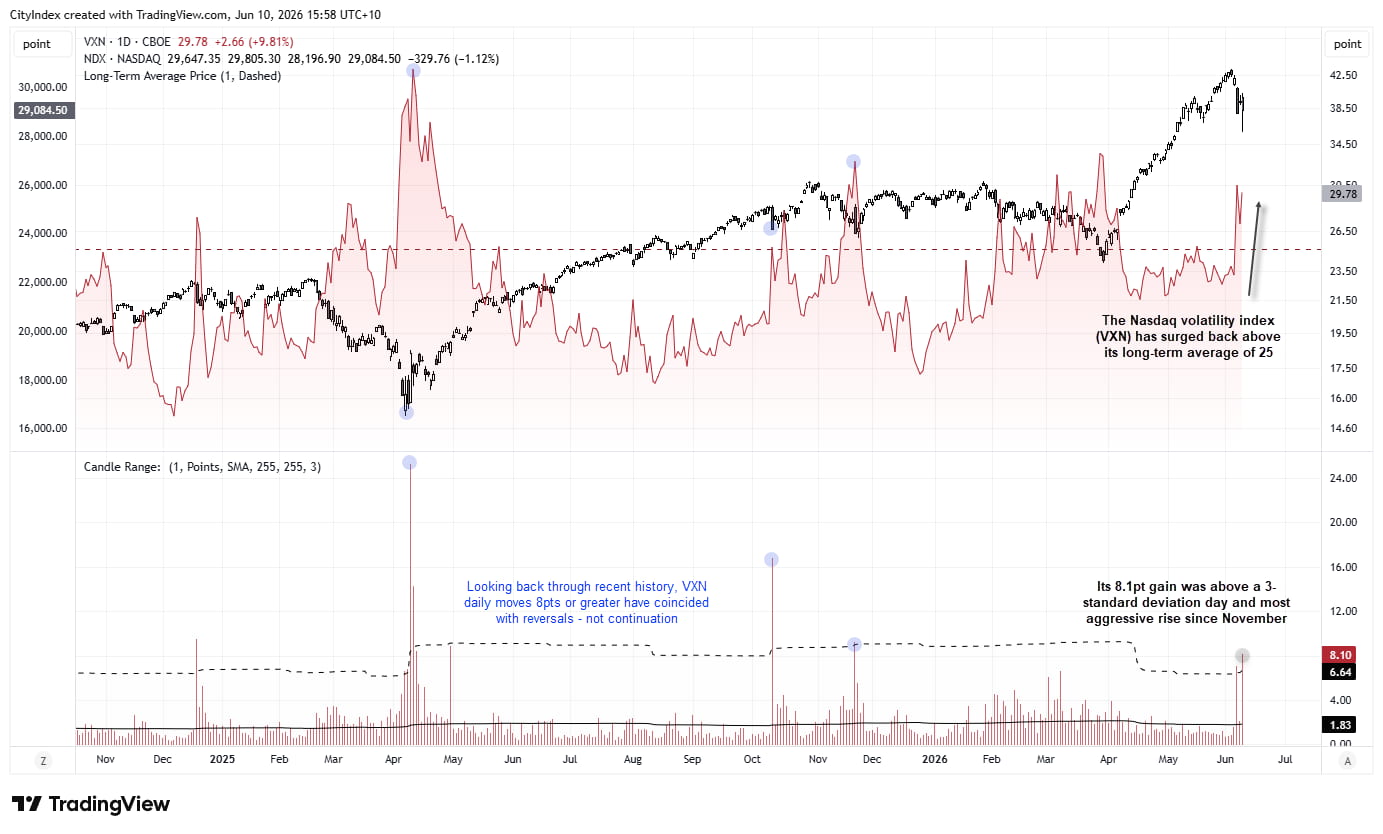
Source: CBOE, NASDAQ, TradingView
The weekly chart shows a strong uptrend leading into the record high set two weeks ago. However, momentum turned sharply lower following a false break above 30,000, leaving a bearish outside candle at the record high. Incidentally, it was the most bearish week for the Nasdaq 100 in over 10 weeks, occurring just as the index approached the correction low that preceded its latest rally.
Clues from futures positioning were already sending smoke signals. Leveraged short exposure has risen to a three-year high, likely reflecting a mix of hedging activity and speculative bearish bets against the Nasdaq. Asset managers are also becoming less bullish, with gross long exposure falling for a second consecutive week from arguably stretched levels, dragging net-long exposure lower. While short exposure remains relatively low, it too increased for a second week among this group of traders.
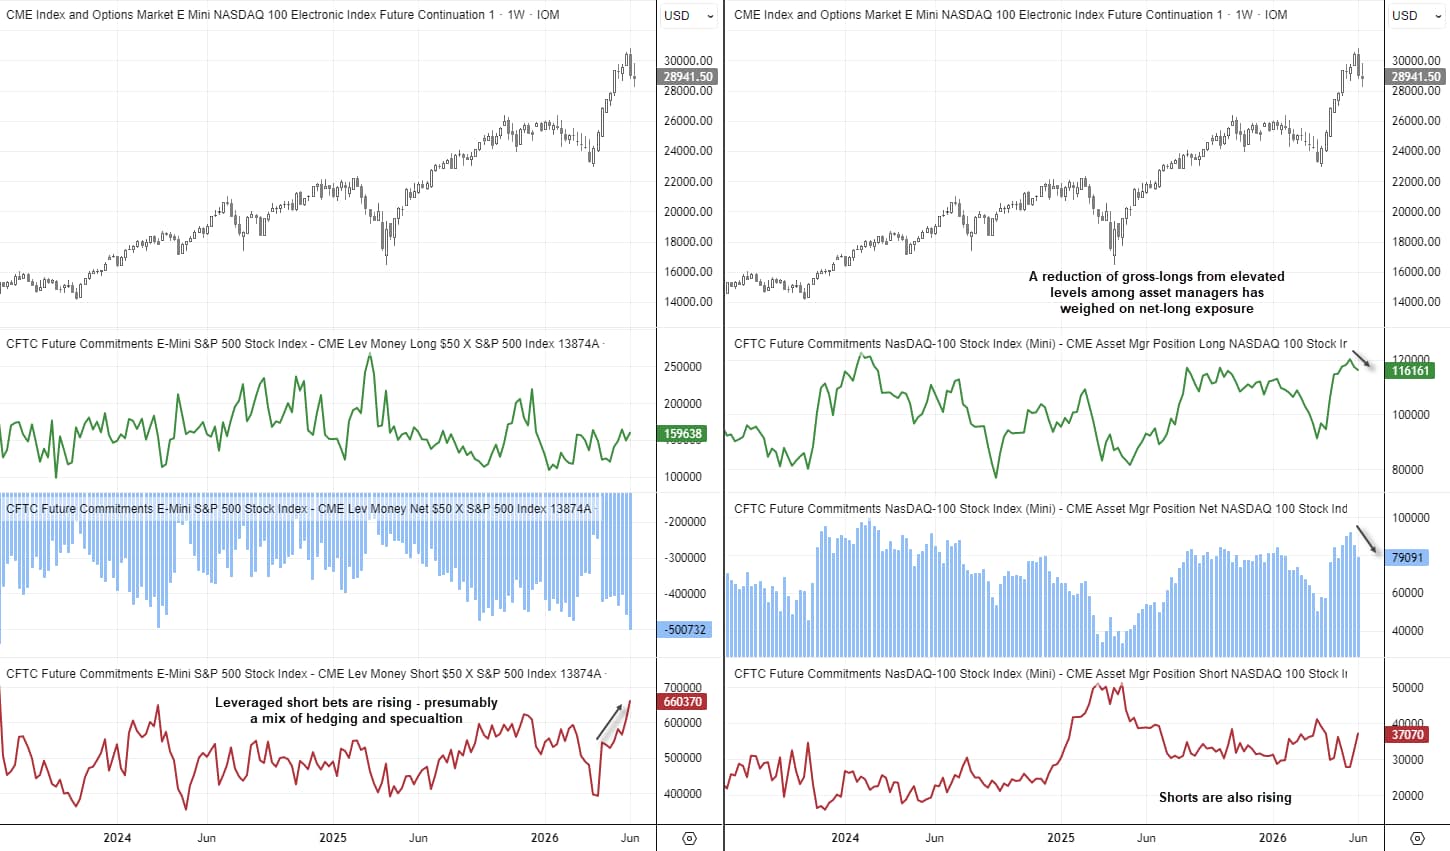
Source: CME, LSEG
The daily chart shows that a wide-legged doji formed on Tuesday, finding support at the 50-day EMA. Given that bulls managed to recover most of the session's earlier losses, I am inclined to suspect the Nasdaq could remain supported over the near term, and perhaps a cheeky bounce is due.
However, if we have only witnessed the initial A-wave of an ABC correction, further losses could arrive after any such bounce. In that scenario, a break below the 28,227 low would suggest a deeper correction is underway. Note that the April VPOC, October high and 50% retracement level all reside around the 26,800 area. The 100-day EMA near 27,200 and the 38.2% Fibonacci retracement level at 27,808 could also provide support along the way.
The 4-hour chart shows that Tuesday’s low also respected the monthly and weekly S1 pivot levels. Prices are consolidating within a tight range, and retracements into Tuesday’s lower H4 wick could tempt bulls seeking a mean-reversion move higher towards the weekly and monthly pivot levels around 29,500.
Needless to say, 30,000 remains an obvious target for bulls and a key area of interest for bears seeking another leg lower.
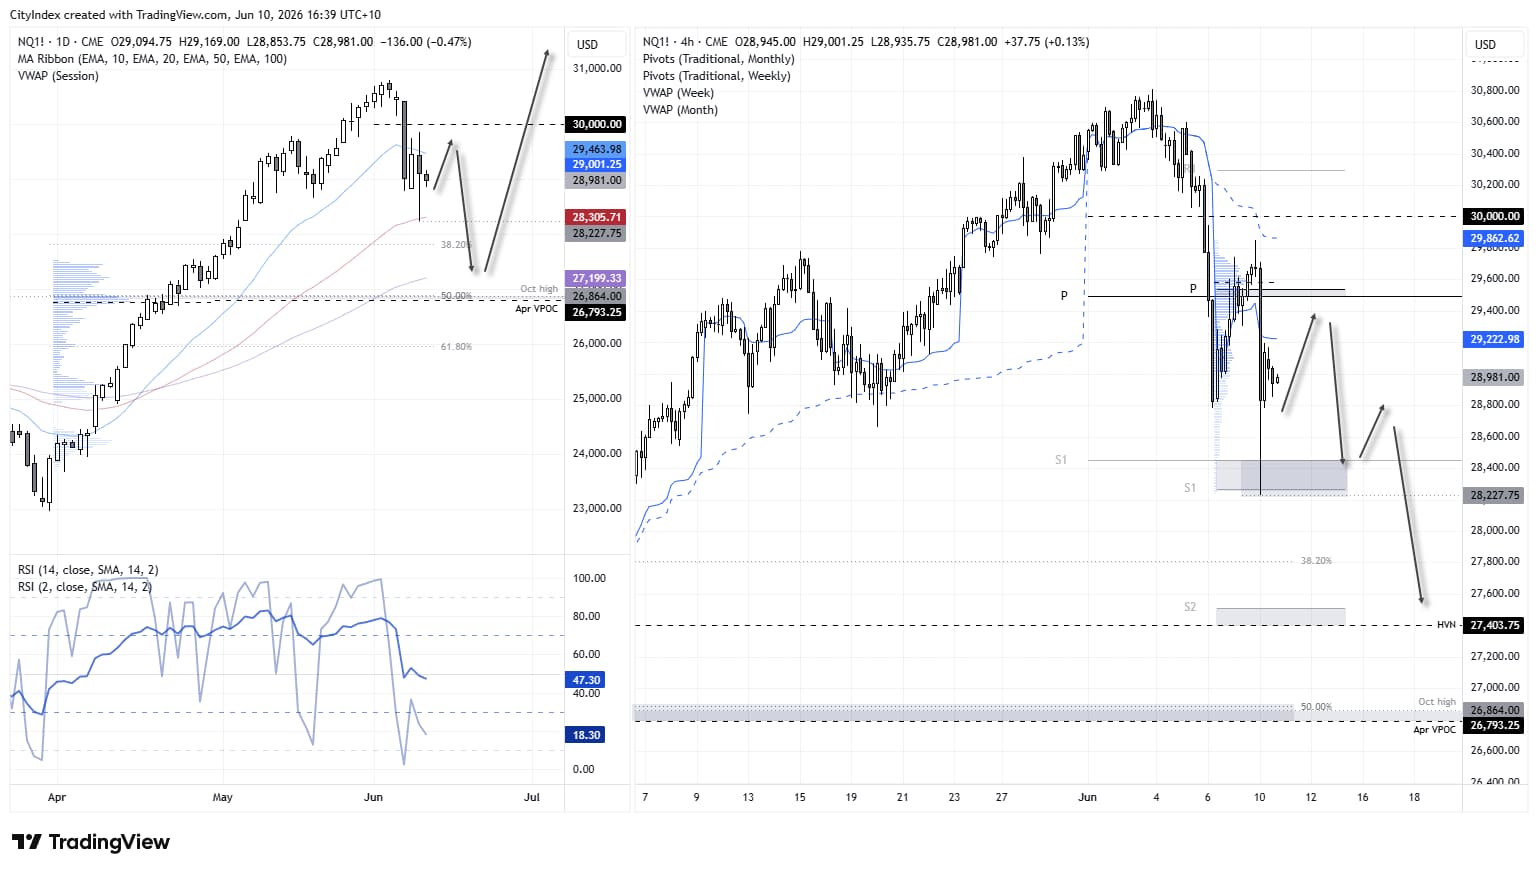
Source: ICE, TradingView
The subsidiaries of StoneX Group Inc. provide financial products and services, including, but not limited to, physical commodities, securities, clearing, global payments, risk management, asset management, foreign exchange, and exchange-traded and over-the-counter derivatives. These financial products and services are offered in accordance with the applicable laws in the jurisdictions in which they are provided and are subject to specific terms, conditions, and restrictions contained in the terms of business applicable to each such offering. Not all products and services are available in all countries. The products and services offered by the StoneX Group of companies involve risk of loss and may not be suitable for all investors. Full Disclaimer. This content is not intended for residents of any particular country, and the information herein is not advice nor a recommendation to trade nor does it constitute an offer or solicitation to buy or sell any financial product or service, by any person or entity in any jurisdiction or country where such distribution or use would be contrary to local law or regulation. Please refer to the Regulatory Disclosure section for entity-specific disclosures. No part of this material may be copied, photocopied or duplicated in any form by any means or redistributed without the prior written consent of StoneX Group Inc. The information herein is provided for informational purposes only. This information is provided on an ‘as-is’ basis and may contain statements and opinions of the StoneX Group of companies as well as excerpts and/or information from public sources and third parties and no warranty, whether express or implied, is given as to its completeness or accuracy. Each company within the StoneX Group of companies (on its own behalf and on behalf of its directors, employees and agents) disclaims any and all liability as well as any third-party claim that may arise from the accuracy and/or completeness of the information detailed herein, as well as the use of or reliance on this information by the recipient, any member of its group or any third party.
© 2026 StoneX Group Inc. all rights reserved.
Our subscribers have access to comprehensive market analysis from StoneX spanning commodities, equities, currencies and more.
Nasdaq 100 volatility surges after an 8% pullback, while futures positioning data suggests traders were already preparing for risk.
This daily commentary delivers a concise, expert-driven overview of global futures markets, designed for traders and investors seeking actionable insights. Each edition covers the technical setups, and trade recommendations across major commodity contracts, including grains, livestock, metals, energy, currencies, and equity indices.


A wave of trillion-dollar technology listings is creating a new test for global capital markets. As artificial intelligence companies seek public funding at unprecedented valuations, investor attention is shifting from growth potential to the market's ability to absorb massive new equity supply.

Our market expertise, advanced platforms, global reach, culture of full transparency and commitment to our clients’ success all set us apart in the financial marketplace.
Reach
With access to 40+ derivatives exchanges, 180+ foreign exchange markets, nearly every global securities marketplace and numerous bi-lateral liquidity venues, StoneX’s digital network and deep relationships can take clients anywhere they want to go.
Transparency
As a publicly traded company meeting the highest standards of regulatory compliance in the markets we serve, our financials and record of accomplishment are matters of public record. StoneX’s commitment to “doing the right thing over the easy thing” sets us apart in the industry and helps us build respect, client trust and new partnerships.
Expertise
From our proprietary Market Intelligence platform, to “boots on the ground” expertise from award-winning traders and professionals, we connect our clients directly to actionable insights they can use to make more informed decisions and achieve their goals in the global markets.