July 24 – The S&P 500 is trading at another record high at mid-day with the Nasdaq in the green as well, but slightly below Monday’s record, while the Dow Jones lags the other major indexes to trade slightly lower. Meanwhile, the VIX has continued to cool, dipping below 15 for the first time since February. The dollar is up on the day after three straight losing sessions to start the week, trading just below 97.4 at the time of writing. Treasuries are also up slightly at mid-day, with 10-year yields trading just above 4.40% and 2-year yields trading above 3.91%. Crude oil is looking to wipe out most of this week’s losses as nearby WTI trades up over 1% to hover near $66.20, with most in the trade pointing to optimism regarding trade talks, notably between the U.S. and E.U., though it’s also worth pointing out the Ukrainian drone strike that hit a Lukoil oil depot on Russia’s Black Sea coast near Sochi. The ags are mixed, with corn and KC wheat attempting to cling to small gains, while most others are in the red.
The U.S. manufacturing sector dipped back into contraction in July for the first time in 2025 according to this morning’s release from S&P Global. The Flash Manufacturing PMI in July was pegged at 49.5, down from the 52 seen in June and sharply below analyst estimates of a rise to a 52.7 reading. However, the service sector more than offset the weakness in manufacturing, with the Services PMI spiking to 55.2 from June’s 52.9, sharply above market expectations of a modest decline to 52.7 and marking the highest reading since December. The strength in the service sector led S&P’s Composite PMI to rise to an impressive 54.6 in July, also sharply above market expectations of 52.3 and also marking a high since December.
While today’s PMI data points to a surprisingly resilient U.S. economy, there were also some red flags to take note of as we look ahead. Inflationary pressures rose for both the manufacturing and service sectors in July, with respondents on both sides pointing to both tariffs and rising labor costs. Composite input cost inflation rose at the second-steepest rate since January 2023, while service prices charged saw their second-steepest increase since April 2023. Inflation data has mostly continued to come in below market expectations in recent months, adding further fuel to the doves’ calls for rate cuts, but potential warning signs like this only serve to strengthen the case of the hawks, likely keeping the tension between Trump and Fed Chair Jerome Powell present for the foreseeable future. The market is currently pricing in a 97.4% chance of the FOMC holding rates steady at next week’s meeting, up from the ~95%+ seen yesterday.
New home sales in the U.S. rose slightly in June to a seasonally adjusted annualized rate of 627,000 from the 623,000 seen in May, though this was well below the average trade guess of a more significant rise to 650,000. In fact, this was below even the low-end trade estimate. Regionally speaking, growth was seen in the Midwest (+6.3%) and South (+5.1%) but offset by declines in the West (-8.4%) and Northeast (-27.6%). Today’s disappointing housing data follows yesterday's weaker-than-expected existing home sales as well, continuing to point to softening demand amid ongoing economic uncertainty and high interest rates.
USDA’s flash sale announcement error this morning certainly took the brief wind out of the sails for the corn bulls, initially reporting 135,000 MT of corn sold to China for the ‘25/’26 marketing year before later correcting the destination to be South Korea. An additional total of 284,196 MT of corn to unknown destinations (83,956 MT for ‘24/’25 / 200,240 MT for ‘25/’26) was also reported, with the initial China sale fueling speculation that these sales could be destined for China as well but now losing steam. Regardless, U.S. corn exports remain red hot in the ‘24/’25 marketing year, with both inspections and sales on pace to blow past USDA’s record 2.75-billion-bushel export target, while cumulative new crop (‘25/’26) sales are up 38.1% year-over-year, sitting at their highest level at this time since 2022.
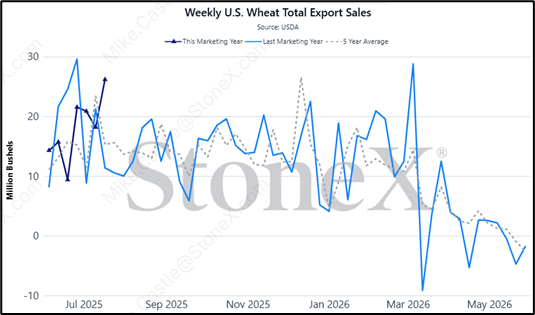
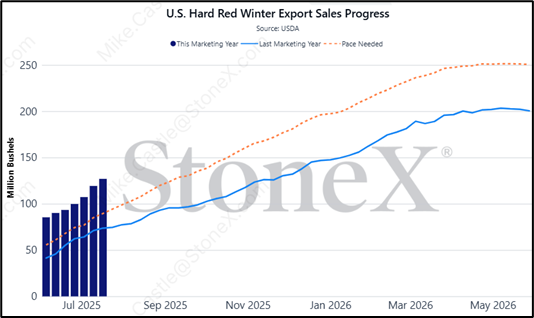
U.S. wheat sales hit their high since early March at 26.2 million bushels (mbu) in the week ended July 17, blowing past the high-end estimate of 18.4 mbu. Indonesia was the featured buyer, followed by Taiwan, and Mexico. By class, hard red spring saw the most demand at 8.7 mbu, followed by hard red winter at 7.6 mbu, white wheat at 7.1 mbu, soft red at 2.5 mbu, and durum at 0.2 mbu. On a cumulative basis, U.S. wheat sales are off to a nice start in the young ‘25/’26 marketing year, now sitting 11.5% ahead of the same time last year. Hard red winter sales have been the hottest relative to typical paces, with cumulative HRW sales now up 72.2% year-over-year, while soft red sales are also up an impressive 20.8% year-over-year.