March 20 – Choppy trade persists in the equities, with the major stock indexes pushing higher through the morning but the S&P 500 and Nasdaq now both in the red at the time of writing while the Dow Jones clings to small gains. The VIX has seen a similar up-and-down pattern, trading as high as 21.2 and as low as 19.3 today but hovering slightly below 20 at mid-day. The dollar put in a roughly two-week high earlier this morning at 104.13 before falling back to hover below the 103.9 level. Treasuries have rebounded from their lows but remain in the red on the day, with 10-year yields at 4.23% and 2-year yields at 3.96%. Crude oil is adding to yesterday's gains, with nearby WTI trading just below the $68 level on rising Middle East tensions and a potential ramp-up in enforcement of U.S. sanctions on Iranian crude. The ags are still mixed on the day, with corn still clinging to small gains and old crop soybean contracts attempting to join the party, though the wheat complex remains solidly in the red.
Existing home sales unexpectedly jumped 4.2% month-on-month in February to a seasonally adjusted annualized rate of 4.26 million, a sharp uptick from the 4.7% decline seen in January and blowing past market expectations of a further slowdown to 3.95 million. This is a surprisingly healthy reading, with analysts expecting to see softening consumer sentiment in February lead to more cautious spending on major purchases, such as buying a home. Lawrence Yun, Chief Economist at the National Association of Realtors who publish this data noted that “more inventory and choices are releasing pent-up housing demand.” Coinciding with this, the inventory of unsold homes climbed 5.1% month-on-month to 1.24 million, representing a 3.5-month supply at the current sales pace. The median existing home sales price rose 0.4% month-on-month to $398,400. This is a 3.8% increase from the same month last year but still marks a 6.7% decline from the all-time high of $426,900 hit last summer.
The Conference Board’s Leading Economic Index declined by 0.3% in February, sharper than market expectations of a 0.2% drop, though January was revised upward from -0.3% to -0.2%. Declining consumer expectations were the largest drag on the index in February, followed by a decline in manufacturing new orders during the month. This continues the trend of forward expectations shifting more negative with the increased uncertainty but observed economic data showing largely better-than-expected results, such as the strong home sales data outlined above.
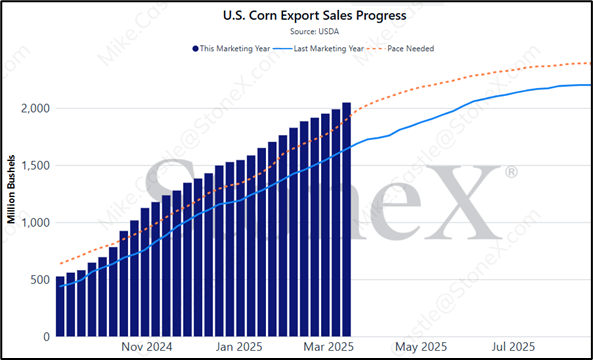
Exporters sold 58.9 million bushels of old-crop corn in the week ended March 13th, a five-week high, while also adding 2.4 million bushels of new crop (‘25/’26) sales. Japan and South Korea were the featured buyers, followed by Mexico who also accounted for the bulk of the new crop purchases. Another week of strong prints on both corn sales and inspections keeps the U.S. sharply ahead of the pace needed to surpass the USDA’s 2.45 billion bushel export target, continuing to raise questions about why this estimate was again left unchanged on the March report, especially given USDA’s own language stating that “the WASDE report only considers trade policies that are in effect at the time of publication.” Conversely, soybean sales were disappointing at only 13.0 million bushels, falling below even the low-end trade estimate of 14.7 million. China was again the featured buyer, accounting for roughly two-thirds of the week’s sales, though unshipped volumes to China continue to dwindle as U.S. sales opportunities near their typical seasonal end as South American harvest progresses. Milo sales came in at 1.1 million bushels, all to Mexico, putting sales to Mexico thus far in the ‘24/’25 marketing year at their fastest pace at this time since the ‘19/’20 marketing year. This is largely a function of absent Chinese demand for U.S. milo, with sales to China at their weakest pace since the trade war impacted ‘18/’19 marketing year.
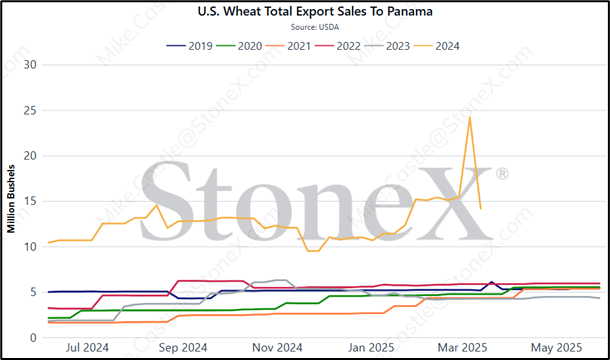
The most eye-catching data point on this morning’s export sales report was the net cancellation of 9.1 million bushels of ‘24/’25 wheat, the worst week of the marketing year by far. That looks very ugly at first glance, though it appears much of this was just fixing a mistake from the week prior in which sales to Panama were massively overstated. Additionally, we saw some shifting around of ‘24/’25 sales to ‘25/’26 sales. New crop (‘25/’26) sales of 18.0 million bushels more than doubled the cumulative ‘25/’26 sales seen in the first 9+ months of the marketing year to now sit at their strongest pace at this time in three years.