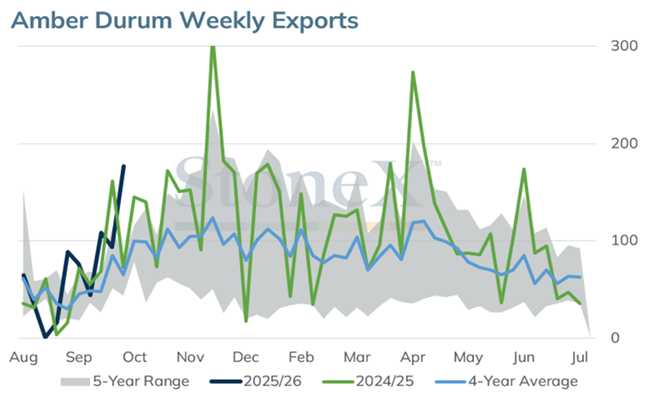
Durum
Market Summary
· Estimating 2025-26 production at 5.7 MMT vs. Stats Canada 6.07 MMT, final Stats Canada estimate will be released Dec 2025
· Carry in was friendly at 500,000 MT
· Large variability in grade patterns this year with quality range of #1 CWAD to Canada Feed account sprouts and low falling number
· Watch for additional short covering as farmer hedging sentiment remains light at this time
· Farmer deliveries are ahead of last year by 154K MT and visible stocks are ample at 679K MT with 47% in export position
· Need fresh export demand with current full year pace at 3.34 MMT
Sales Recommendations
· Will be critical to have composite samples graded for marketing plan and to maximize paper blend or mitigate discounts
· Grade spreads could be subject to widen and premiums could be seen for high quality blenders
· Cash bids have firmed post harvest on light short covering dynamic
· Utilize firm offers above posted bids but within reason
· Consider layering in a hedge for 3 CWAD $7.75, 2 CWAD $8.00 and 1 CWAD $8.25
CGC Week 12 Statistics

Chart of the Month
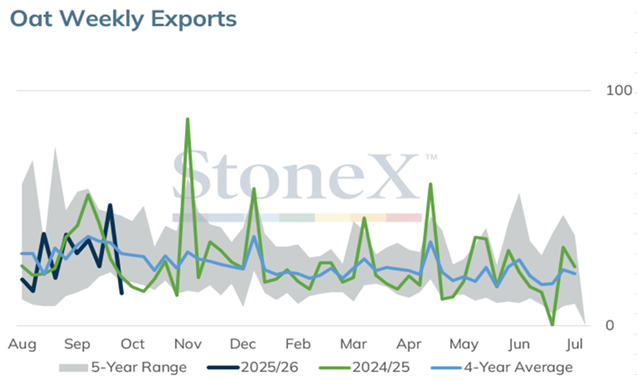
Oats
Market Summary
· Harvest results of generally high quality will help to blend low TW and high thins carried in from 2024-25 crop year
· Yield reports have held strong and generally of high milling quality, rain delays have also downgraded quality in certain geographies
· Processors remain well covered with no nearby bids, current full year domestic pace at 768K MT vs last year final at 936K MT
· Exports are marginally below last year, full year pace at 1.371 MMT against full year benchmark of 1.5 MMT
· Visible stocks are comfortable at 368,500 with 106,400 MT in export position
Sales Recommendations
· Line company bids remain flat as producers look for a delivery outlet with processors covered
· Anticipate bids will stay flat until we see export demand, watch USA direct shippers bid structures
· With harvest complete work back budgets to confirm break even per bushel
· Upside feels limited, focus on storage risk, cash flow & logistics
· $4 to $4.50 target depending on geography
CGC Week 12 Statistics
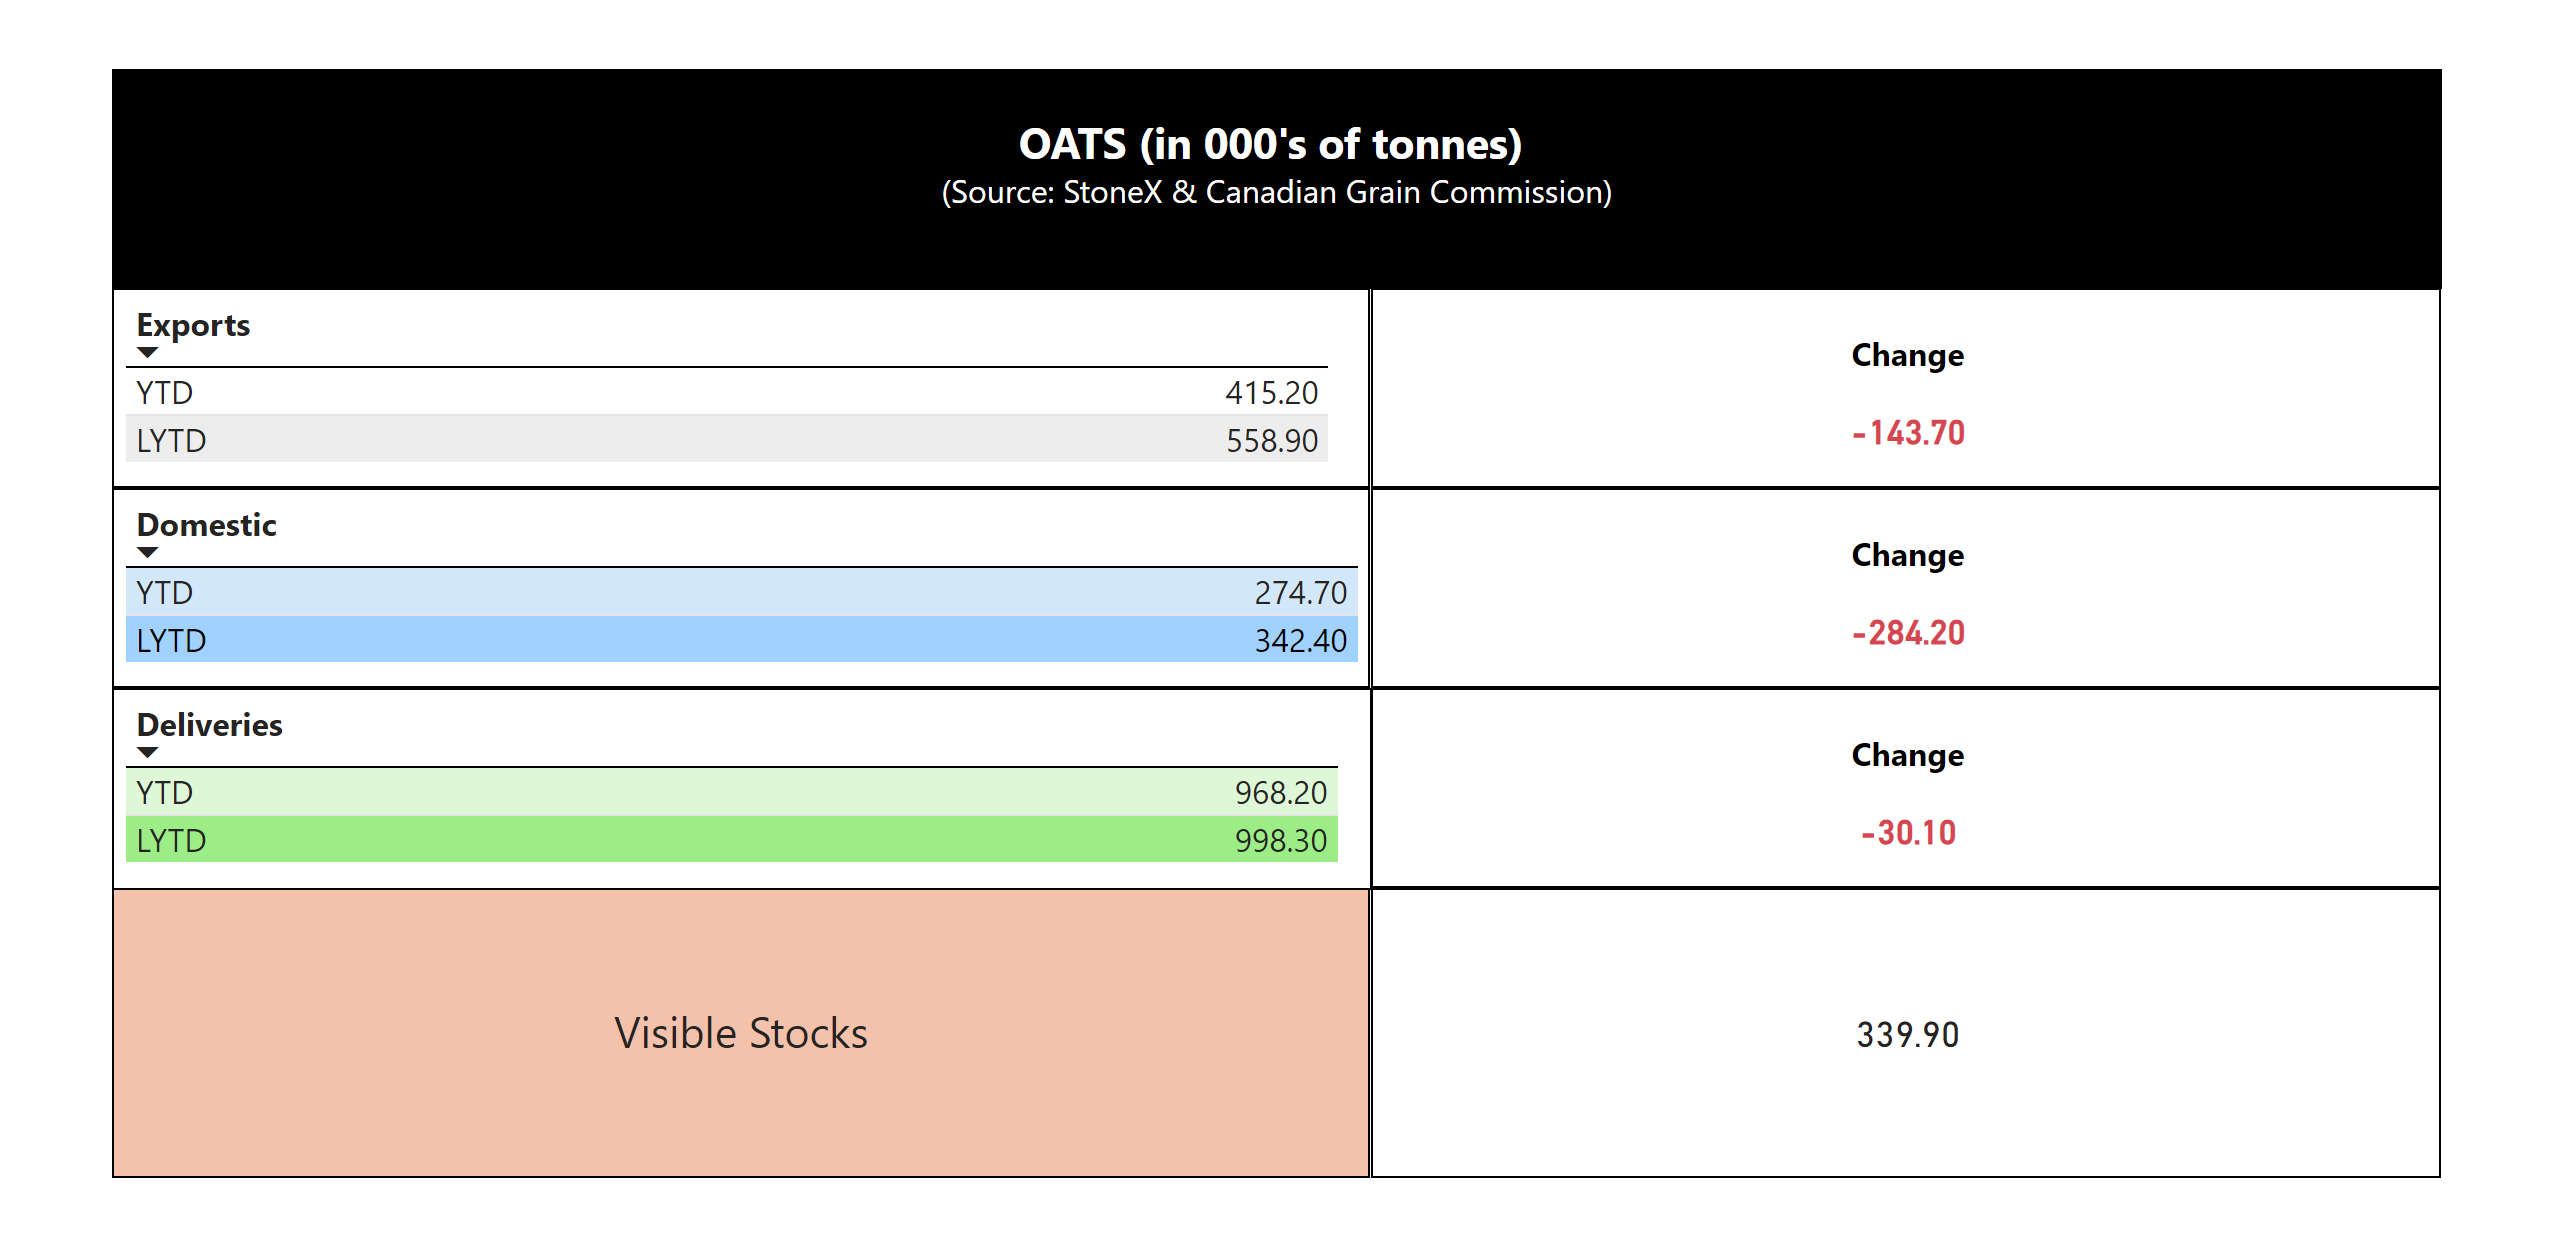
Chart of the Month
Peas
Market Summary
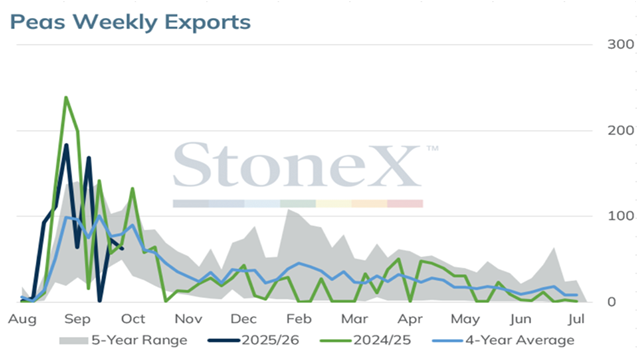
· Exports YTD 817K MT and only 179K MT behind previous year, decent start to crop year considered China 100% import tariff
· India has reinstated 30% import tariff applicable to shipments starting Nov 1st
· Visible stocks are very comfortable at 317K MT, top 2 non tariff destinations remain Bangladesh and UAE
· Will be reliant on export business as domestic consumption is small volume with last years actual at 210K MT
Sales Recommendations
· Bids ebb & flow as market saw firming post harvest and now retracement lower with fresh tariffs in place
· Consider hedging some green peas to capture the premium over yellows, still holding at $3 to $4 per bushel
· Processors have good coverage, watch line company bids as exports will be the feature for demand
· Work back break even per bushel on yellow peas with focus on margins, logistics & cash flow
CGC Week 12 Statistics
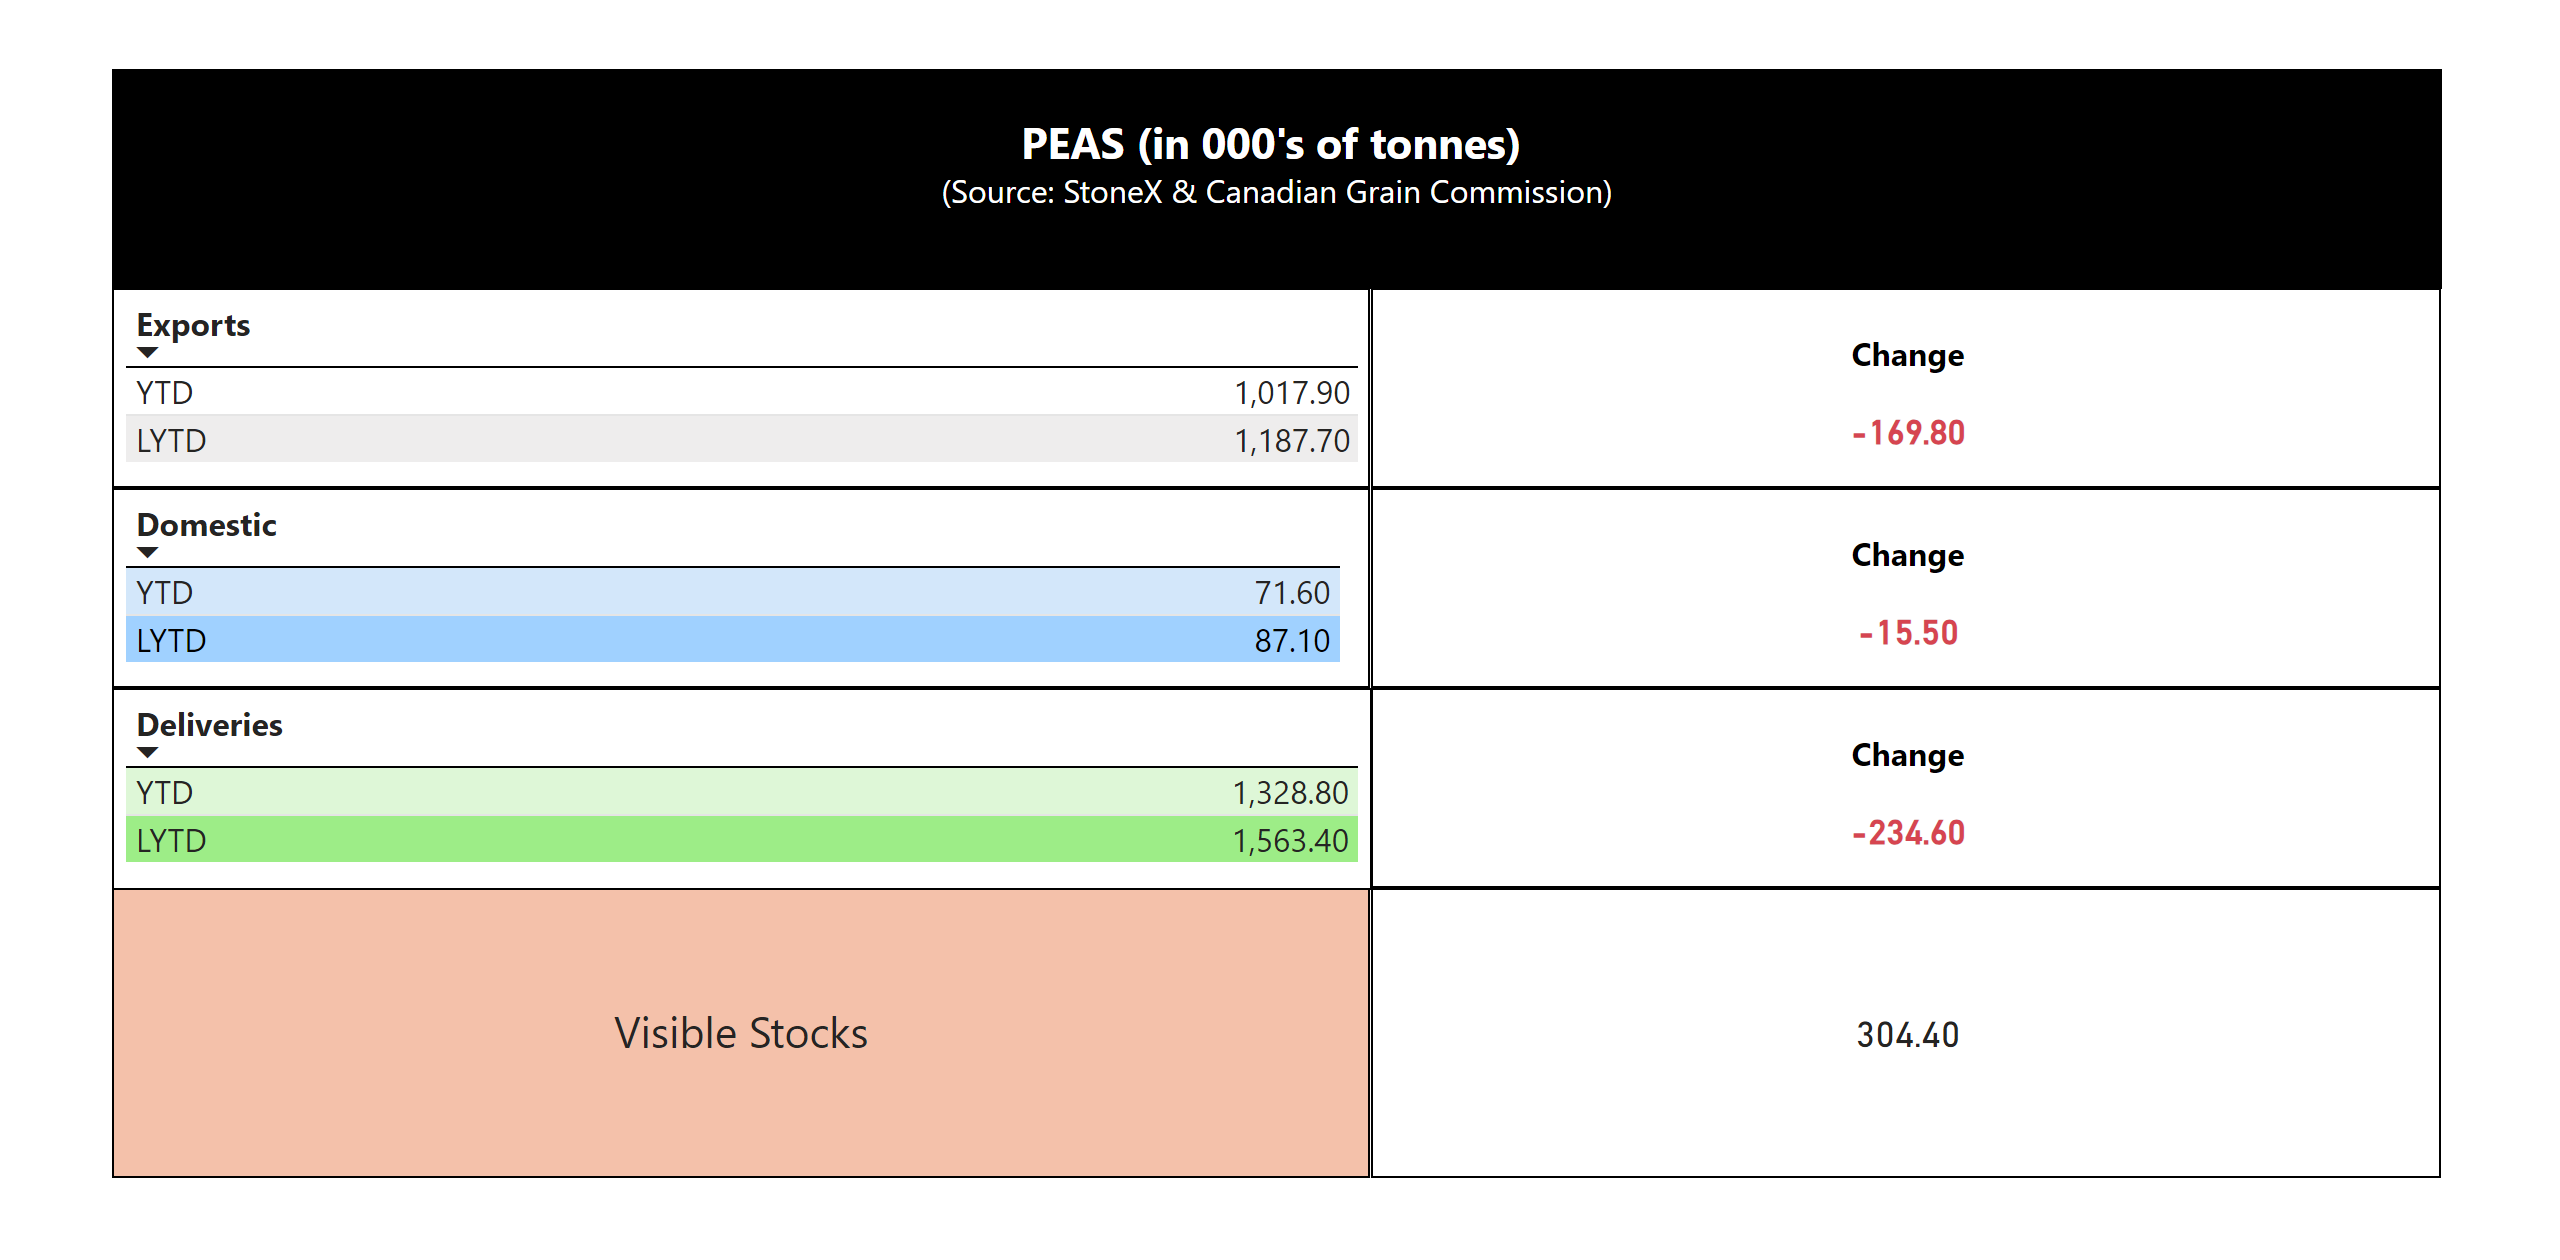
Chart of the Month
Barley
Market Summary
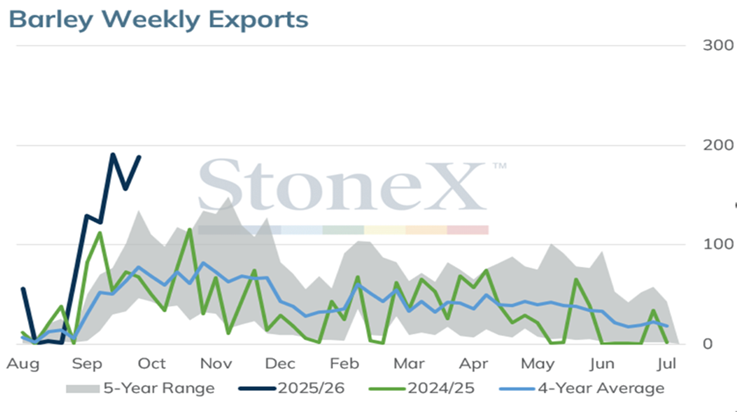
· Swift start to exports for the crop year at 1 MMT vs. 543K MT last year at this time with Japan the featured destination in August
· Feed barley bids remain under pressure as buyers have great coverage and add in feed wheat supplies covering domestic needs
· Most maltsters remain methodical bidding on overage, they can be patient as malt supplies are readily available this year
· Deliveries have also been very steady at 1.469 MMT compared to 1.071 MMT year prior
· Domestic market posting small carry in bid structures into JFM 2026
Sales Recommendations
· Feed Barley –
China will be a feature to watch as they remained top destination for 2024-25 crop year at 1.34 MMT
Would aggressively hedge feed barley for JFM 2026 If margin objectives are met
· Malt Barley –
If you have opportunity to hedge FOB Farm with maltster, would do that prior to demand fading away
If you have existing malt contracts, send samples ASAP to allow maltsters to grade and potentially bid on the balance of production
CGC Week 12 Statistics

Chart of the Month
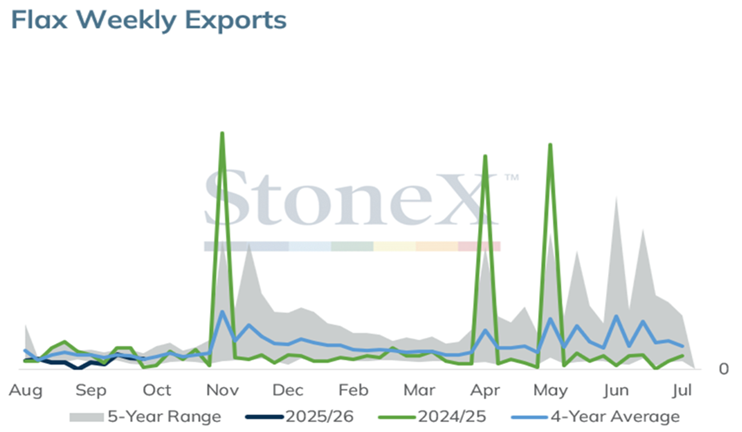
Flax
Market Summary
· Start the crop year on quiet demand again as combined exports and domestic use 17.4K MT vs last year at 20.9 K MT at week 12
· Visible stocks remain an anchor at 33,300 MT currently representing 30 weeks of use
· Belgium is a key feature to watch as exports last year finished at 40,900 MT and higher than USA at 33,300 MT
· This is a big shift in export destinations as USA has been primarily 90% of flax exports
· Note that with export shift to Belgium, the 2024-25 full year exports finished at 74.9K MT vs. 88K MT year prior, so trade flow change
Sales Recommendations
· Bids have been relatively flat with little carry into deferred windows
· End users posting premiums over exporters however anticipate full year demand flat and this represents good opportunity to hedge
· Would aggressively hedge both brown and yellow flax to capture demand & delivery window against anticipated flat bid structure
· Know your instore grades and specs, seeing some max dockage specs as well as Glyphosate Free premiums
· Would suggest to be 75% hedged on old crop flax
CGC Week 12 Statistics

Chart of the Month