

AU Consumer and Business Confidence Feels the Heat of RBA Hike Bets
Australian business and consumer confidence deteriorate as RBA hike expectations fuel concerns over rates, jobs and household spending.

Matt Simpson
- Currencies
By: John Kicklighter, Head of Market Research
While there were a few highlights of volatility this past week, the broader markets managed to maintain this risk-on oriented stability. Can optimism hold fast – much less expand – amid an escalating US-Iran war and the first wave of AI company earnings?
Talking Points:
The prevailing winds of speculative confidence that have kept the markets on course for its broader capital market advance since the recovery from the ‘Liberation Day’ tariff swoon in April last year – including through the initial outbreak of the US-Iran war – are still in place. However, concern and scepticism are finding greater purchase across the capital markets as thematic fundamental engines like the euphoria behind an industrial AI value pivot meet greater scrutiny, while headwinds from the ongoing war and souring traditional macro backdrop build. Referring to generalized seasonal averages, we are traversing a period that has skewed towards calm via volume and volatility, which in turn has supported a positive investment bias. That said, complacency is not a strategy and can lead market participants to invite greater exposure – and ultimately losses - than they would otherwise tolerate if actively surveil market conditions. It’s always better to actively monitor.
In the ‘holy trinity’ of analytical techniques (fundamentals, technicals and market conditions), we are attempting to establish forecasts of direction and temperament for a large and convoluted market driven by many conflicting motivations. Market conditions – a reflection of participation and the general demeanor of the masses – seems to still endorse general complacency, even if there has been an increase in the bolts of volatility. The fundamental backdrop also seems to be in a state of transition but still favoring the promising elements. This is the kind of environment where technical analysis can help anchor the messy perspective of sentiment into tangible shifts in capital flows. Notably, at the end of this past week, we were met with a meaningful retreat from the major US indices – the inspirational leaders of risk appetite. The Nasdaq 100 offered the most impressive move with a break to five-week lows. That said, June’s low is still in place; and its major counterparts were far less pressed on signaling a tipping point. The S&P 500 dropped comfortably to the middle of its multi-month range while there is debate that can be had that Dow Jones Industrial Average may not have even broken its bullish trend and is only a week (and less than 2 percent) off its record high.
Chart of Nasdaq 100 Overlaid with Inverted VXN Volatility Index (Daily)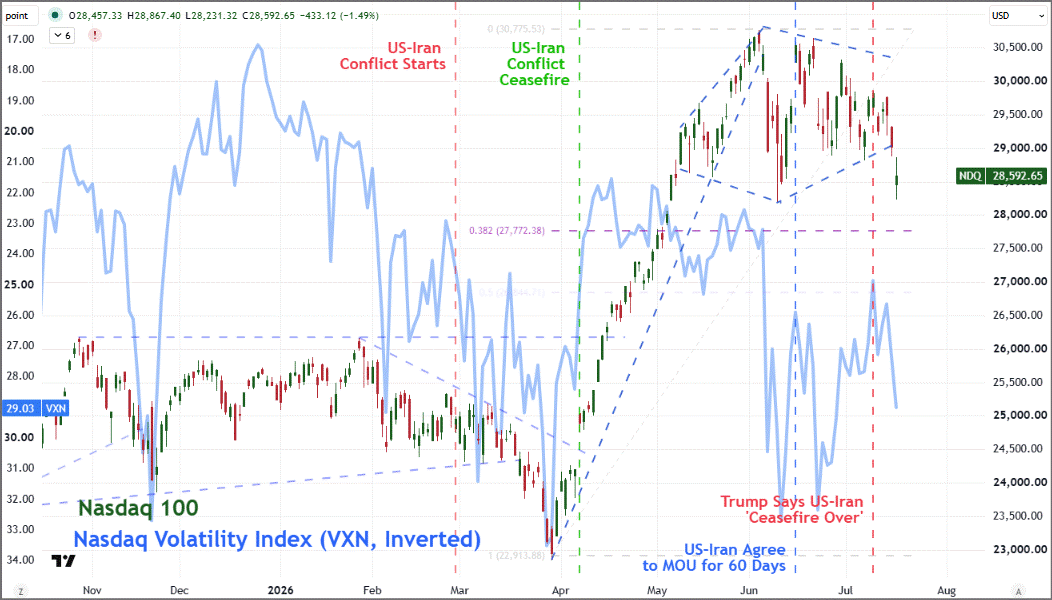
Source: TradingView.com; John Kicklighter
There is a reason to look to ‘risk’ benchmarks with a heavy optimism tendency, as with the major US equity indices, as a higher order measure of global intent. Referencing these more stubborn benchmarks may not provide the timeliest signal that conviction is rolling over from ‘bulls to bears’ or ‘greed to fear’, but it can help reduce the false signals from more sensitive and/or representative measures. That said, there has been a corrosion in market conditions behind the strong façade presented by the Nasdaq 100. Setting aside the fundamentals for a second, there have been notable shifts in markets and capital that can signal tentative concern and others that speak to greater risk taking. The retreat in AI/tech proxies relative to other more diversified speculative benchmarks undercuts one of the areas of open-ended interpretation of untapped value in the markets. The Nasdaq 100 – Dow ratio has reversed more than half its 2026 bull leg, a 21 percent climb from trough to peak. Meanwhile, record options volume levels belie a speculative turnover not denoted in the underlying. That should be a point of concern considering FINRA has reported that US investors have built up a record level of ‘leverage’ through its June update and amid reports that 1.2 million retail traders received margin calls amid the KOSPI’s extraordinary (over 30 percent peak to trough) reversal within the last month.
US Investor Leverage as Measured by FINRA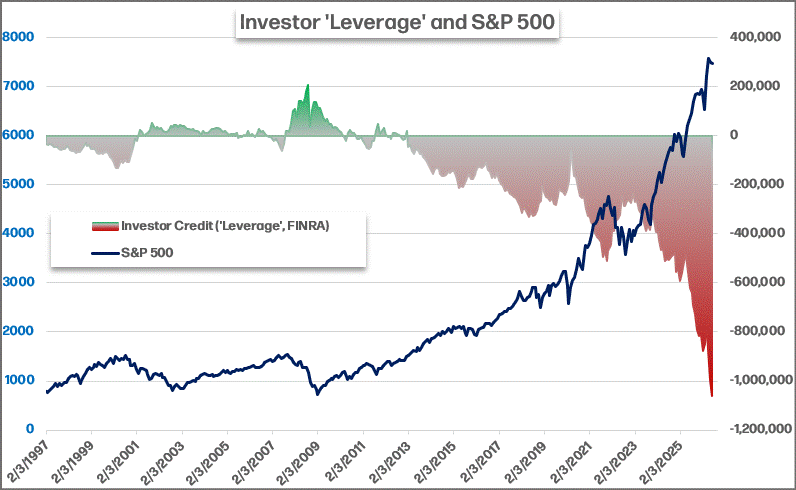
Source: Standard & Poor’s; FINRA; John Kicklighter
If we were to see market conditions shift such that there is greater deference given to ‘bad news’ versus ‘good’ and volatility counter seasonal norms, then the deep fundamental channels should that we have seen dominate headlines these past months should be our focus. The retreat in confidence surrounding AI’s transformative value potential is arguably the greatest threat to this last bull leg’s fundamental thesis. Looking to an even more concentrated view of this theme than the Nasdaq 100 – Dow ratio, the PHLX Semiconductor Index – Nasdaq 100 pairing has pulled back as much as -17 percent in the past month, the largest drawdown in the 138 percent climb since the Liberation Day low (April 2025). We have seen other hits to AI darlings both at the core and in the periphery recently. At the symbolic center of South Korea’s KOSPI tumble, SK Hynix, which just recently started trading in US markets, has lost -37 percent in value on a close-over-close basis from June 22nd to this past Friday. IBM collapsed a record -25 percent in a single day this past Tuesday on an pre-earnings announcement that the company mistimed its AI efforts to show tepid results for extraordinary spending. How many other companies with massive Capex outlays are going to inevitably disappoint against more critical calculations by investors? Firms like Google and Tesla will wade into these waters this week.
Chart of the Nasdaq 100 to Dow Jones Industrial Average Ratio (Daily)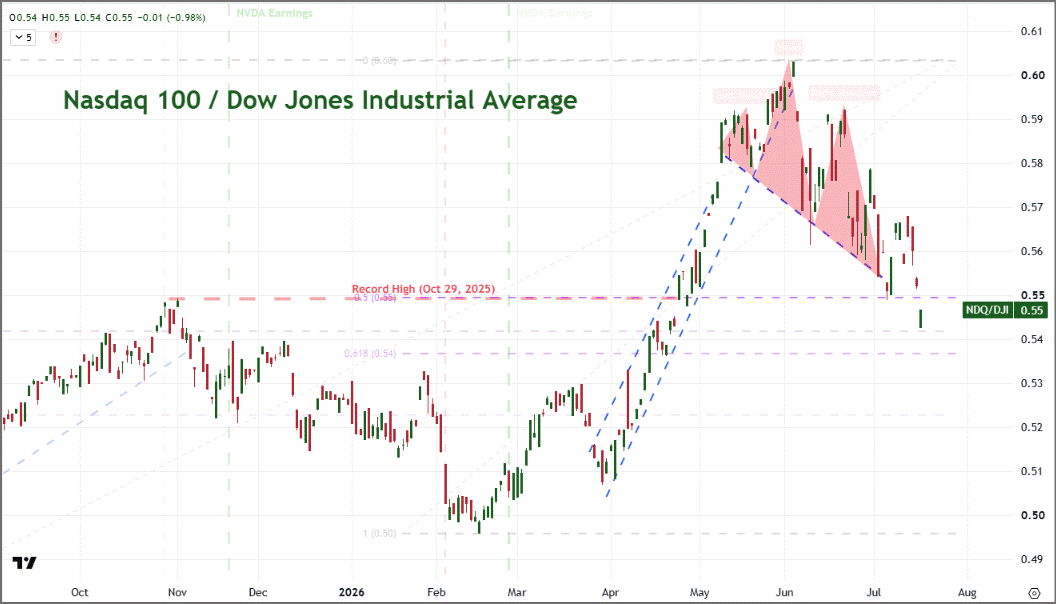
Source: TradingView; John Kicklighter
Where AI is a bull’s theme that is at risk of losing traction, the trouble around the resurgence of the US-Iran war is a bear’s beacon that threatens to crowd out other interests that market participants may pursue. The rhetoric and military engagement between the two countries has only intensified through this past week. Iran threatened to shift from a ‘defensive’ to ‘offensive’ posture last week, and the US intensified attacks on infrastructure. Despite the tangible actions between the two sides, US (WTI) oil rose only 14 percent and UK (Brent) oil 17 percent last week. That may seem a large advance, but relative to the volatility of previous months, it is remarkably restrained. In fact, implied volatility behind US crude (OVX) is staged at 60 relative to a high of 120 in early March. It isn’t that this war doesn’t represent a tangle threat to global order and economy. Rather there is likely a belief that the White House and Tehran will cease actions soon rather than push each other into a more severe position. For the US, the same ‘economic catastrophe’ President Trump said he was looking to avoid with the MOU – a critical threshold for oil inventories – was not materially improved in the few weeks of ceasefire. Market participants are likely aware that that stop loss is close at hand and assume it will force a resolution – or as the detractors refer to ‘a TACO’.
US Oil Inventories and Weekly Change (Weekly)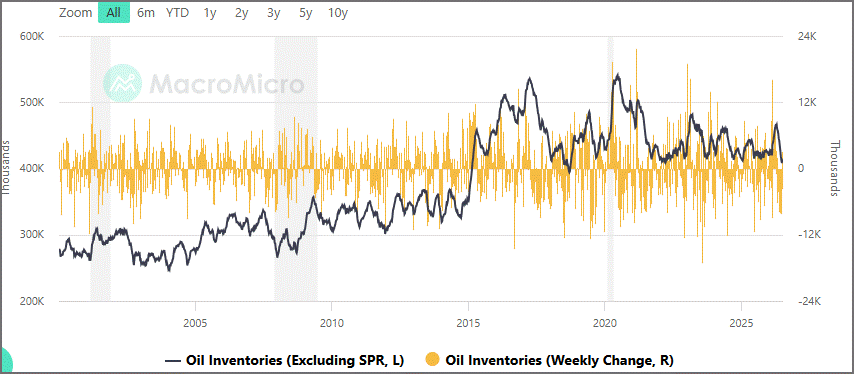
Source: MacroMicro.com; EIA
While we may ultimately see the markets succumb to a major macro theme over time, headlines and iterative market volatility; economic event risk can still play a role in offering definable catalyst to ignite a fire behind more thematic matters. Relative to the US-Iran engagement or AI hope, there is limited offering to provide a meaningful charge. That said, key tech earnings updates and regular weekly oil inventory reports are worth keeping close tabs on. Meanwhile, there is much more on offer that will speak to downstream consequences of the headlines and volatile sentiment we’ve been dealing with. Some central bank decisions, June inflation reports and July PMIs for growth insights gives important insight. For context around reaction to this week’s event risk versus the restricting inflation of anticipation for what’s ahead, the following week’s docket is laden with consequential event risk including higher profile rate decisions (FOMC, BOJ, BOE), official Q2 GDP reports (US, Eurozone) and additional Mag 7 earnings releases among other key listings.
Calendar of Major Macro Economic Event Risk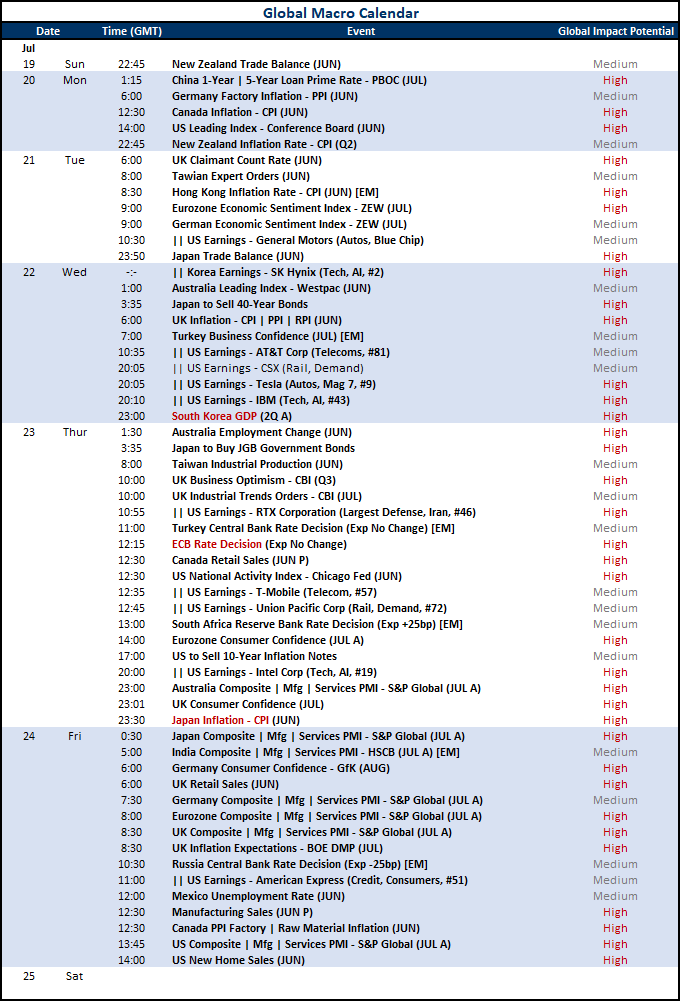
Source: John Kicklighter
Consulting the global macro calendar, arguably the most consequential event risk on tap this week are the AI-focused earnings releases. Given the role this theme has played in lifting the global capital markets, there is a high probability that a consequential move for any of the key listings that triggers a general tech response can cascade into a general risk sentiment response. While the Nasdaq 100 and SOX are good overviews of the health of undercurrent, we should gauge the particular response of a few particular names. Early morning Wednesday, South Korea’s second largest company by market cap, SK Hynix, will report early in the Asia session. Given the extent of its retreat and the recent opening of trading on US exchanges, there will be an even more amplified interest. On the same day, after the New York session close, Google and Tesla will offer the first Mag 7 earnings releases of the quarter. The former is the third largest company by market cap and arguably carries more consequence. However, Tesla has also made an effort to compete in the AI race with Grok and the enormous IPO of Musk’s SpaceX will given another dimension of potential conglomerate building.
Chart of QQQ Nasdaq ETF Overlaid with Google, SK Hynix and Tesla (Daily)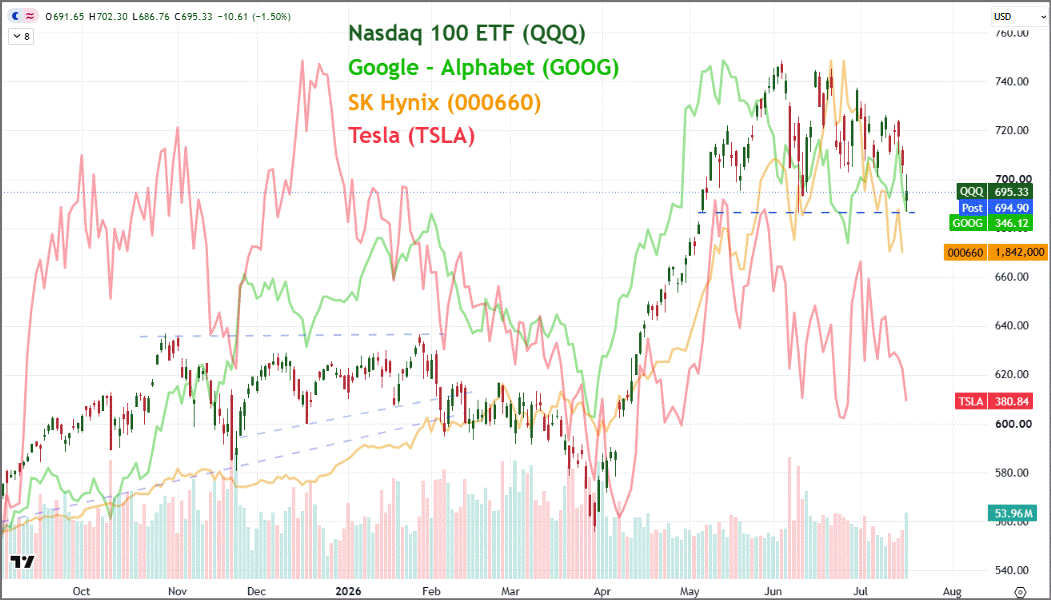
Source: TradingView; John Kicklighter
Among the different, national economic calendars worth keeping track of over the coming week, Japan should be near the top of any global macro-observer’s list. While every nation has is strong and weak points, Japan continues to find itself struggling between its remarkably low yield environment, irksomely persistent inflation, domestic economic struggles, political pressures and its status as a top five economy. In particular, the deflation of the national currency is an unrelenting and prominent issue. The Yen is at multi-decade lows and threatening to tumble lower. For FX observers, that is tracked as (upside) pressure through USDJPY above 160. There are a run of interesting updates we could monitor for influence here from the government’s sale of 40-year government debt, the BOJ buying JGBs on the open market, the June trade balance and the July PMIs on Friday morning. However, I would place the national inflation (CPI) update for last month at the top of the list for attention. With the BOJ rate decision the following week and energy prices back on the rise in July, this data will draw an inordinate amount of scrutiny by policy officials and traders.
Chart of USDJPY Overlaid with US-Japan 2-Year Yield (Daily)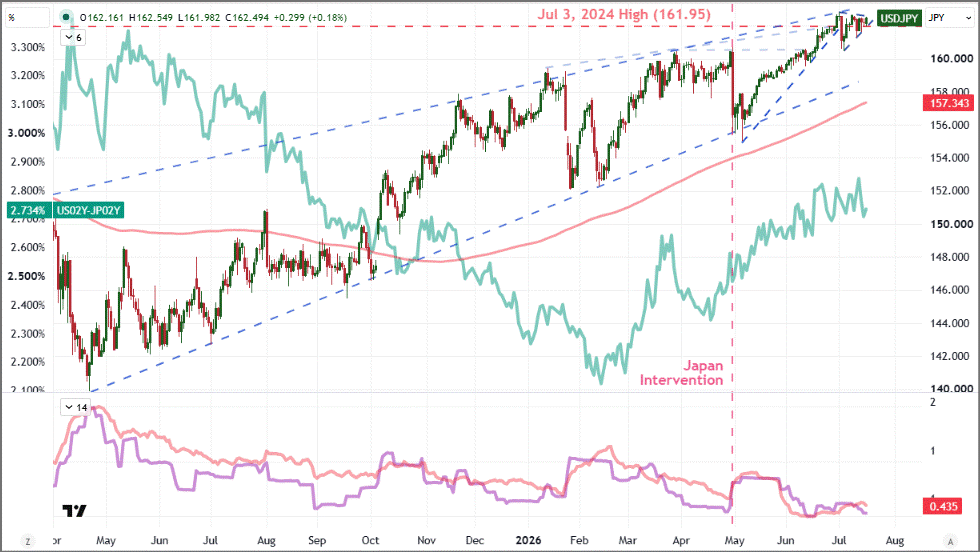
Source: TradingView.com; FRED; John Kicklighter
Timely updates on comprehensive economic readings are few and far between in the global markets. That should make measures like the S&P Global’s monthly PMIs (manufacturing, service and composite) highly value releases with a proportionate market influence. In reality, this data tends to generate limited volatility in FX and local capital markets when they hit the wires. Nonetheless, the historical alignment these timely economic activity updates hold to official and severely lagging government GDP releases should earn our appreciate – even if to just level set practical growth forecasts and not expect the market to amend its immediate course. For these July readings, we should be looking to see if the economic stability registered through the final readings of June (sans the UK which dipped into contractionary territory) holds up amid the resurgence of warn in the Middle East. The survey timely is likely to register some of the resumption of military activity and their downstream consequences, but it would still be early days to assume catastrophe. If the pacing is still steady and stable, it would echo the IMF’s mid-cycle update with a similarly sanguine reading; but beware if the warnings grow suddenly stark.
Major Developed World Economy Composite PMIs (Monthly)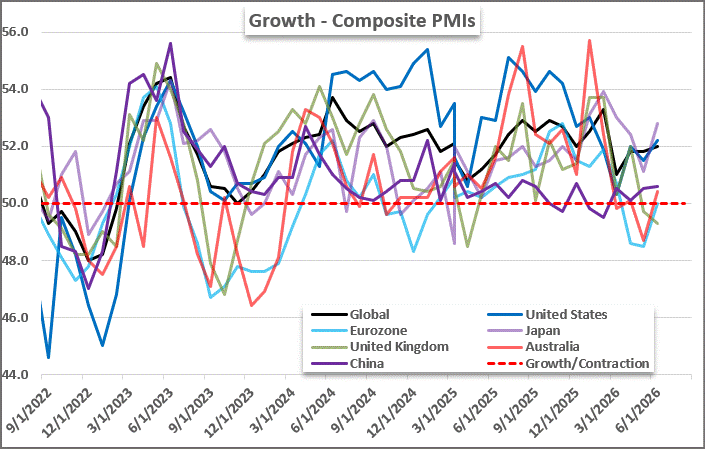
Source: Standard & Poor’s; John Kicklighter
Stay connected to timely global macro analysis designed to help market participants navigate shifting economic conditions and evolving risk. Gain access to regular market commentary, updated quarterly forecasts, a comprehensive two-week forward economic event calendar, and specialized tools built to support informed trading and risk management decisions.
-- Written by John Kicklighter, Global Head of Content
StoneX TV content is created, produced, and distributed solely by StoneX Media Ltd (“StoneX TV”) and is provided for informational and educational purposes only.
StoneX TV does not provide investment, financial, legal, or tax advice and does not make any recommendation or endorsement of any investment strategy, transaction, or financial instrument. Nothing in this content constitutes, or should be construed as, investment advice or a recommendation to buy, sell, or hold any financial instrument, including securities, futures, derivatives, digital assets, foreign exchange products, or CFDs.
This content does not constitute an offer, invitation, or solicitation to engage in any investment activity.
The information presented is general in nature and is not tailored to the financial situation, investment objectives, or risk tolerance of any specific person. You should not rely on this content as a substitute for independent professional advice.
Investing and trading in financial instruments involves significant risk of loss and is not suitable for all investors. Past performance is not indicative of future results.
Any views or opinions expressed are those of the presenter at the time of publication and are subject to change without notice. Such views may not necessarily reflect those of StoneX Media Ltd or its affiliates. StoneX Media Ltd and its affiliates, including StoneX Group Inc., may from time to time have positions in, or engage in transactions involving, the financial instruments referenced.
This content may include general market commentary and opinion. It does not constitute independent investment research and has not been prepared in accordance with legal requirements designed to promote the independence of investment research.
StoneX Media Ltd is not authorised or regulated to provide investment services and does not act in a fiduciary capacity.
StoneX Media Ltd is incorporated in Ireland and operates in accordance with applicable Irish law. It is a wholly owned subsidiary of StoneX Group Inc. and is a separate legal entity from other subsidiaries within the StoneX Group, which may be regulated in various jurisdictions. StoneX Media Ltd does not act on behalf of, or provide services for, any regulated affiliate.
This content is not directed at, and may not be distributed to, any person in any jurisdiction where such distribution would be contrary to local laws or regulations.
Supporting documentation for any claims, comparisons, statistics, or technical data may be made available upon reasonable request, where applicable.
Our subscribers have access to comprehensive market analysis from StoneX spanning commodities, equities, currencies and more.
Australian business and consumer confidence deteriorate as RBA hike expectations fuel concerns over rates, jobs and household spending.

Dollar expected to reflect Brazil's electoral race, US CPI, and IPCA


The yen's two-day surge has dominated the headlines, but the euro, the Australian dollar and gold were all rebounding at the same time. That pattern points to a dollar problem rather than a purely Japanese one, and it changes how the next labor market print should be read.

Our market expertise, advanced platforms, global reach, culture of full transparency and commitment to our clients’ success all set us apart in the financial marketplace.
Reach
With access to 40+ derivatives exchanges, 180+ foreign exchange markets, nearly every global securities marketplace and numerous bi-lateral liquidity venues, StoneX’s digital network and deep relationships can take clients anywhere they want to go.
Transparency
As a publicly traded company meeting the highest standards of regulatory compliance in the markets we serve; our financials and record of accomplishment are matters of public record. StoneX’s commitment to “doing the right thing over the easy thing” sets us apart in the industry and helps us build respect, client trust and new partnerships.
Expertise
From our proprietary Market Intelligence platform, to “boots on the ground” expertise from award-winning traders and professionals, we connect our clients directly to actionable insights they can use to make more informed decisions and achieve their goals in the global markets.