October 2025 Market Seasonality – S&P 500, Nasdaq 100 Enter Bullish Seasonal Phase
October Seasonality Key Talking Points:
- Historically, October has been a strong month for US stocks, with the broad S&P 500 index sporting an average (price-only) return of +1.4% over the last 35 years.
- October has historically been a month where stock market volatility rises, with the VIX index rising by an average of 4.4% since 1990.
- Gold and WTI Crude Oil have may be entering a bearish seasonal phase.
The beginning of a new month marks a good opportunity to review the seasonal patterns that have influenced the markets since 1990.
As always, these seasonal tendencies are just historical averages, and any individual month or year may vary from the historic average, so it’s important to complement these seasonal leans with alternative forms of analysis to create a long-term successful trading strategy. In other words, past performance is not necessarily indicative of future results.
S&P 500 Seasonality – S&P 500 (Price-Only)
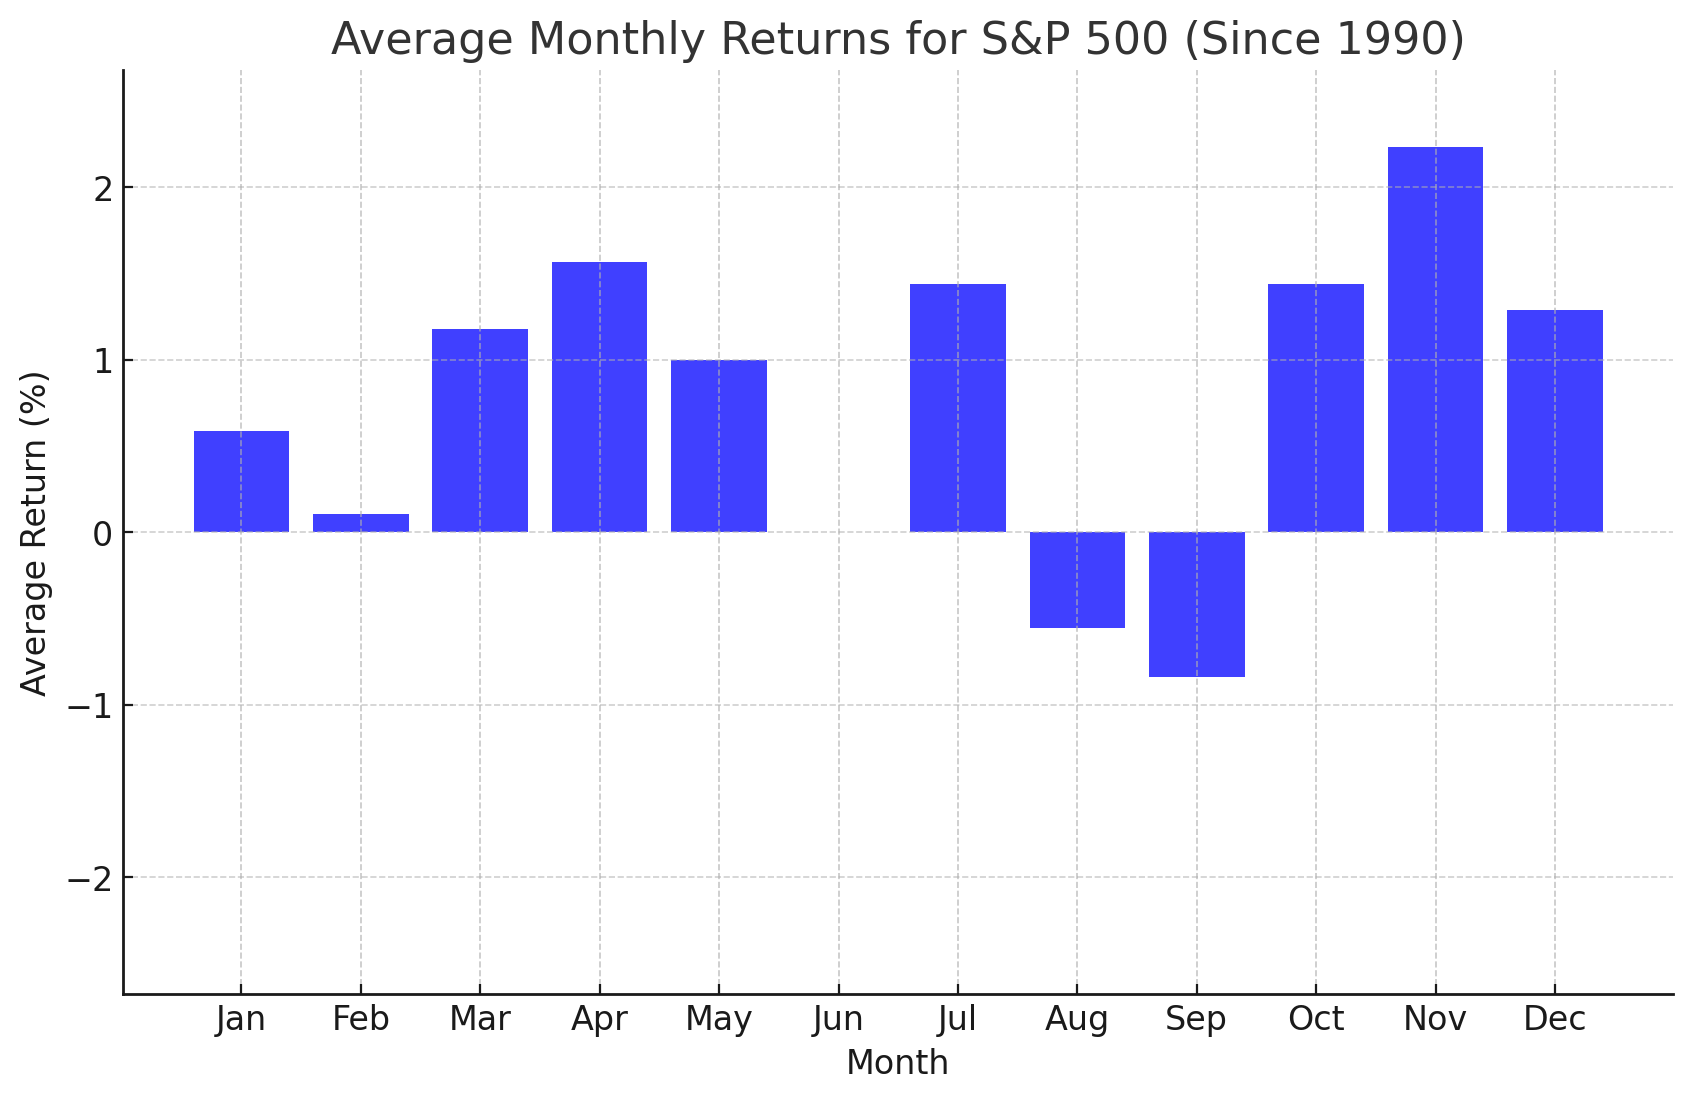
Chart Source: TradingView, StoneX.Please note that past performance is not necessarily indicative of future results.
Historically, October has been a strong month for US stocks, with the broad S&P 500 index sporting an average (price-only) return of +1.4% over the last 35 years. After bucking its bearish seasonality in September (and taking the latest government shutdown in stride so far), its hard to see what could derail the index’s strong uptrend off the April tariff fear trough. Indeed, one of the best arguments against continued gains in the S&P 500 may be that the index has traded higher for the past five months, and markets don’t move in one direction forever.
Nasdaq 100 Seasonality – NDX (Price-Only)
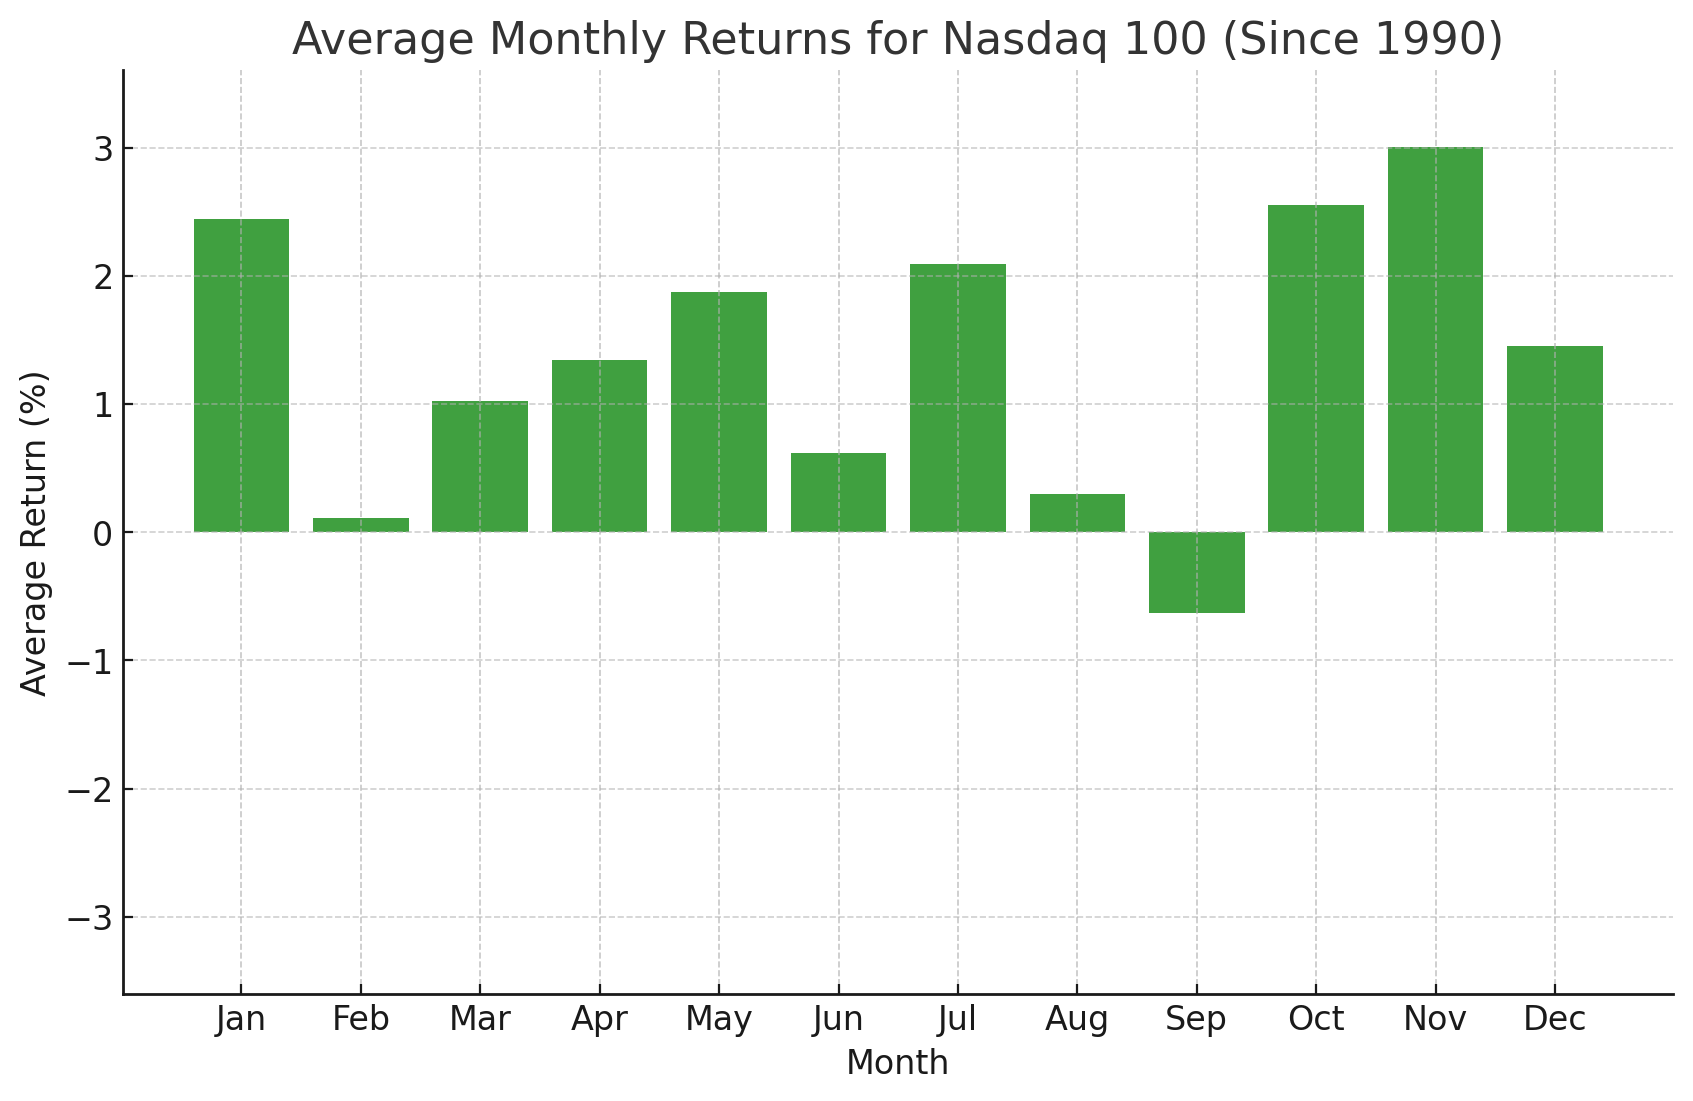
Chart Source: TradingView, StoneX. Please note that past performance is not necessarily indicative of future results.
Looking at the above chart, the Nasdaq 100 has historically seen its second-best performance in October, to the tune of an average gain of +2.5% since 1990. Like the S&P 500, the Nasdaq 100 rallied to record highs in September powering through (now realized) fears of a US government shutdown. Chip giant Nvidia, the largest holding in the index, is back at record highs after a stellar 7%+ gain last month. As goes Nvidia (and the broader AI infrastructure theme as underscored by Oracle’s monster quarterly report), so goes the Nasdaq.
Volatility Index Seasonality – VIX
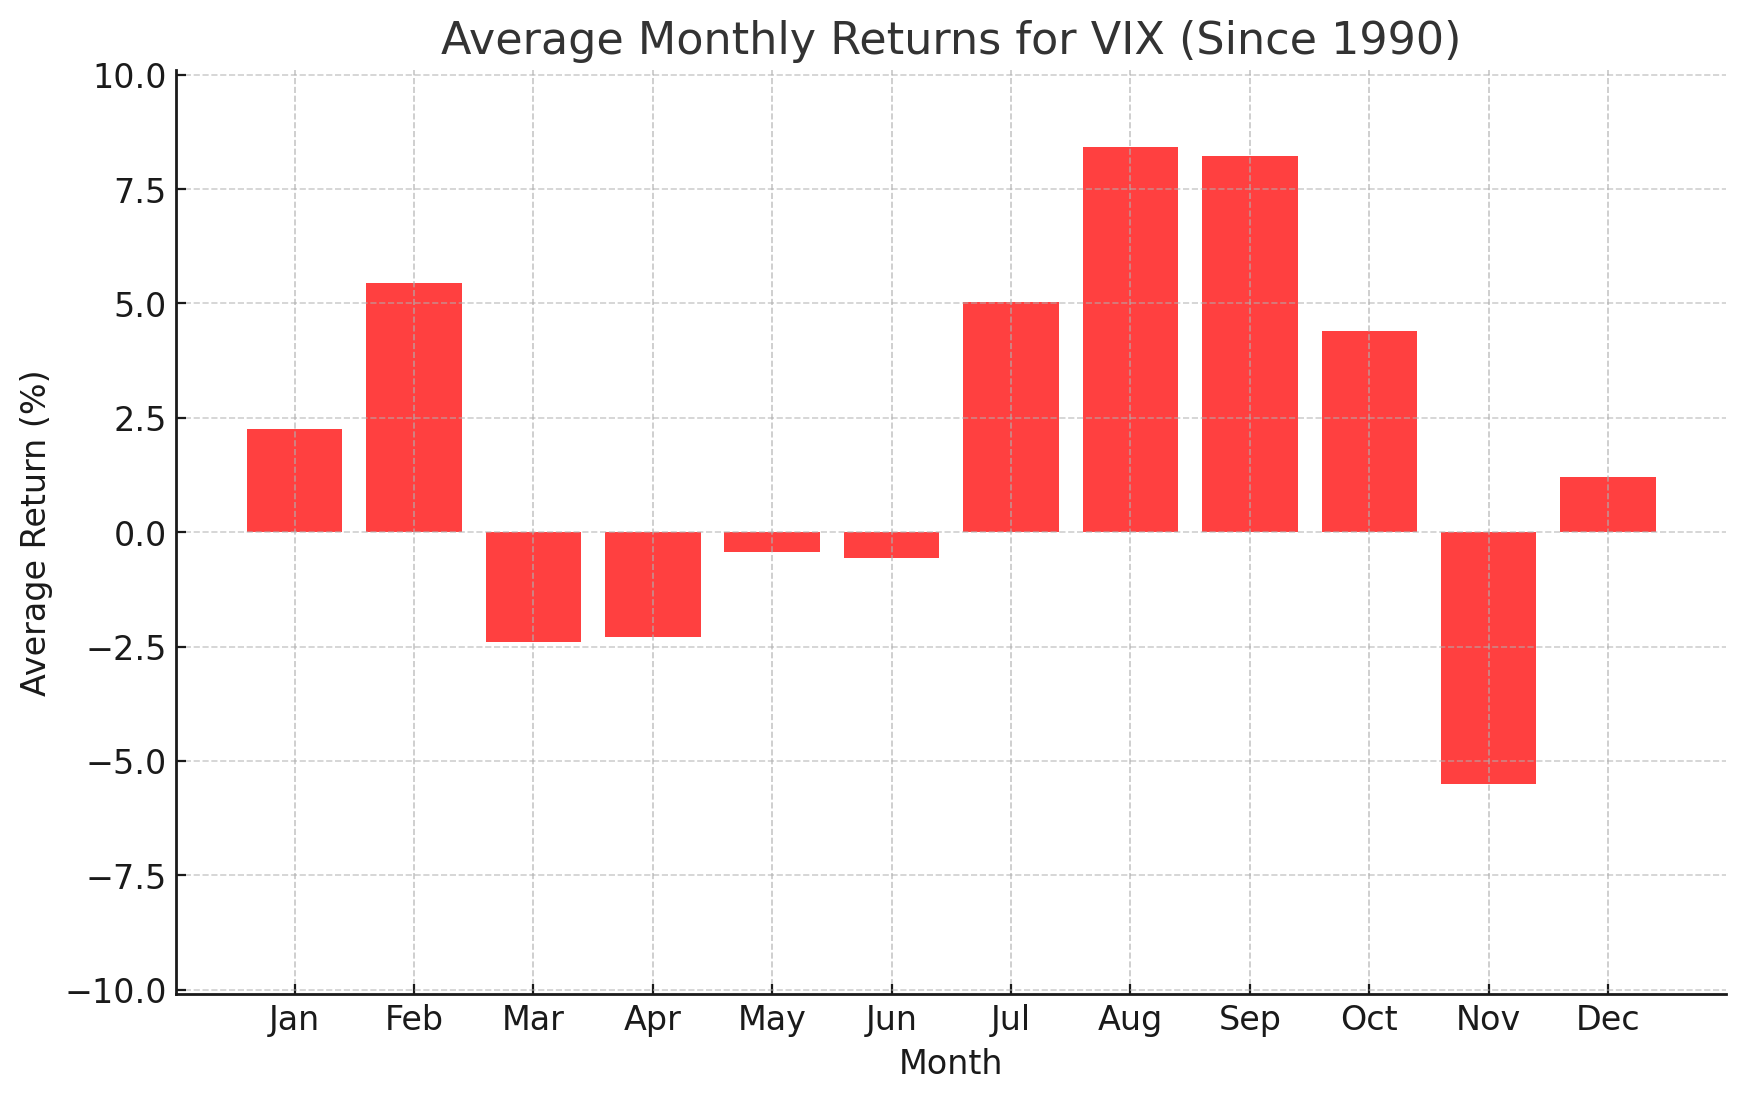
Chart Source: TradingView, StoneX. Please note that past performance is not necessarily indicative of future results.
October has historically been a month where stock market volatility rises, with the VIX index rising by an average of 4.4% since 1990. The VIX finished September essentially unchanged near 16 and has put in a series of “lower highs” dating back to April, underscoring the broad-based compression in volatility. For volatility traders (or any readers trading markets in general), the coming month should be particularly interesting, as Washington navigates the first government shutdown in seven years and investors try to handicap the direction of the economy with postponed economic data.
Gold Seasonality – XAU/USD
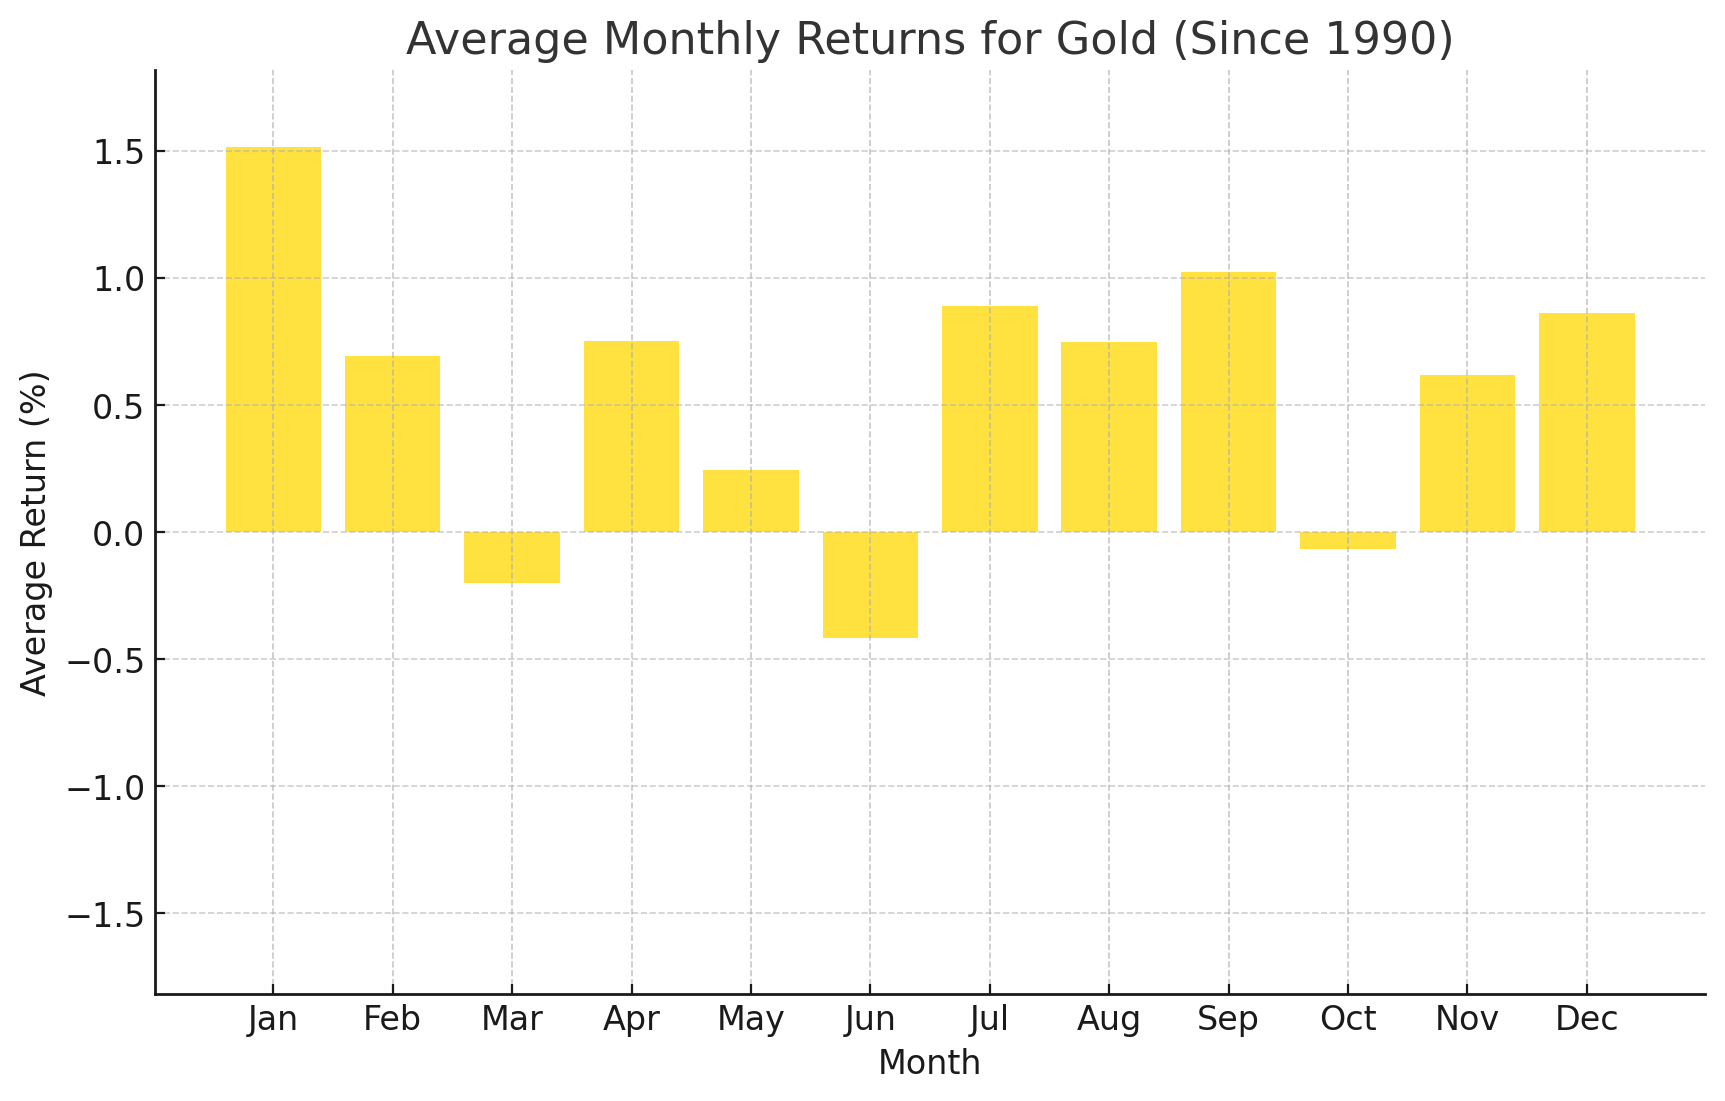
Chart Source: TradingView, StoneX. Please note that past performance is not necessarily indicative of future results.
Turning our attention to commodities, October has historically been a weak month for gold performance, with an average decline of -0.1% going back to 1990, the precious metal’s third-weakest month of the year. After consolidating for five months, gold saw a huge breakout to record highs in September, and traders may now be eyeing up the $4,000 level amidst continued interest rate cuts from the Fed and political dysfunction in Washington.
WTI Crude Oil Seasonality – WTI Chart
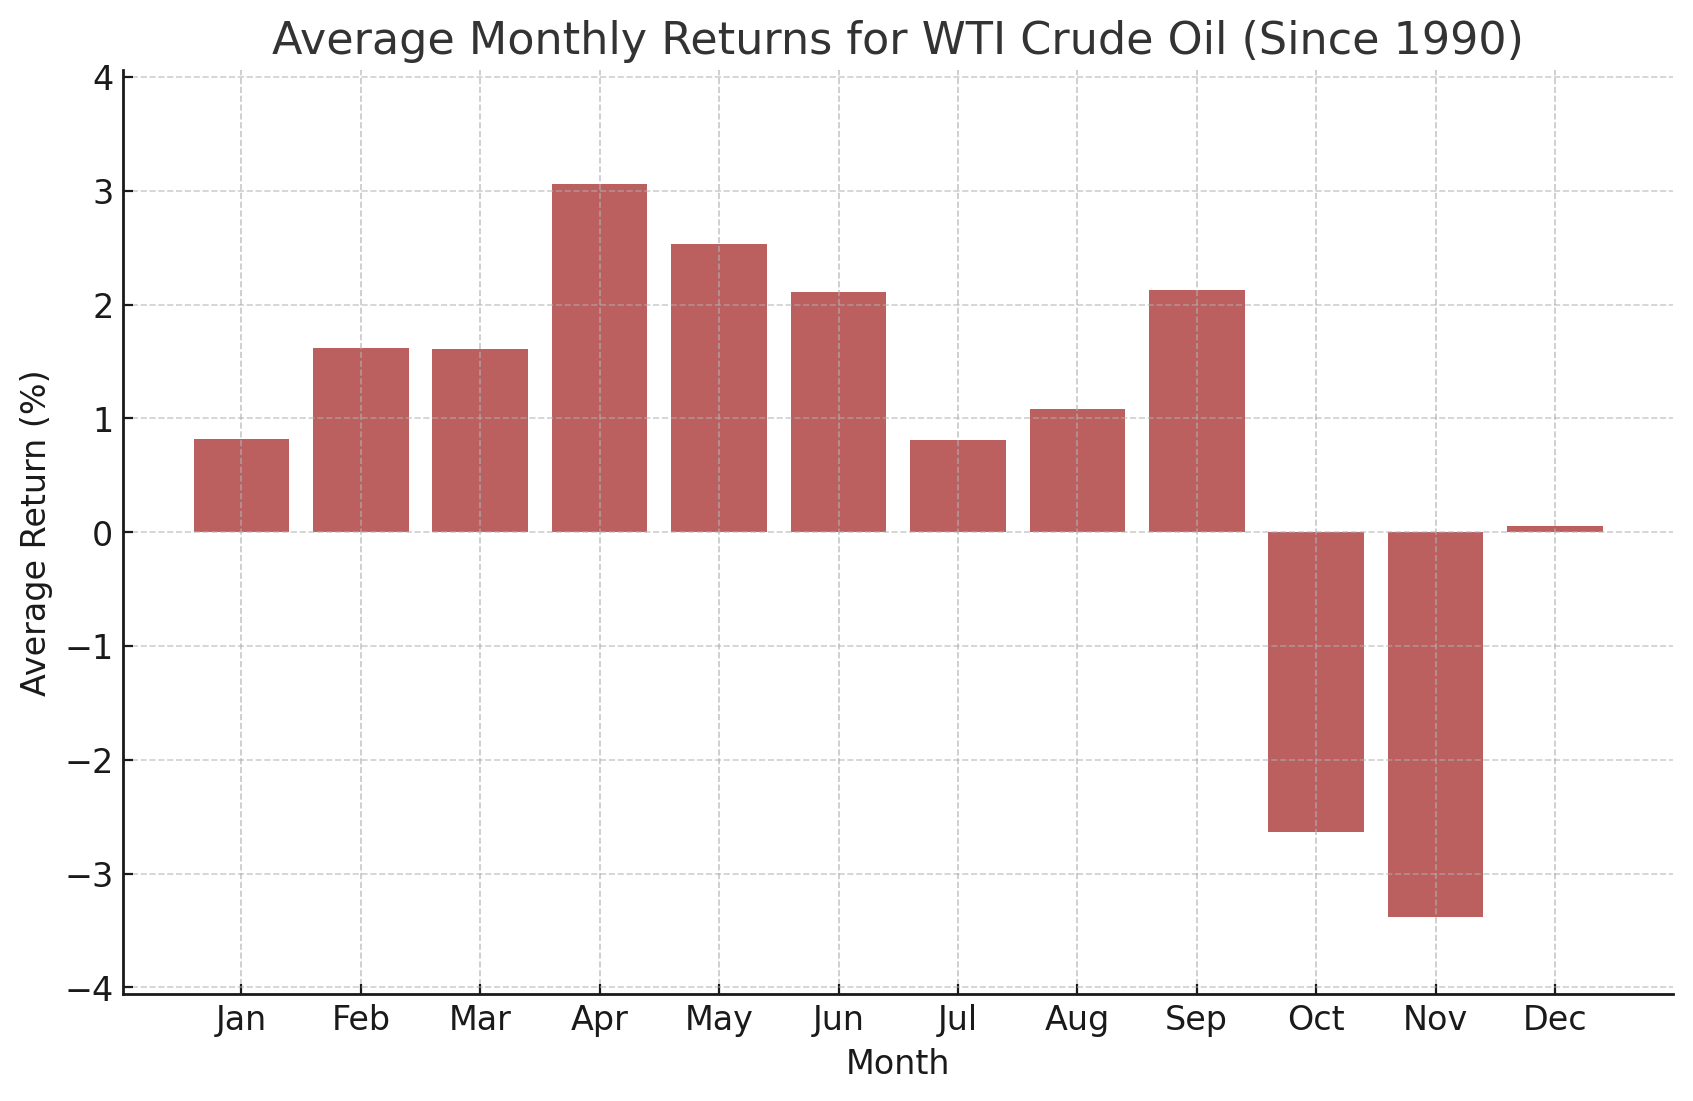
Source: TradingView, StoneX. Please note that past performance is not necessarily indicative of future results.
Last but not least, WTI Crude Oil has historically fell in October, with an average loss of -2.6% over the last 35 years. WTI edged lower in September, remaining below its nearly 2-year bearish trend line. That said, the trend line sits up above $70, leaving room for a meaningful monthly rally if the seasonality fails to follow its historical pattern. For this month, the downside level to watch is near last month’s low in the $62 range, with a break below there potentially setting the stage for a test of 4.5-year lows in the mid- to upper-$50s.
As always, we want to close this article by reminding readers that seasonal tendencies are not gospel so it’s important to complement this analysis with an examination of the current fundamental and technical backdrops for the major markets and the global economy.
Follow the Global Macro Calendar
What are the major events and indicators on tap for the global economy that could charge volatility in markets and reshape deeper fundamental themes? Sign up for the updated Global Macro Calendar updated each week with a two week look ahead of the top events!
Sign Up
-- Written by: Matt Weller, Global Head of Research
StoneX TV content is created, produced, and distributed solely by StoneX Media Ltd (“StoneX TV”) and is provided for informational and educational purposes only. StoneX TV does not provide investment, financial, legal, or tax advice and does not make any recommendation or endorsement of any investment strategy, transaction, or financial instrument. Nothing in this content constitutes, or should be construed as, investment advice or a recommendation to buy, sell, or hold any financial instrument, including securities, futures, derivatives, digital assets, foreign exchange products, or CFDs. This content does not constitute an offer, invitation, or solicitation to engage in any investment activity. The information presented is general in nature and is not tailored to the financial situation, investment objectives, or risk tolerance of any specific person. You should not rely on this content as a substitute for independent professional advice. Investing and trading in financial instruments involves significant risk of loss and is not suitable for all investors. Past performance is not indicative of future results. Any views or opinions expressed are those of the presenter at the time of publication and are subject to change without notice. Such views may not necessarily reflect those of StoneX Media Ltd or its affiliates. StoneX Media Ltd and its affiliates, including StoneX Group Inc., may from time to time have positions in, or engage in transactions involving, the financial instruments referenced. This content may include general market commentary and opinion. It does not constitute independent investment research and has not been prepared in accordance with legal requirements designed to promote the independence of investment research. StoneX Media Ltd is not authorised or regulated to provide investment services and does not act in a fiduciary capacity. StoneX Media Ltd is incorporated in Ireland and operates in accordance with applicable Irish law. It is a wholly owned subsidiary of StoneX Group Inc. and is a separate legal entity from other subsidiaries within the StoneX Group, which may be regulated in various jurisdictions. StoneX Media Ltd does not act on behalf of, or provide services for, any regulated affiliate. This content is not directed at, and may not be distributed to, any person in any jurisdiction where such distribution would be contrary to local laws or regulations. Supporting documentation for any claims, comparisons, statistics, or technical data may be made available upon reasonable request, where applicable.