February Seasonality Key Points
- Historically, December has been a mediocre month for US stocks, with the broad S&P 500 index sporting an average (price-only) return of +0.1% over the last 35 years.
- December has historically been a month where stock market volatility increases, with the VIX index rising by an average of 5.5% since 1990.
- Oil has historically rallied in February, but developments in the upcoming US-Iran talks will be the primary drivers to watch this month.
The beginning of a new month marks a good opportunity to review the seasonal patterns that have influenced the markets since 1990.
As always, these seasonal tendencies are just historical averages, and any individual month or year may vary from the historic average, so it’s important to complement these seasonal leans with alternative forms of analysis to create a long-term successful trading strategy. In other words, past performance is not necessarily indicative of future results.
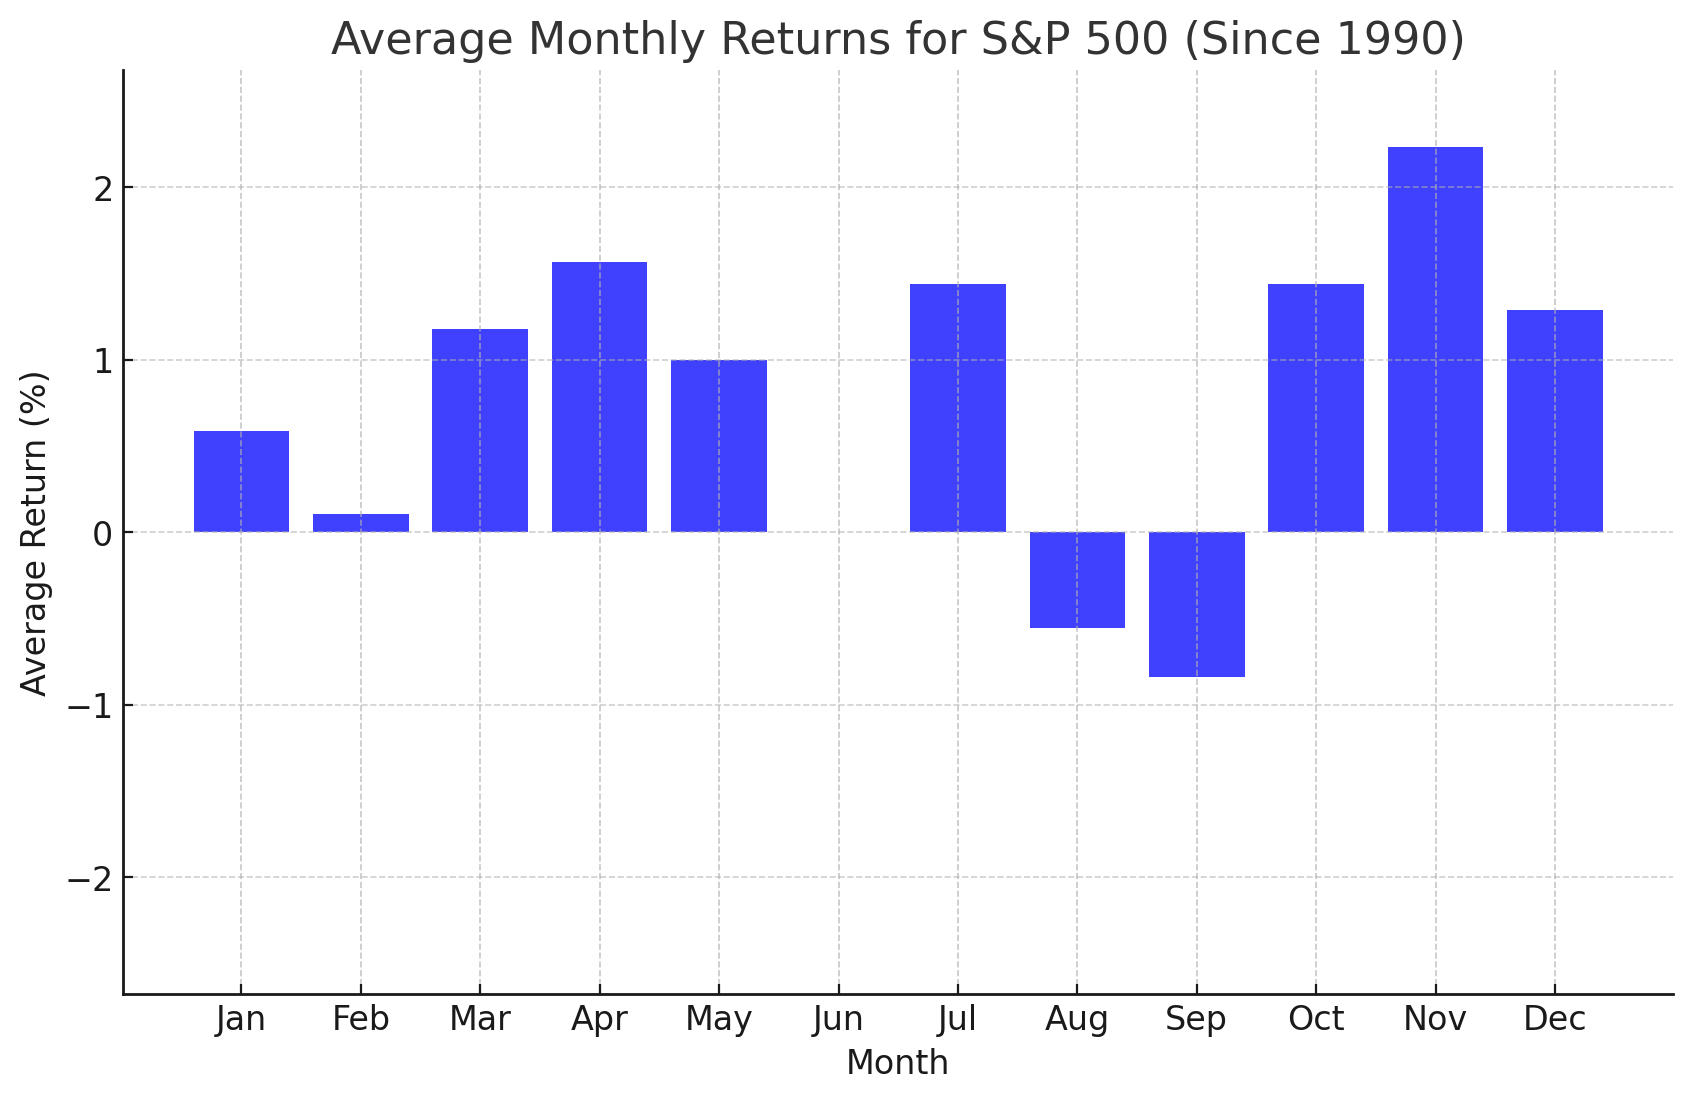
S&P 500 Seasonality – S&P 500 (Price-Only) Chart
 Source: TradingView, StoneX. Please note that past performance is not necessarily indicative of future results.
Historically, February has been a medicre month for US stocks, with the broad S&P 500 index sporting an average (price-only) return of +0.1% over the last 35 years. The S&P 500 got off to a good start to 2026, rising by about 1.3% to set a positive tone as earnings season kicked off. For this month, traders will continue to focus on earnings, highlighted by Alphabet and Amazon later this week, then Nvidia mid-month. More broadly, the AI-powered “Magnificent 7” stocks have seen their bullish momentum waning in recent months as traders rotate back to “real economy” positions, helped along by a strong ISM Manufacturing PMI report yesterday. Traders should continue to monitor this rotation in the coming month as these transition periods can lead to unpredictable volatility.
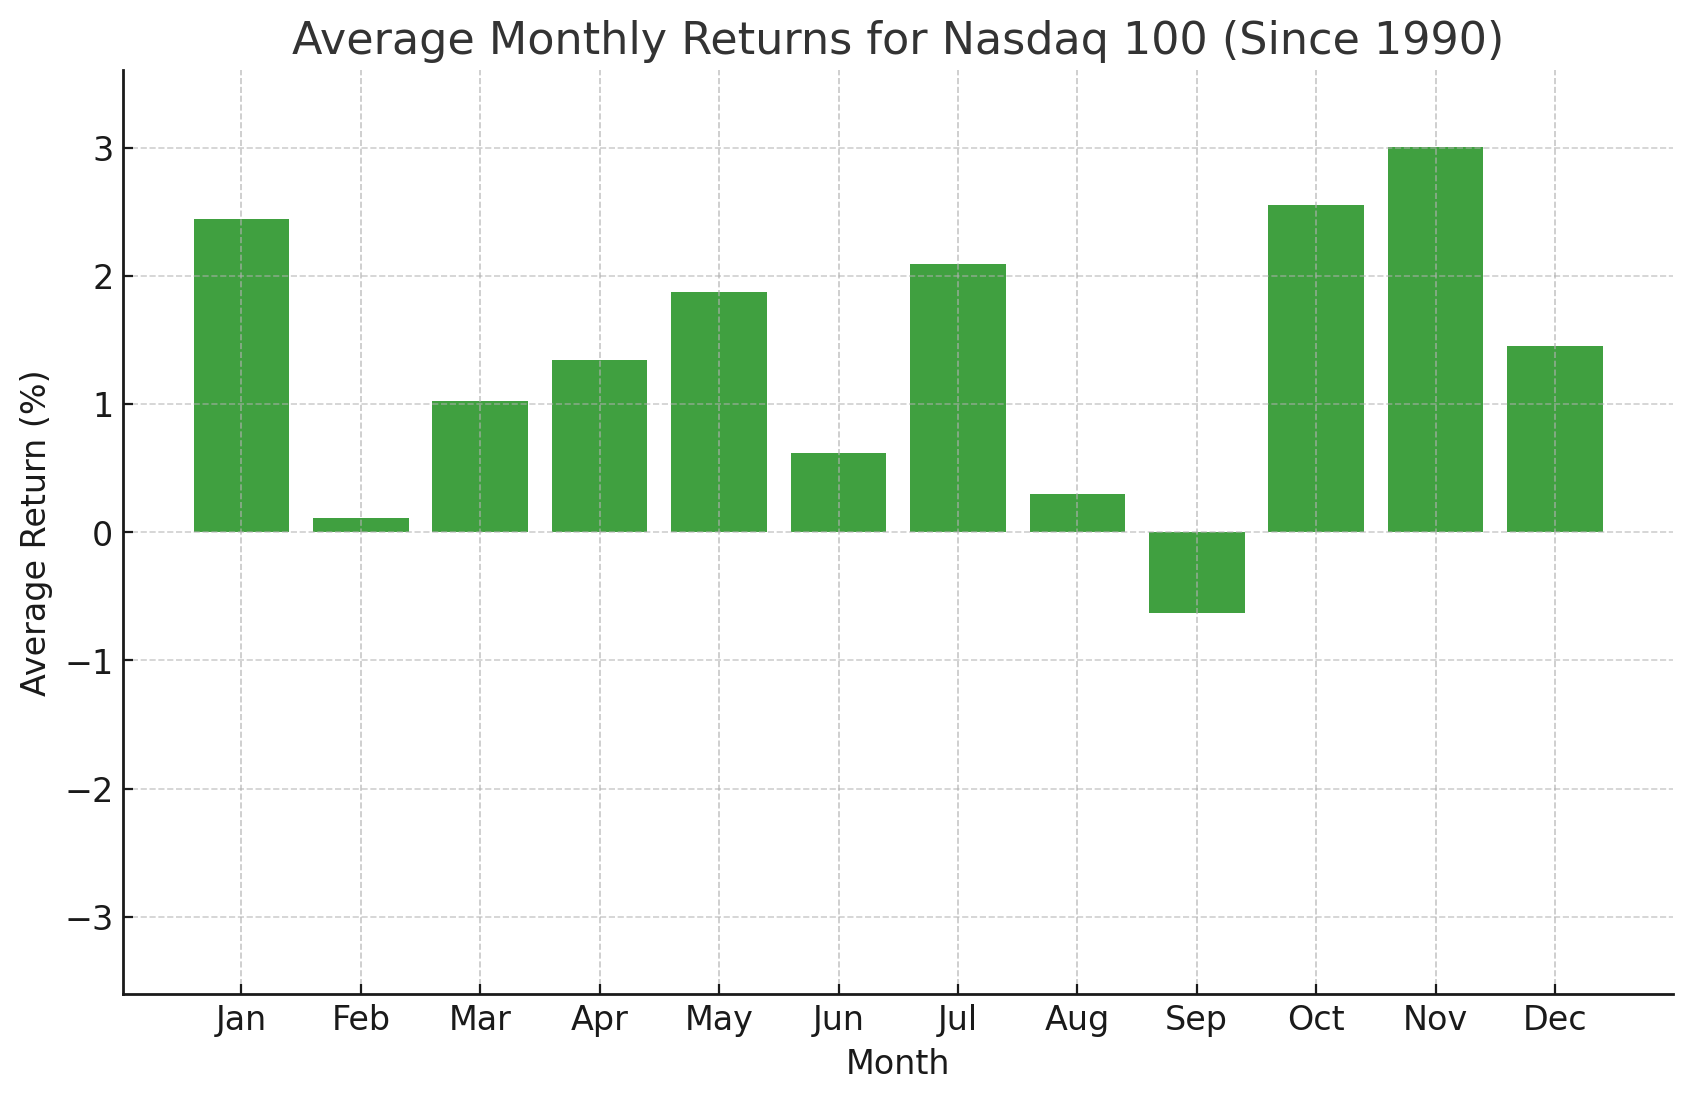
Nasdaq 100 Seasonality – NDX (Price-Only) Chart
Source: TradingView, StoneX. Please note that past performance is not necessarily indicative of future results.
Looking at the above chart, the Nasdaq 100 has historically seen lackluster performance in February as well, to the tune of an average gain of +0.1% since 1990. Like the S&P 500, the Nasdaq 100 edged higher last month, though it failed to durably hit a new record high. With both fundamental and technical momentum declining in the tech-heavy index, traders may want to focus on the Nasdaq 100 if we see a risk-off move to the downside this month.
Volatility Index Seasonality – VIX Chart

Source: TradingView, StoneX. Please note that past performance is not necessarily indicative of future results.
February has historically been a month where stock market volatility increases, with the VIX index rising by an average of +5.5% since 1990. The VIX generally moved higher in January and gapped up to start this trading week and month, suggesting that the seasonal tendency may indeed play out as expected. Looking ahead, the potential for a geopolitical-related spike in volatility remains ever-present, with Iran and Ukraine as key flashpoints, but it’s worth noting that markets have shown resilience in driving volatility back lower on any near-term surges as the broader global economy continues to chug along.
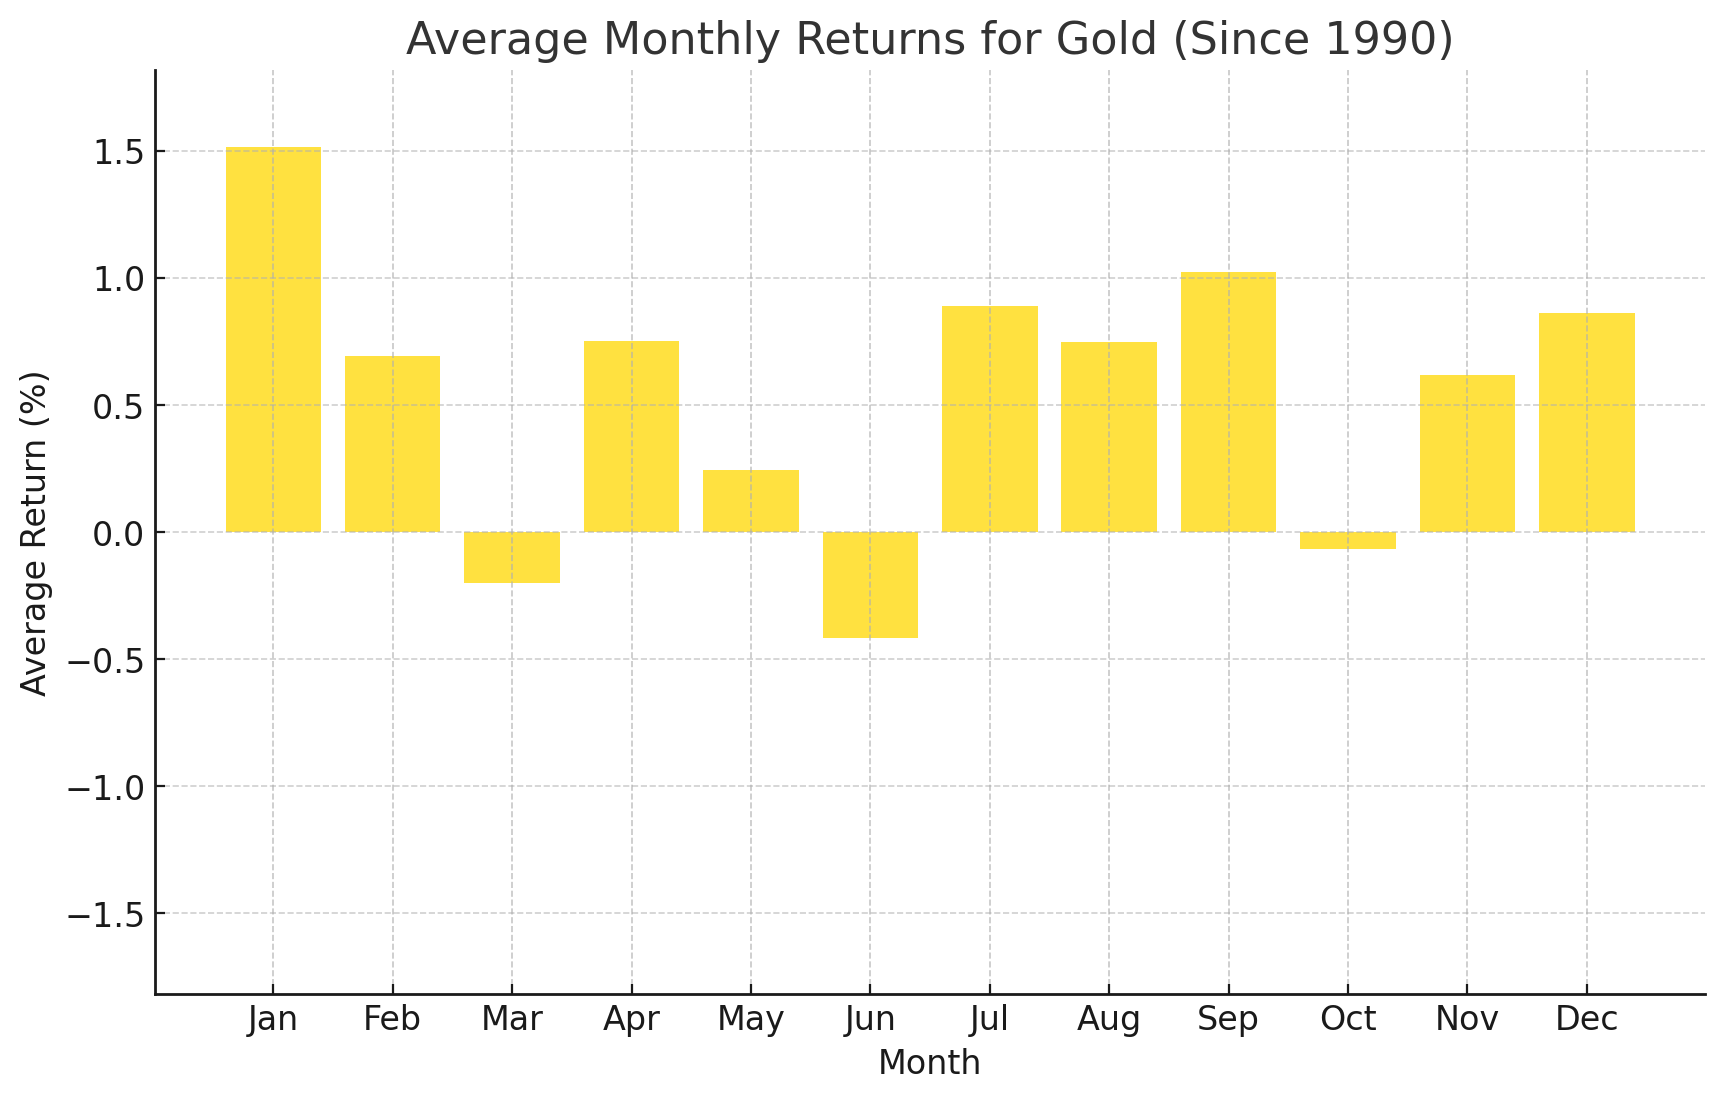
Gold Seasonality – XAU/USD Chart
Source: TradingView, StoneX. Please note that past performance is not necessarily indicative of future results.
Turning our attention to commodities, February has historically been a solid month for gold performance, with an average gain of +0.7% going back to 1990. Gold surged as high as $5600 last month as momentum-driven traders hopped aboard the fundamentally-driven rally at a fevered pitch. After a late-January washout, gold seems to be regaining its footing and the longer-term technical uptrend remains intact for now.
WTI Crude Oil Seasonality – WTI Chart

Source: TradingView, StoneX. Please note that past performance is not necessarily indicative of future results.
Last but not least, WTI Crude Oil has historically seen positive performance in February, with an average gain of +1.6% over the last 35 years. Oil spiked higher on rising tensions in Iran last month, taking it toward 6-month highs before pulling back to start this week. More than the seasonal trend, developments in the upcoming US-Iran talks, as well as any additional military actions in the area, will be the primary drivers to watch this month.
As always, we want to close this article by reminding readers that seasonal tendencies are not gospel so it’s important to complement this analysis with an examination of the current fundamental and technical backdrops for the major markets and the global economy.
-- Written by Matt Weller, Global Head of Research
Check out Matt’s Daily Market Update videos on YouTube and be sure to follow Matt on Twitter: @MWellerFX
StoneX TV content is created, produced, and distributed solely by StoneX Media Ltd (“StoneX TV”) and is provided for informational and educational purposes only. StoneX TV does not provide investment, financial, legal, or tax advice and does not make any recommendation or endorsement of any investment strategy, transaction, or financial instrument. Nothing in this content constitutes, or should be construed as, investment advice or a recommendation to buy, sell, or hold any financial instrument, including securities, futures, derivatives, digital assets, foreign exchange products, or CFDs. This content does not constitute an offer, invitation, or solicitation to engage in any investment activity. The information presented is general in nature and is not tailored to the financial situation, investment objectives, or risk tolerance of any specific person. You should not rely on this content as a substitute for independent professional advice. Investing and trading in financial instruments involves significant risk of loss and is not suitable for all investors. Past performance is not indicative of future results. Any views or opinions expressed are those of the presenter at the time of publication and are subject to change without notice. Such views may not necessarily reflect those of StoneX Media Ltd or its affiliates. StoneX Media Ltd and its affiliates, including StoneX Group Inc., may from time to time have positions in, or engage in transactions involving, the financial instruments referenced. This content may include general market commentary and opinion. It does not constitute independent investment research and has not been prepared in accordance with legal requirements designed to promote the independence of investment research. StoneX Media Ltd is not authorised or regulated to provide investment services and does not act in a fiduciary capacity. StoneX Media Ltd is incorporated in Ireland and operates in accordance with applicable Irish law. It is a wholly owned subsidiary of StoneX Group Inc. and is a separate legal entity from other subsidiaries within the StoneX Group, which may be regulated in various jurisdictions. StoneX Media Ltd does not act on behalf of, or provide services for, any regulated affiliate. This content is not directed at, and may not be distributed to, any person in any jurisdiction where such distribution would be contrary to local laws or regulations. Supporting documentation for any claims, comparisons, statistics, or technical data may be made available upon reasonable request, where applicable.