



AUD/USD Selloff Persists as US Threatens Additional 50% Tariff for China
AUD/USD extends the selloff from the previous week as US President Donald Trump threatens to impose an additional 50% tariffs on China starting April 9.
Written by
David Song
Strategist
Australian Dollar Outlook: AUD/USD
AUD/USD extends the selloff from the previous week as US President Donald Trump threatens to impose an additional 50% tariffs on China starting April 9, with the weakness in the exchange rate pushing the Relative strength Index (RSI) into oversold territory.
AUD/USD Selloff Persists as US Threatens Additional 50% Tariff for China
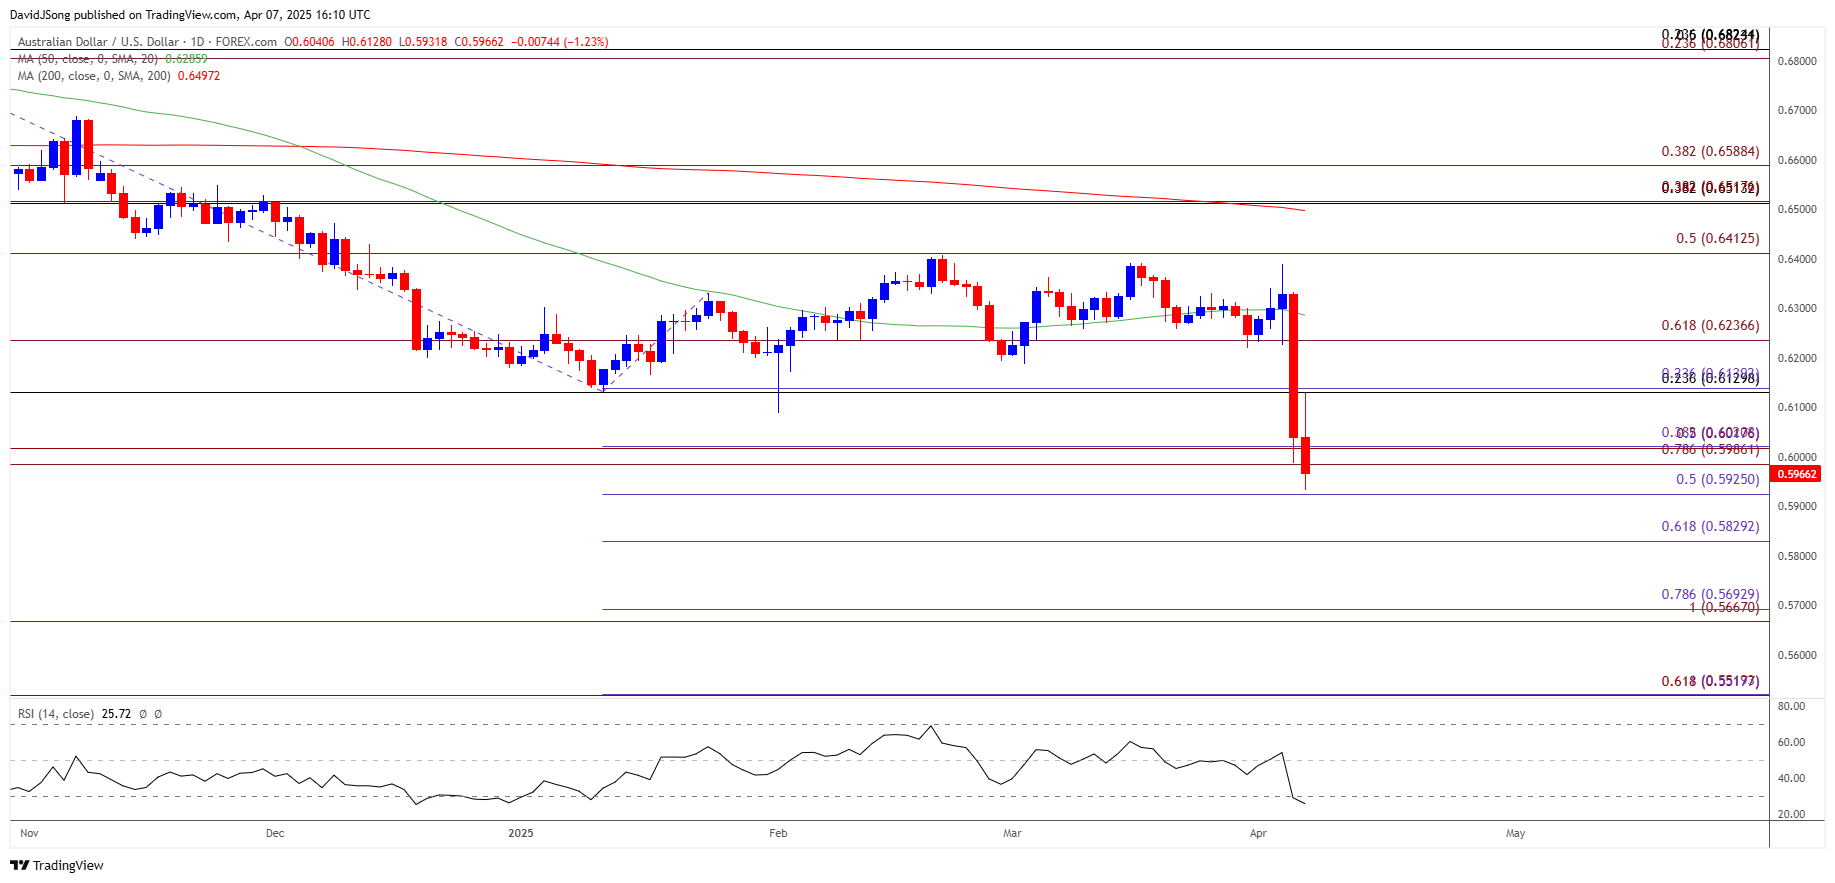
Keep in mind, AUD/USD marked the largest single-day decline since 2020 after failing to push back above the March high (0.6391), with the exchange rate clearing the February low (0.6088) as China, Australia’s largest trading partner, announced reciprocal tariffs on the US.
Join David Song for the Weekly Fundamental Market Outlook webinar.
In turn, the move below 30 in the RSI is likely to be accompanied by a further decline in AUD/USD like the price action from last year, and the threat of a trade war may push the Reserve Bank of Australia (RBA) to further unwind its restrictive policy as the ongoing transition in US trade policy is likely to drag on global growth.
As a result, the Australian Dollar may face headwinds ahead of the next RBA meeting on May 20, but Governor Michele Bullock and Co. may stick to the sidelines as ‘sustainably returning inflation to target within a reasonable timeframe is the Board’s highest priority.’
With that said, recent price action warns of a further decline in AUD/USD as it carves a series of lower highs and lows, but the RSI may show the bearish momentum abating should the oscillator bounce back from oversold territory.
AUD/USD Price Chart – Daily
Chart Prepared by David Song, Senior Strategist; AUD/USD on TradingView
- AUD/USD continues to register a fresh yearly low (0.5932) after failing to hold within the February range, with a break/close below 0.5930 (50% Fibonacci extension) raising the scope for a move towards 0.5830 (61.8% Fibonacci extension).
- Next area of interest comes in around 0.5670 (100% Fibonacci extension) to 0.5690 (78.6% Fibonacci extension), but AUD/USD may negate the recent series of lower highs and lows if it struggles to close below the 0.5990 (78.6% Fibonacci extension) to 0.6020 (38.2% Fibonacci extension) zone.
- Need a move/close back above the 0.6130 (23.6% Fibonacci retracement) to 0.6140 (23.6% Fibonacci extension) area to bring 0.6240 (61.8% Fibonacci extension) on the radar, with the next region of interest coming in around the monthly high (0.6389).
Additional Market Outlooks
Euro Forecast: EUR/USD Completes Cup-and-Handle Formation
GBP/USD Pulls Back to Keep RSI Out of Overbought Zone
Canadian Dollar Forecast: USD/CAD Selloff Persists as PM Carney Pledges to Fight Trump Tariffs
USD/JPY Selloff Pushes RSI Toward Oversold Territory
--- Written by David Song, Senior Strategist
Follow on X at @DavidJSong
Related tags:






Web Trader platform
Our sophisticated web-based platform is packed with features.
Open an account today
Experience award-winning platforms with fast and secure execution.
Economic calendar
Related articles

Australian Dollar Forecast: AUD/USD Breakout Rally Nears Pivotal Resistance 8 27 2026
Aussie has advanced in eight of the past nine weeks, but the next technical hurdle could determine whether bulls can sustain the broader advance.

Gold Pullback Risk Builds as AUD/USD and USD/CAD Set Up
Gold has stalled near major resistance after a powerful rally, while AUD/USD looks stretched and USD/CAD attempts to extend its rebound.


AUD/USD, ASX 200: Household Spending Bolsters RBA Hike Bets
Australian household spending strengthened again in July, adding to inflation and construction data supporting a September RBA hike.