


AUD/USD, ASX 200: Household Spending Bolsters RBA Hike Bets
Australian household spending strengthened again in July, adding to inflation and construction data supporting a September RBA hike.
Written by
Matt Simpson
Market Analyst
Australian household spending strengthened again in July, adding another piece of evidence to the case for a September RBA hike. With inflation, construction activity and consumer spending all pointing to firmer domestic conditions, the Australian dollar has found renewed support while the ASX 200 remains under pressure.
View related analysis:
Strong Household Spending Adds to September RBA Hike Bets
Another day, another data set drops to bolster bets of a September RBA hike. Yesterday it was inflation and construction spending; today, household spending has continued to heat up.
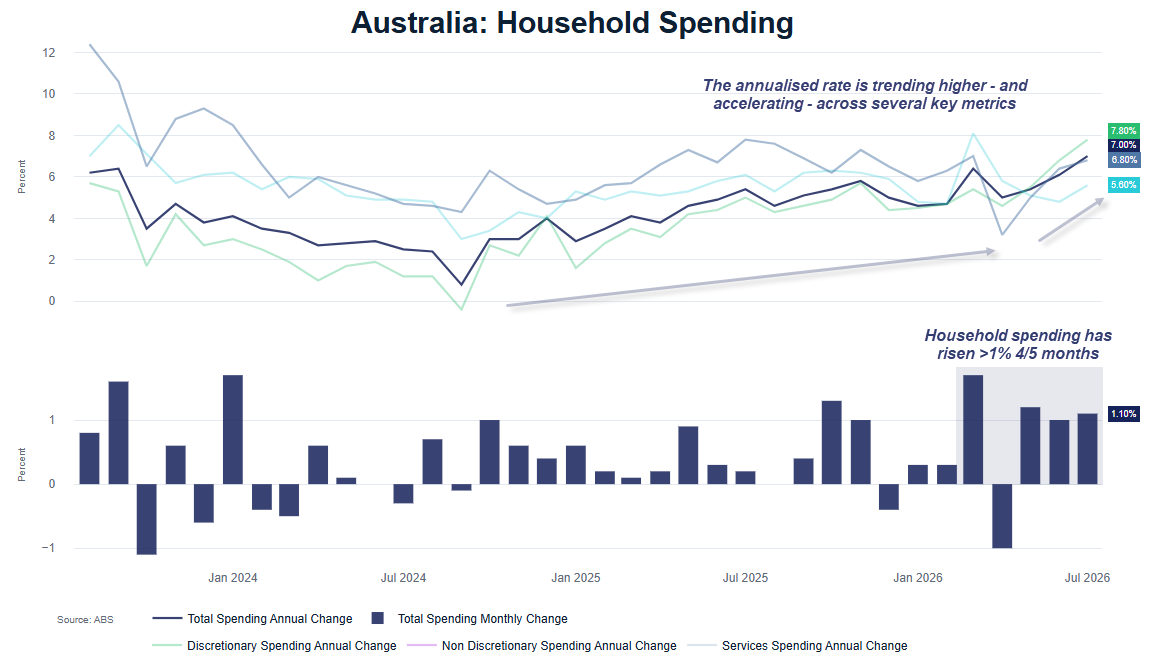
Sure, households are not splurging at the 50% annualised rates seen during locked-down COVID, but the trend is pointing higher — and it is the rate of change that central banks and economists watch, rather than absolute levels. After all, the rate has to change before the level becomes a problem.
Household spending rose 1.1% in July, marking its third consecutive monthly increase of 1% or more. While spending contracted 1% in April, it rose 1.7% in March, meaning it has increased by at least 1% in four of the past five months.
Source: ABS
Household Spending Strengthens Across Major Categories
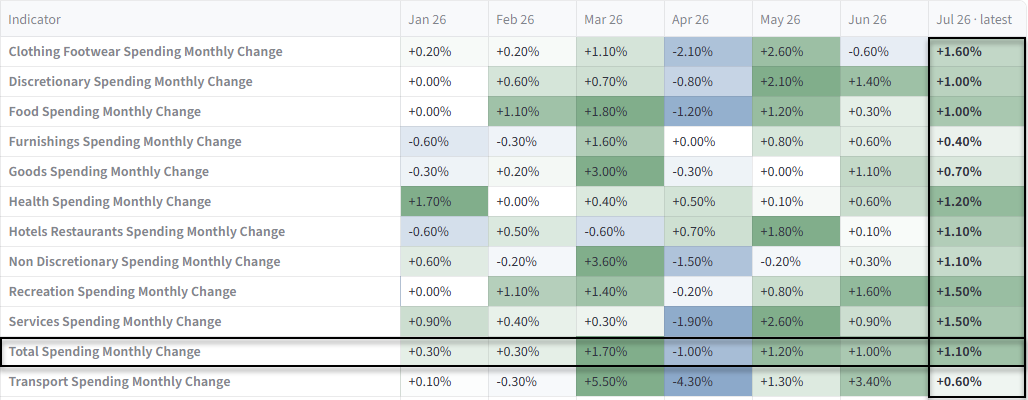
- Household spending rose 1.1% in July, or 7% y/y
- Discretionary spending increased 1% m/m and 7.8% y/y
- Non-discretionary spending rose 1.1% m/m and 5.6% y/y
- Services spending increased 1.5% m/m and 6.8% y/y
Source: ABS
Australian Dollar Finds a Bid as RBA Hike Bets Return
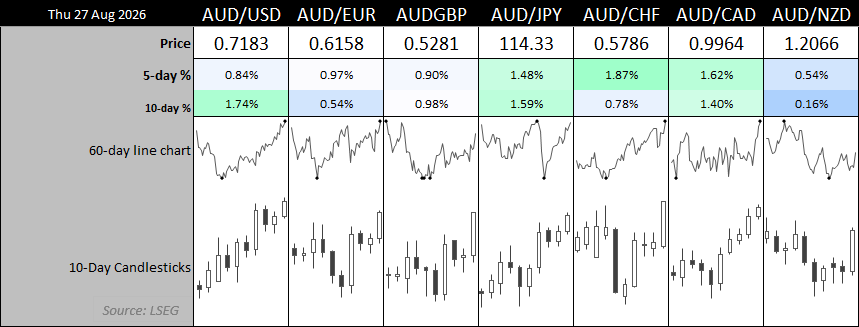
The Australian dollar is the strongest FX major, rising the most against the Swiss franc and Canadian dollar. The gains are hardly on fire, but they are arriving at the cycle highs of an eight-week rally. That alone should serve as some warning that upside could be limited from here. But when such strong data sets arrive to bolster once-abandoned calls for an RBA hike, a cheeky bid for the Australian dollar seems to be in order.
Source: LSEG
AUD/USD Technical Analysis: Australian Dollar vs US Dollar
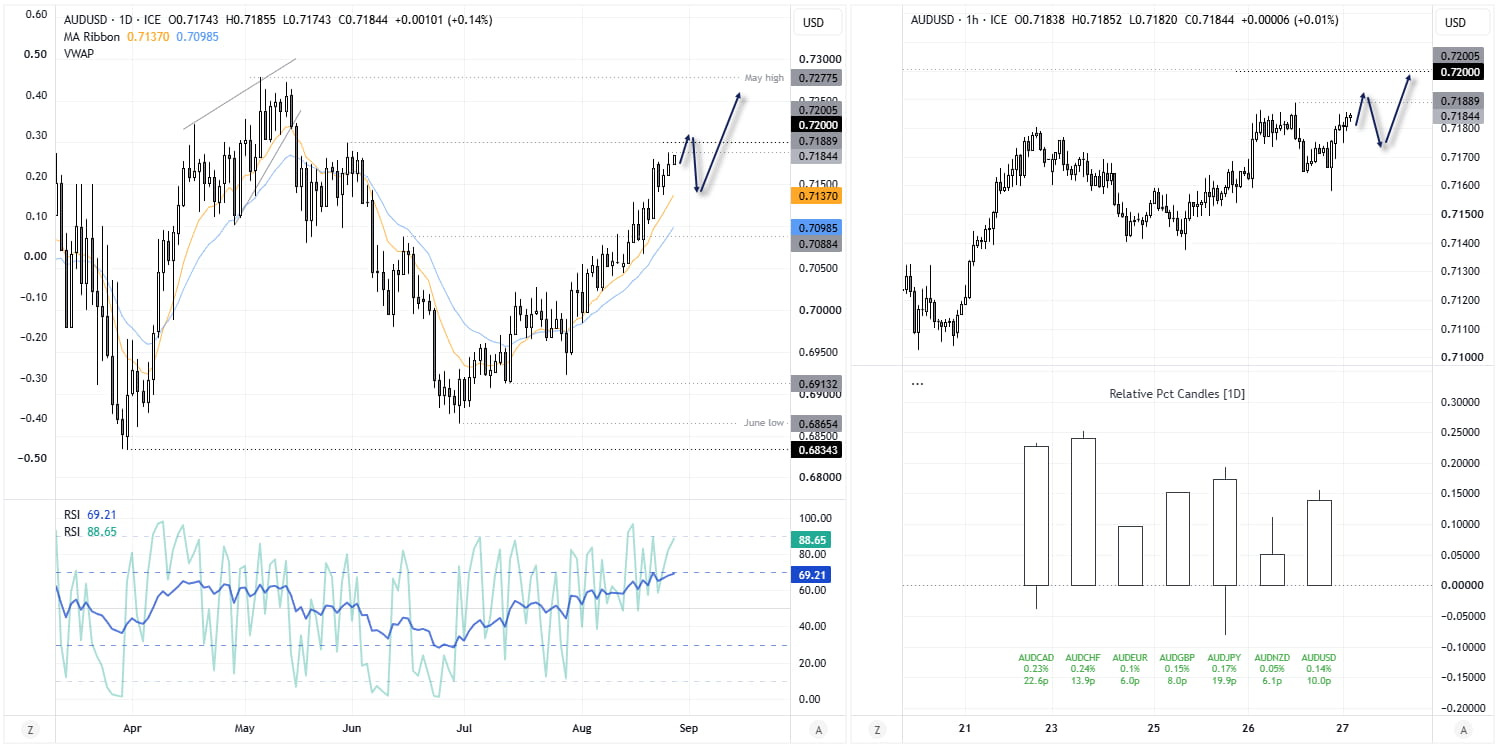
The Aussie is teasing a potential break of yesterday’s post-CPI high, but with the 72c handle and May 31 high so nearby, I suspect its upside could be limited from here heading into Kevin Warsh’s Jackson Hole speech. A hawkish Warsh could stifle the rally over the near term and help AUD/USD retrace towards its 10- or 20-day EMAs.
Note that the daily RSI (14) is near overbought and we’ve not really seen a pullback. However, with futures traders still reportable net-short and potentially scrambling for cover, a move to the May high could be in order over the coming weeks.
Source: ICE, TradingView
ASX 200 Technical Analysis
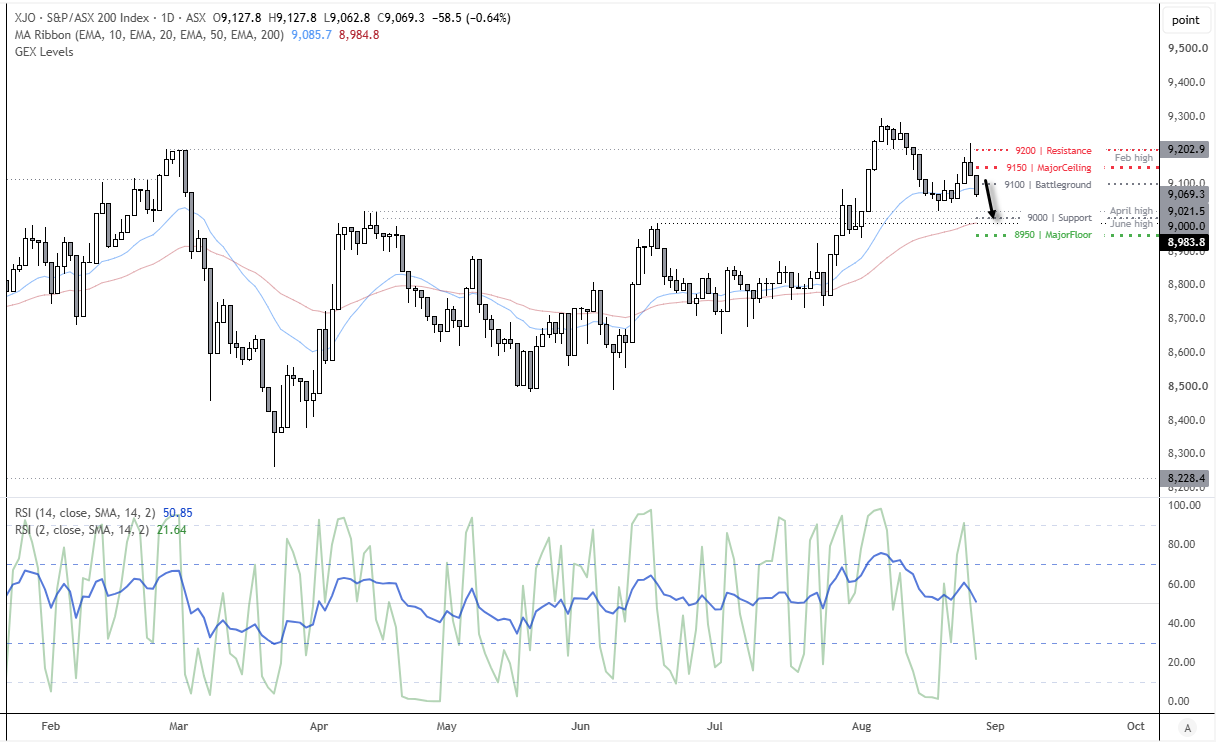
At the beginning of the week I outlined by bias for a swing high to form, and it appears that was seen on Wednesday. Despite a solid start to the session and initial 0.6% rise into the day’s high. The hot inflation print saw the ASX sharply reverse and fall 1% form that high. Today’s data has seen a continuation of that move lower, with the ASX sitting at a 3-day low. A move down to 9000 could now be on the cards, with prices below the 9100 options cluster. Also note the April and June highs around 9000 for additional support, making it a likely target for bears or area for bears to reconsider their option.
Source: ICE, TradingView
View the full economic calendar
-- Written by Matt Simpson
Follow Matt on Twitter @cLeverEdge
How to trade with City Index
You can trade with City Index by following these four easy steps:
- Open an account, or log in if you’re already a customer
• Open an account in the UK
• Open an account in Australia
• Open an account in Singapore
- Search for the market you want to trade in our award-winning platform
- Choose your position and size, and your stop and limit levels
- Place the trade







Web Trader platform
Our sophisticated web-based platform is packed with features.
Open an account today
Experience award-winning platforms with fast and secure execution.
Economic calendar
Related articles

Euro Short-term Outlook: EUR/USD Pullback Nears Pivotal Uptrend Support 8 28 2026
Warsh's comments accelerated the EUR/USD selloff, raising the stakes as buyers look to stabilize the broader recovery.


EUR/USD forecast: All eyes on Warsh at Jackson Hole - Forex Friday
For much of this week, the EUR/USD has been edging lower with the US dollar regaining some ground after last week’s sell-off that was triggered, in part, by the bond market worries. Investors have been unwilling to bet further against the US dollar so far this week ahead of Kevin Warsh’s keynote speech at the Jackson Hole summit, due later today.


AUD/CAD breakout puts the Bradman barrier in sight
A bullish breakout has pushed AUD/CAD to its highest level since early 2021. Whether it can clear 0.9994 may determine if the move extends well above parity.
