Quarterly Commodities Outlook is available for free now.  Download your report  →

StoneX logo

AUD/USD 2026 Outlook: Policy Divergence and a Shifting Dollar Trend

By: Matt Simpson, Market Analyst

The tide has shifted sharply for the RBA outlook over the past quarter. What began as a widely held expectation for a single rate cut — with perhaps another in 2026 — has given way to a reassessment of inflation risks. Stronger-than-expected CPI and GDP outcomes, alongside a still-resilient labour market, pushed the RBA into a hawkish hold and forced markets to abandon easing expectations.

Money markets are no longer pricing in further cuts, implying the easing cycle may already be over after just three moves, leaving the cash rate at 3.6%. With inflation back in focus, attention has now turned to whether the next policy move is higher — and whether the upcoming quarterly CPI release will be enough to trigger it.

Australia’s Q4 CPI: The RBA’s Deciding Factor

Ultimately, a hot Q4 CPI report could pave the way for a rate hike as early as February. With annualised trimmed mean inflation already sitting at the upper end of the RBA’s 2–3% target band, an upside surprise looks plausible and would cement expectations of a hawkish 25bp move.

The RBA took plenty of criticism in the first half of 2025 for repeatedly warning about upside inflation risks — and for much of the year, those concerns appeared misplaced. However, Q4 CPI exceeding both market expectations and the RBA’s own forecasts has largely vindicated that stance, with rate hike odds now back on the rise.
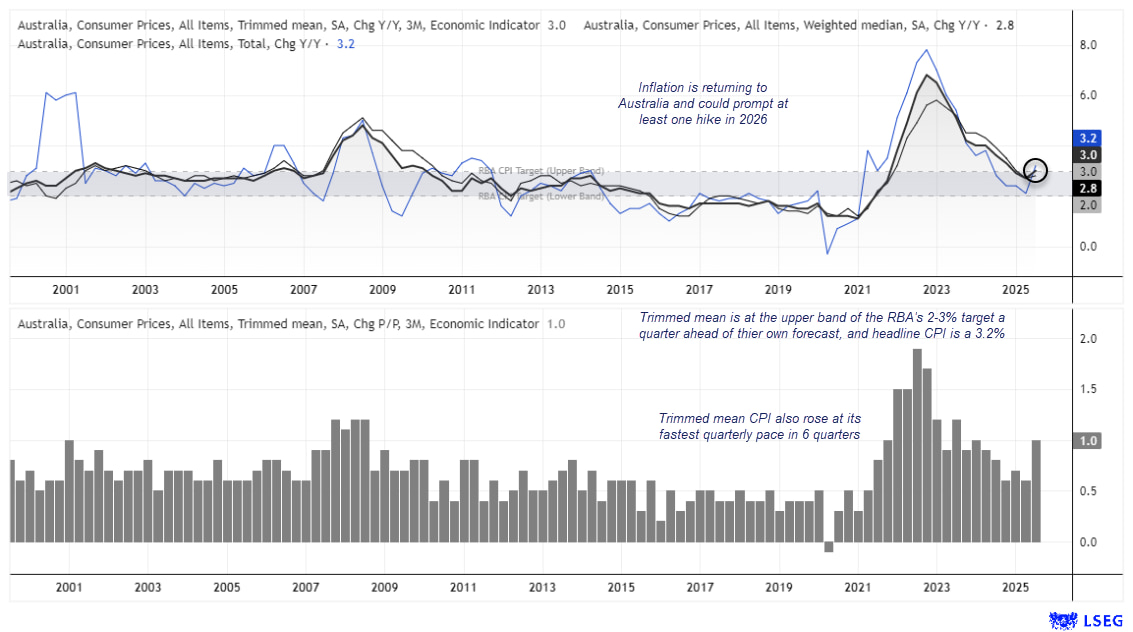
Chart showing Australia’s CPI trends with headline inflation at 3.2% YoY, trimmed mean CPI at 3.0% YoY and weighted median at 2.8% YoY, alongside quarterly trimmed mean CPI rising to 1.0% QoQ — the fastest pace in six quarters — placing underlying inflation at the upper end of the RBA’s 2–3% target band. Source: LSEG

Chart analysis by Matt Simpson – Source: ABS, LSEG

This dynamic forced a hawkish hold in December. While a hike was not on the agenda, the Board made it clear that upside inflation risks have returned and explicitly discussed the conditions that could justify tighter policy. Decisions will be made on a meeting-by-meeting basis, with the quarterly CPI release on 26 January now a key inflection point.

Even so, the RBA is unlikely to pursue an aggressive tightening cycle. If unemployment continues its gradual upward trend — as it has over the past two years — the case for multiple hikes would weaken. In that scenario, a February move could see the cash rate peak around 3.85%, before policy moves to an extended hold through H2 2026.

Takeaway: Unemployment expected to trend gently higher. CPI to rise temporarily and prompt 25bp hike in Feb or later in H1, before cooling in H2 and alleviating pressure to hike beyond 3.85%.


Fed Rate Cuts, Politics and the US Dollar Outlook

The Federal Reserve delivered a well-telegraphed 25bp cut at its December meeting, marking a third successive easing. However, divisions among voting members have thrown the outlook for further cuts into doubt, with the dot plot allowing for just a single 25bp cut in 2026. As such, the labour market may hold the key to how easy 2026 is for the Fed to navigate.

The Fed’s job becomes considerably easier if US labour market data continues to deteriorate. Rising unemployment is disinflationary and would give policymakers scope to deliver two to three rate cuts. That outcome would also align with President Trump’s repeated calls for lower interest rates.

But monetary policy in 2026 is unlikely to be shaped by data alone.
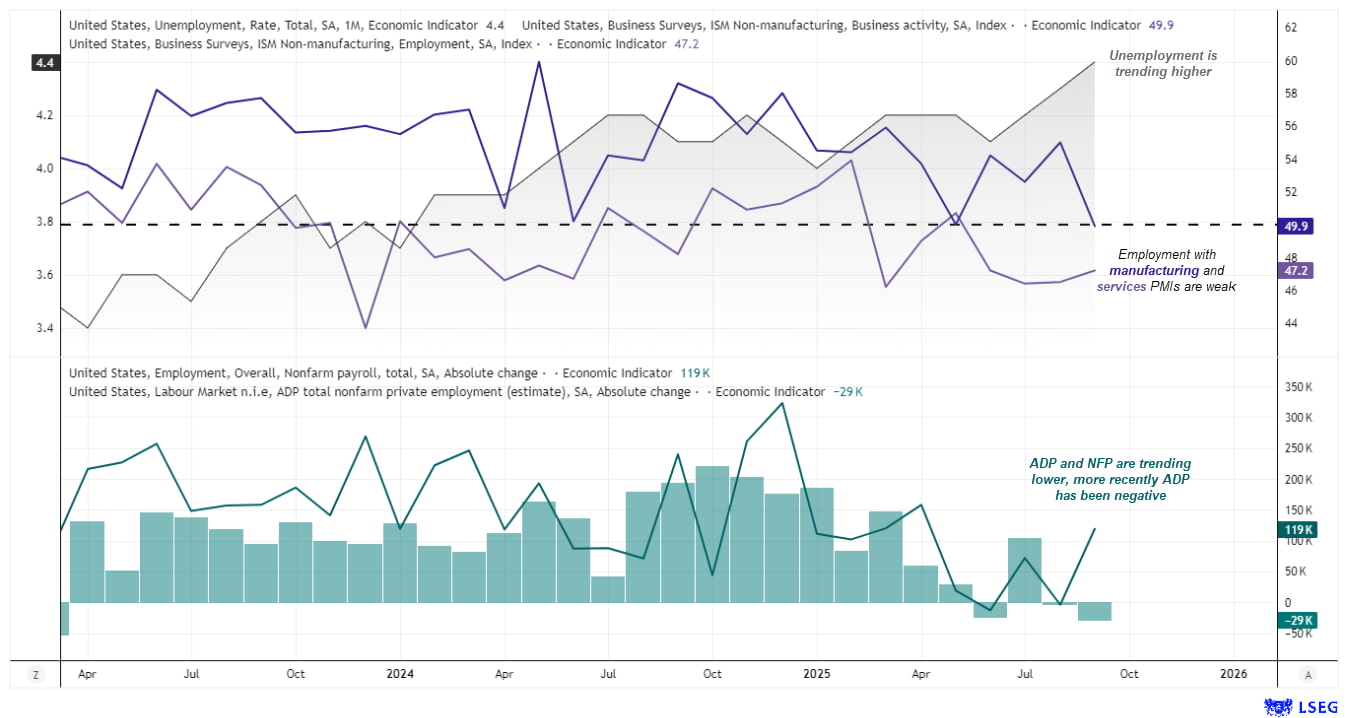
Chart showing US labour market trends with unemployment rate gradually rising, ISM non-manufacturing business activity and employment indices remaining below the 50 expansion threshold, and weakening job creation. The lower panel shows nonfarm payrolls and ADP private employment trending lower, with recent ADP prints turning negative, signalling a cooling US labour market. Source:

Chart analysis by Matt Simpson – Source: ADP, BLS, ISM, LSEG


The Political Dilemma for Fed Policy

This dynamic creates a political dilemma. A weakening labour market typically feeds through to slower economic growth — hardly desirable for an incumbent administration heading into the midterm elections.

As the midterms approach, the Trump administration is likely to prioritise policies aimed at supporting growth, while continuing to publicly pressure the Fed to ease policy. The challenge is that stronger growth risks reigniting inflation, which would in turn reduce the Fed’s willingness to cut rates.

That said, Trump is highly likely to replace Jerome Powell as Fed Chair when his term expires in May 2026, with a nominee more inclined toward a dovish policy stance.


One low-probability but high-impact tail risk is a legal challenge to Trump’s tariff regime. If the US Supreme Court were to deem the tariffs illegal, it could trigger a sharp risk-off reaction in global markets, weighing heavily on risk-sensitive currencies such as the Australian dollar. While such an outcome appears unlikely given the scale of disruption it would cause to the US economy, it remains a risk worth keeping on the radar.

Balancing these dynamics, at least two rate cuts in 2026 look plausible. A sharper economic downturn could quickly bring three to four cuts into play, increasing downside pressure on the US dollar.

Takeaway: US labour market data is the key swing factor for Fed policy in 2026. A gradual rise in unemployment would open the door to at least two rate cuts — and potentially more if growth deteriorates — weighing on the US dollar. Political pressure ahead of the midterms and a likely shift toward more dovish Fed leadership add to USD downside risks, with risk-off shocks remaining a low-probability but high-impact wildcard.

US Dollar Index (DXY) Technical Analysis

My base case is for a bearish year for the US dollar in 2026, driven by weaker employment trends, softer economic growth, and the likelihood of a more dovish Fed Chair replacing Jerome Powell.

The rally from the 2011 low to the 2022 high appears impulsive. January’s lower high and the subsequent sharp sell-off into the June low suggest the market has topped, with the risk skewed toward fresh cycle lows.

The advance from July 2023 to January 2025 also displays corrective characteristics, with heavy overlap between swings rather than impulsive follow-through.

A three-wave rebound below 100 looks weak. While a final push toward 102 is possible, momentum is expected to roll over in 2026, with scope for a break below 95.

The average annual range of the US dollar index over the past decade is 13.8%, broadly in line with 2025. If DXY remains capped below 102 in 2026, a similar range would imply downside toward 88.7, while a more modest 10% decline from 102 would place the index just below 92.

A bearish outlook for the dollar index would, by extension, support a bullish bias for the Australian dollar.
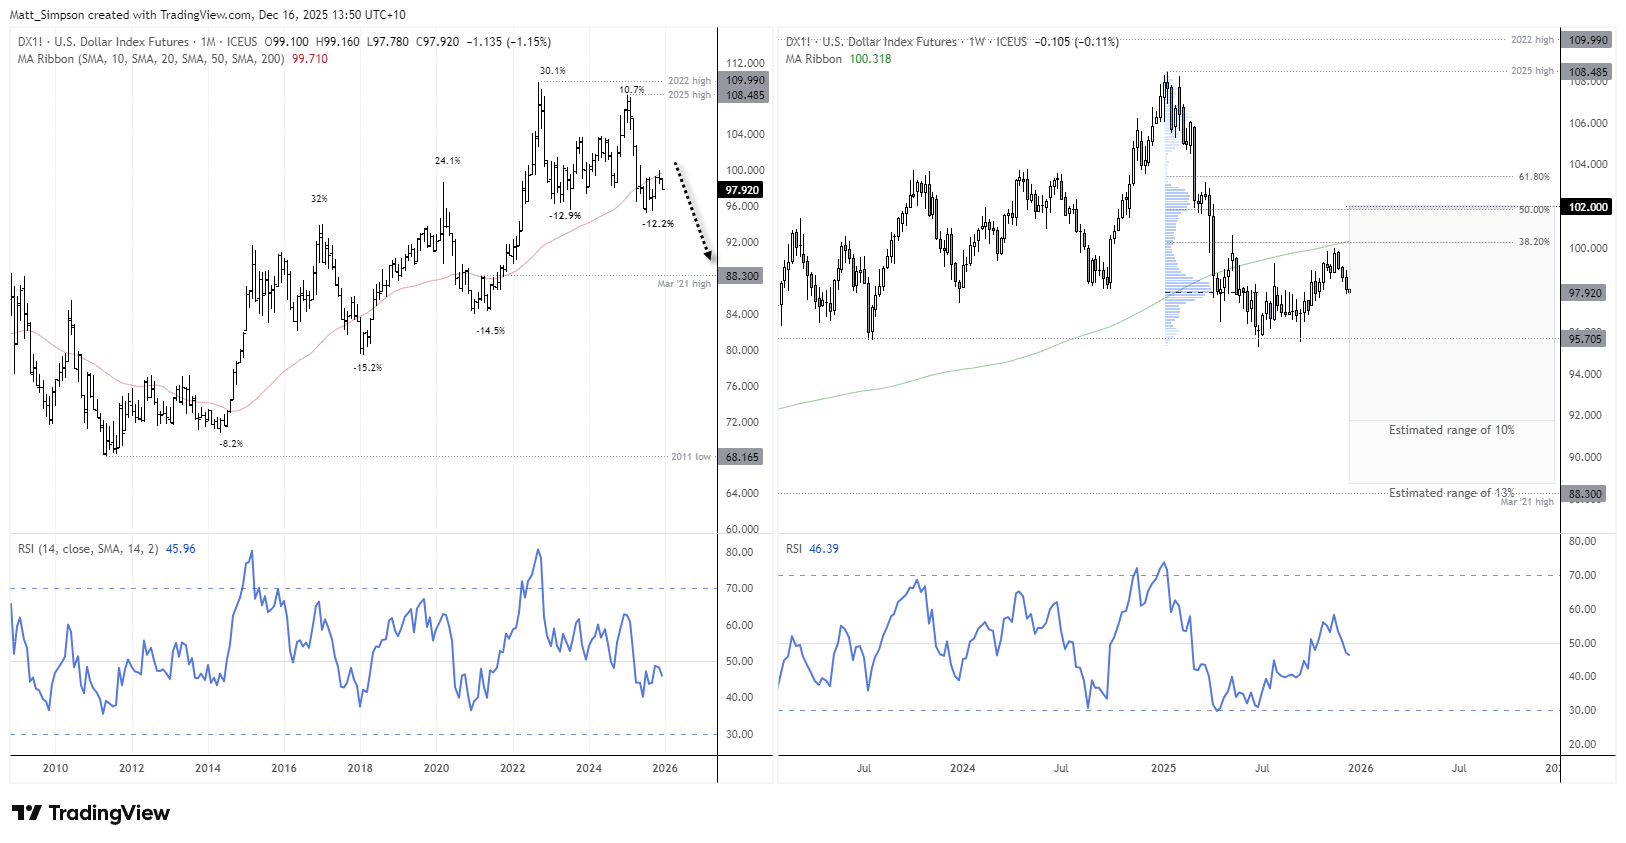
US Dollar Index (DXY) futures shown on long-term monthly and medium-term weekly charts, highlighting a completed impulsive rally into the 2022 peak, corrective price action since 2023, and a weak rebound below the 100 level. Moving averages, RSI momentum, and projected annual range suggest downside risk toward the mid-90s or lower if resistance near 102 holds.

Chart analysis by Matt Simpson - data source: TradingView U.S. Dollar Index Futures

Takeaway: The US dollar looks vulnerable in 2026, with corrective price action below 102 suggesting rallies are likely to fade and downside risks building toward the mid-90s or lower — a backdrop that would favour a stronger Australian dollar.


Australian Dollar Technical Outlook for 2026

AUD/USD Seasonality Signals Patience Early, Opportunity Later

Seasonality argues for patience early in the year, with better upside conditions emerging from Q2.

  • Average monthly returns for AUD/USD offer little encouragement for bulls in Q1, with January down -0.34% and February–March essentially flat.
  • Q4 is the most consistent quarter, with all three months delivering positive average and median returns and win rates above 50%.
  • April and June stand out for bulls, each posting win rates of at least 60% alongside positive average and median returns.
  • October delivers the strongest median gain at 1.6%, supported by a 56% win rate.
  • August is the clear outlier for bears: it carries negative average and median returns and a win rate of just 28% — meaning AUD/USD closes lower 72% of the time.
  • May is the next-weakest month, with negative returns and a 60% loss rate.
  • It’s also notable that median returns — a more “typical” measure than averages — flip between bearish and bullish throughout the first six months of the year.
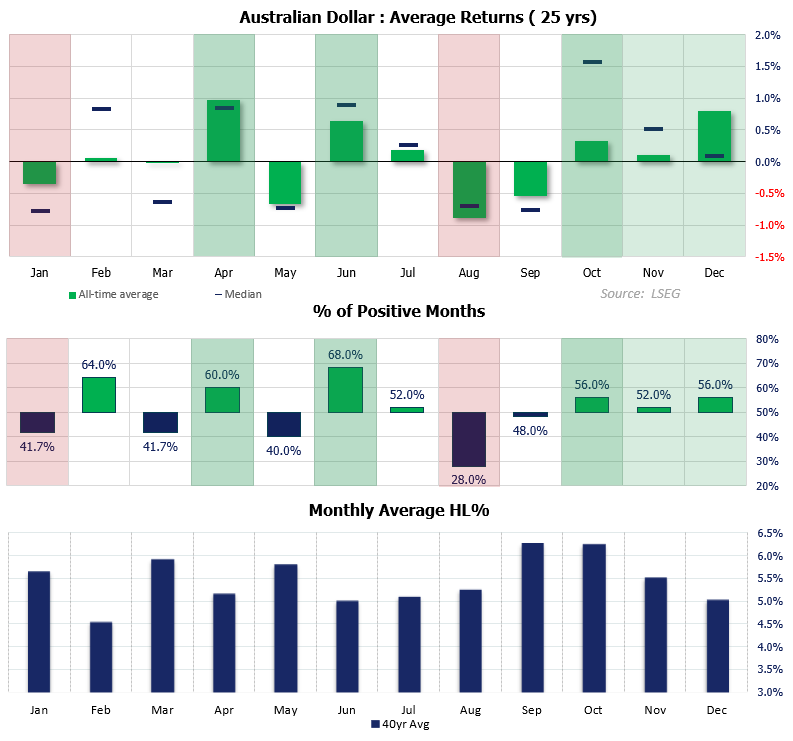
Three-panel AUD/USD seasonality chart showing: (1) 25-year average and median monthly returns, with strong gains in April, June, October and December, and pronounced weakness in January, May and August; (2) monthly win rates highlighting bullish months such as June (68%) and April (60%) and bearish months such as August (28%); (3) average monthly high-low ranges showing widest volatility in September and October and narrower ranges early in the year.

Chart analysis by Matt Simpson – Source: TradingView


AUD/USD Technical Analysis: Long-Term Support Anchors Bullish Bias

The 60c handle has been a stubborn floor for AUD/USD since 2008. Bears rarely break it — and when they do, the move is brief and usually tied to a global shock. The GFC failed to sustain a break, while COVID and Trump’s tariff disputes produced only temporary dips. Once again, AUD/USD is rebounding from this key psychological level.

With the US dollar pencilled in for a bearish year and the Chinese yuan firming, dips appear favourable for AUD/USD bulls.

Seasonally, January tends to be soft, followed by choppy returns through the remainder of Q1. Bullish momentum typically improves in April and June, before the pair often finishes the year strongly in Q4.

The annual high-to-low range for AUD/USD has averaged around 13% in recent years, compared with a 10-year average of 17.7%. Assuming a 2026 low near 0.63, a 13% rally would project upside toward 0.712.

AUD/USD shown on long-term monthly, multi-year daily, and weekly charts, highlighting repeated rebounds from the 0.60–0.63 support zone since 2008. A bullish long-term candle structure, improving momentum, and correlation with a firmer Chinese yuan suggest scope for further upside, with projected annual ranges pointing toward the low 0.70s. Chart analysis by Matt Simpson, source: TradingView.

Chart analysis by Matt Simpson – Source: TradingView


AUD/USD Outlook for 2026: Key Risks and Price Scenarios

AUD/USD enters 2026 with a clear macro tailwind. Inflation risks have re-emerged in Australia, keeping the RBA biased toward restraint rather than easing, while the Federal Reserve faces growing pressure to cut as the US labour market cools and political dynamics intensify ahead of the midterms. This policy divergence leaves the balance of risks tilted against the US dollar.

From a technical perspective, the US dollar index appears to have topped, while AUD/USD continues to defend long-term support near the 60c handle. Seasonality argues for patience early in the year, but improving conditions from Q2, combined with a softer USD backdrop, suggest rallies are more likely to extend than fade. Barring a major risk-off shock, the setup favours a stronger Australian dollar in 2026, with scope for AUD/USD to push back toward the low-0.70s over the year.


  • Global Macro

This material should be construed as market commentary and represents the opinions and viewpoints of the author, and does not reflect tailored advice associated with any specific account.


The views are current only through the date stated and are subject to change at any time based upon market or other conditions, and StoneX Group Inc. (“SGI”) disclaims any responsibility to update such views. Actual results, performance, or achievements may differ materially from those expressed or implied. Information is based on data gathered from what we believe are reliable sources. Past performance does not guarantee future results.


The StoneX Group Inc. group of companies provides financial services worldwide through its subsidiaries, including physical commodities, securities, exchange-traded and over-the-counter derivatives, risk management, global payments and foreign exchange products in accordance with applicable law in the jurisdictions where services are provided.


References to certain OTC products or swaps are made on behalf of StoneX Markets, LLC (SXM), a member of the National Futures Association (NFA) and provisionally registered with the U.S. Commodity Futures Trading Commission (CFTC) as a swap dealer. SXM’s products are designed only for individuals or firms who qualify under CFTC rules as an ‘Eligible Contract Participant’ and who have been accepted as customers of SXM.


StoneX Financial Inc. (SFI) is a member of FINRA/NFA/SIPC and registered with the MSRB. SFI is registered with the U.S. Securities and Exchange Commission (SEC) as a Broker-Dealer and with the CFTC as a Futures Commission Merchant and Commodity Trading Advisor. StoneX Financial (Canada) Inc. (SFCI) is registered in Canada and is a member of CIRO and CIPF. References to certain securities trading are made on behalf of the BD Division of SFI and are intended only for an audience of institutional clients as defined by FINRA Rule 4512(c). References to certain exchange-traded futures and options are made on behalf of the FCM Division of SFI. Wealth Management is offered through SA Stone Wealth Management Inc., member FINRA/SIPC, and SA Stone Investment Advisors Inc., an SEC-registered investment advisor, both wholly owned subsidiaries of SGI.

R.J. O’Brien & Associates, LLC (RJO) is registered with the CFTC as a Futures Commission Merchant and is a member of NFA.


StoneX Financial Ltd (SFL) is registered in England and Wales, company no. 5616586. SFL is authorized and regulated by the Financial Conduct Authority (FCA) (registration number FRN:446717) to provide services to professional and eligible customers including: arrangement, execution and, where required, clearing derivative transactions in exchange traded futures and options. SFL is also authorized to engage in the arrangement and execution of transactions in certain OTC products, certain securities trading, precious metals trading and payment services to eligible customers. SFL is authorized and regulated by the FCA under the Payment Services Regulations 2017 for the provision of payment services. SFL is a category 1 ring-dealing member of the London Metal Exchange. In addition SFL also engages in other physically delivered commodities business and other general business activities which are unregulated and not required to be authorized by the FCA.


This communication is issued in the European Economic Area by StoneX Financial Europe GmbH (SFEG). StoneX is the trade name used by STONEX GROUP INC. and all its associated entities and subsidiaries. StoneX Financial Europe GmbH (“SFEG”) is a securities trading firm registered in Germany under Company No. HRB 80844.


StoneX APAC Pte. Ltd. (“SAP”) (Co. Reg. No 200616676W) is regulated as a Dealer (PS20190001002) under the Precious Stones and Precious Metals (Prevention of Money Laundering and Terrorism Financing) Act 2019 for purposes of anti-money laundering and countering the financing of terrorism. SAP is an “Approved International Trading Company” authorized to act as a “Spot Commodity Broker” under the Commodity Trading Act.


StoneX Financial Pte Ltd (Co. Reg. No 201130598R) (“SFP”) is regulated by the Monetary Authority of Singapore and is a Capital Markets Service Licence holder (for dealing in capital market products), an Exempt Financial Adviser (for advising on investment products and issuing or promulgating analyses/ reports on investment products) and a Major Payment Institution (for domestic and cross-border money transfer services).


SFP may distribute analysis/report produced by its respective foreign affiliates within the StoneX Group of companies pursuant to an arrangement under Regulation 32C of the Financial Advisers Regulations Recipients should contact SFP at (65) 6309 1000 for any matters arising from, or in connection with, this webinar.


StoneX APAC Pte. Ltd. (“SAP”) (Co. Reg. No 200616676W) is regulated as a Dealer (PS20190001002) under the Precious Stones and Precious Metals (Prevention of Money Laundering and Terrorism Financing) Act 2019 for purposes of anti-money laundering and countering the financing of terrorism.


StoneX Financial (HK) Limited (CE No.: BCQ152) (“SHK”) is regulated by the Hong Kong Securities and Futures Commission for Dealing in Securities and Dealing in Futures Contracts.


StoneX Financial Pty Ltd (ACN 141 774 727) holds an Australian Financial Service License (AFSL: 345646) for Dealing in Securities, Exchange-Traded Derivatives Contracts, OTC Derivatives Contracts and Foreign Exchange Contracts, and is regulated by the Australian Securities and Investments Commission.


StoneX Securities Co., Ltd. (“SSJ”) (Co. Reg. No 010401047199) is regulated by the Japanese Financial Services Agency as a Type-I Financial Instruments Business Operator (Kanto Local Finance Bureau (FIBO)No.291’), is a member of the Financial Futures Association of Japan for dealing and broking FX and FX Option transactions, and is a member of the Japan Securities Dealers Association for dealing and broking stock indices and option transactions.


Trading swaps and over-the-counter derivatives, exchange-traded derivatives and options and securities involves substantial risk and is not suitable for all investors. Past performance of any futures or option is not indicative of future success. Indicators are not a trading system and are not published as a specific trade recommendation. The information herein is not a recommendation to trade nor investment research or an offer to buy or sell any derivative or security. It does not take into account your particular investment objectives, financial situation or needs and does not create a binding obligation on any of the StoneX group of companies to enter into any transaction with you. You are advised to perform an independent investigation of any transaction to determine whether any transaction is suitable for you. No part of this material may be copied, photocopied or duplicated in any form by any means or redistributed without the prior written consent of StoneX Group Inc.


The report/analysis herein is not directed to, or intended for distribution to or use by, any person or entity who is a citizen or resident of or located in any locality, state, country or other jurisdiction where such distribution, publication, availability or use would be contrary to law or regulation.


© 2026 StoneX Group Inc. All Rights Reserved.

Satellite view of Earth at night showing illuminated cities across Asia and the Middle East

Discover more insights

Our subscribers have access to comprehensive market analysis from StoneX spanning commodities, equities, currencies and more.

StoneX: We open markets

Our market expertise, advanced platforms, global reach, culture of full transparency and commitment to our clients’ success all set us apart in the financial marketplace.

Reach

With access to 40+ derivatives exchanges, 180+ foreign exchange markets, nearly every global securities marketplace and numerous bi-lateral liquidity venues, StoneX’s digital network and deep relationships can take clients anywhere they want to go.

Transparency

As a publicly traded company meeting the highest standards of regulatory compliance in the markets we serve; our financials and record of accomplishment are matters of public record. StoneX’s commitment to “doing the right thing over the easy thing” sets us apart in the industry and helps us build respect, client trust and new partnerships.

Expertise

From our proprietary Market Intelligence platform, to “boots on the ground” expertise from award-winning traders and professionals, we connect our clients directly to actionable insights they can use to make more informed decisions and achieve their goals in the global markets.


