- Fundamentals continue to favour USD/JPY upside
- BOJ intervention threat continues to suppress volatility
- US economic exceptionalism remains a powerful tailwind
- Speculators continue backing further yen weakness
- Technicals continue to favour the bulls
The battle beneath the surface
If not for the threat of intervention from Japanese authorities, there's a strong argument USD/JPY would be trading significantly higher than where it does today.
Markets have gone from pricing aggressive Federal Reserve rate cuts to contemplating multiple hikes over the coming year, while the Bank of Japan continues to tighten policy from an exceptionally low base, leaving the yen one of the cheapest funding currencies in the G10. Throw in subdued volatility that continues to support carry trades, alongside ongoing US exceptionalism that's still attracting capital into US assets, and the fundamental case for sizeable USD/JPY upside remains compelling.
Yet that's not what's happened.
The longer that tension persists, the greater the chance something eventually breaks. Either the US exceptionalism story that has underpinned dollar strength begins to unravel, or Japanese authorities ultimately accept that markets want to push the yen weaker. Until then, that tension between supportive fundamentals and intervention risk looks set to remain the defining theme for H2 2026.
Rates still matter, just less
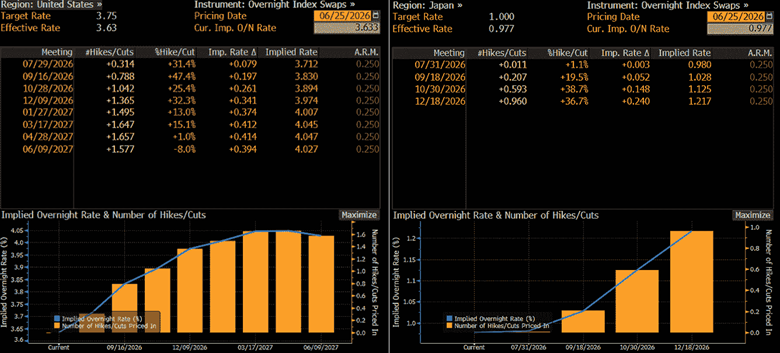
Source: Bloomberg
The biggest change since our Q2 outlook has been the dramatic repricing in Federal Reserve expectations. It wasn't that long ago markets were pricing around three rate cuts by early 2027. Today, overnight index swaps fully discount at least one hike by year-end, with around a two-in-three chance of a second by the first quarter of 2027.
By comparison, expectations for the Bank of Japan have barely shifted. Markets continue to price a slow, measured tightening cycle that, even if delivered in full, would still leave real policy rates deeply negative and monetary settings arguably accommodative. Despite all the headlines surrounding BOJ normalisation, the yen remains one of the cheapest funding currencies in the G10.
Historically, USD/JPY has been highly sensitive to shifts in relative interest rate expectations, making front-end yield differentials one of the pair's most reliable drivers. While that's still broadly the case, the relationship has weakened noticeably since Liberation Day and the reciprocal tariff announcements in April 2025.
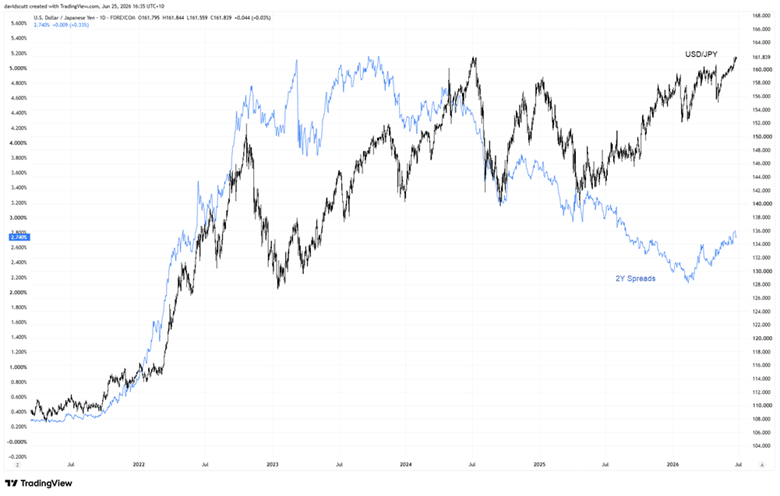
Source: TradingView
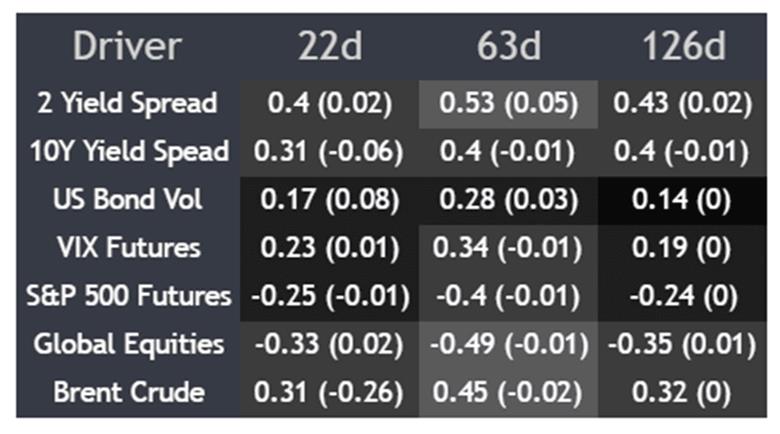
The correlation matrix above reinforces that point. Two-year yield differentials have exhibited the strongest relationship with USD/JPY over the past month, quarter and half year, but correlations ranging between 0.40 and 0.53 suggest rates have been an influence rather than the dominant driver they once were.
The chart comparing USD/JPY against US-Japan two-year yield differentials below reinforces that conclusion. While spreads have moved back in favour of the US this year following the hawkish repricing in Fed expectations, the relationship remains far looser than it was historically. Yield differentials still matter, but they're no longer telling the whole story.
Source: TradingView
The continued outperformance of the US economy has become just as important. Strong investment tied to the AI build-out, supportive fiscal policy, resilient capital markets and attractive real yields have attracted capital into US assets, underpinning demand for dollars. Add in other influences, including shifts in the terms of trade and the energy shock that followed the conflict in the Gulf, and it's easier to understand why USD/JPY has remained elevated even though yield differentials are nowhere near as wide as they have been at other points in the cycle.
While those factors have helped keep USD/JPY elevated, they don't fully explain why the pair has continued to trade in such a narrow range despite one of the most supportive macro backdrops for upside in years.
The intervention effect
Part of the explanation lies in the shift in how Japanese authorities have responded to yen weakness. Historically, intervention has largely been reserved for periods of rapid yen appreciation or depreciation, with policymakers focused on the pace of the move rather than defending a specific level.
This time is different. The reaction function has changed. Despite USD/JPY grinding higher for much of the year, rather than surging, Japanese officials have repeatedly warned about intervention around levels. Whether intentional or not, that has changed market behaviour. Rather than chasing USD/JPY higher, traders have become reluctant to truly take on Japan’s Ministry of Finance, helping suppress volatility and trading ranges.
The result is a market caught between two powerful forces. Fundamentals continue to argue for further upside, while the threat of intervention discourages the market from fully expressing that view.
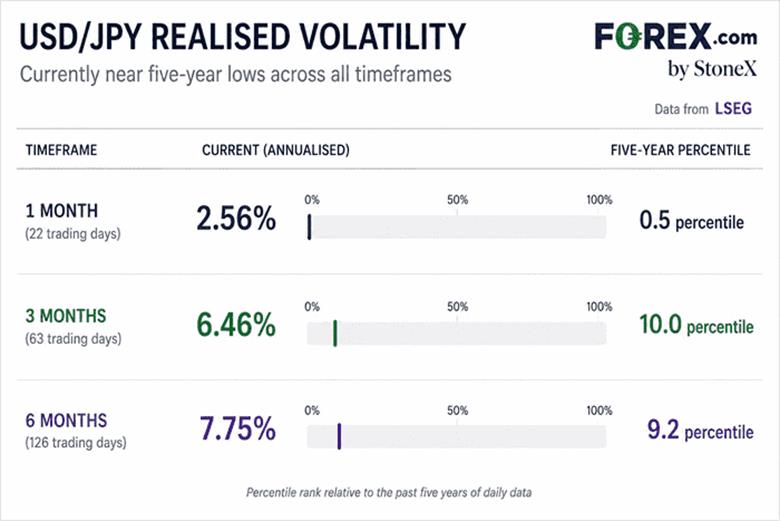
Source: FOREX.COM
The shift in behaviour is evident in realised volatility. One-month realised volatility sits in just the 0.5th percentile of the past five years, while three and six-month measures rank in only the 10th and 9.2nd percentiles respectively. That's remarkable given volatility has been subdued through much of the post-pandemic period, reinforcing how much these competing forces are compressing price action.
If anything, the three and six-month readings flatter the true picture. Both continue to reflect the brief spike in volatility surrounding the intervention episodes earlier this year. Strip those moves out, and realised volatility over longer timeframes would be even lower.
CFTC positioning data below also point to expectations of further yen weakness. Leveraged funds have rebuilt sizeable short yen positions, with net bearish exposure approaching levels last seen in mid-2024. Outside that episode, you'd need to look back to the Fed's 2018 tightening cycle to find comparable positioning.
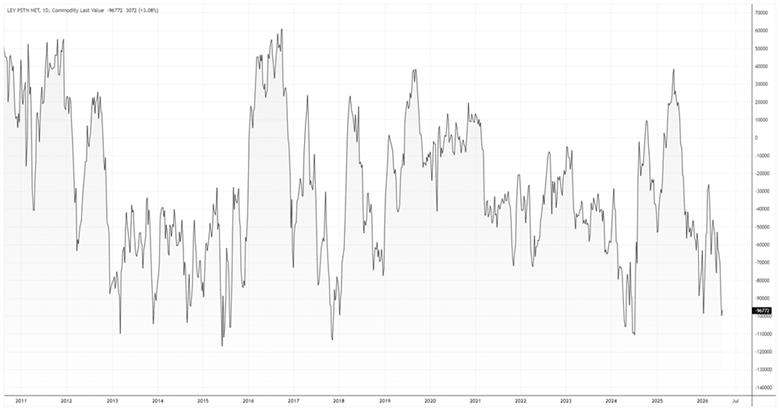
Source: LSEG
While speculators continue to position for sustained yuen weakness, that comes sizeable risks. Should the US exceptionalism story begin to falter, or large-scale intervention trigger a wave of short covering, extreme positioning has the potential to amplify the move. But for now, it's difficult to see the bearish yen mindset changing without a material shift in the underlying narrative.
Watching the calendar
Source: TradingView
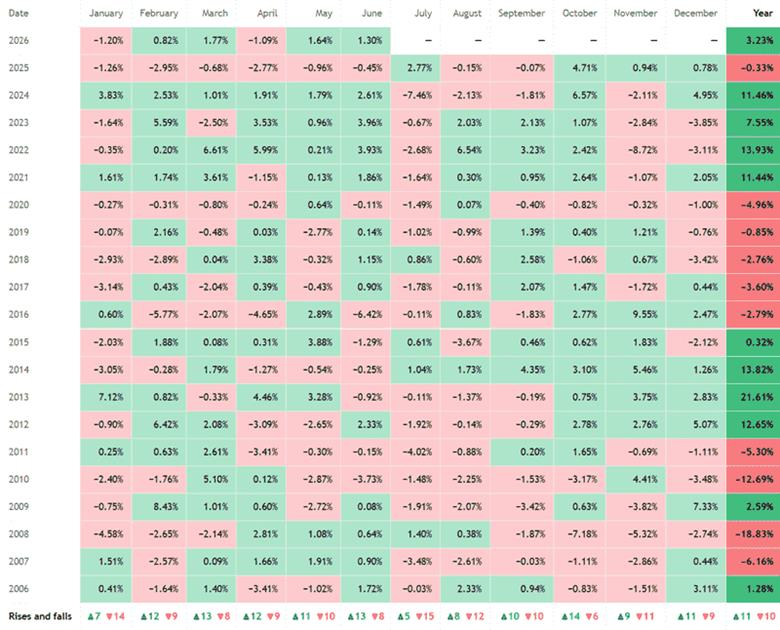
Beyond the fundamental picture, traders may also want to consider how USD/JPY has typically performed during the second half of the year.
Over the past 20 years, the pair has fallen in 15 of the past 20 Julys, delivering an average decline of 1.16% and a median fall of 1.25%, suggesting the tendency has been relatively consistent rather than the result of one or two outsized moves. August has also tilted in favour of yen strength, although the average decline of 0.14% points to a far weaker seasonal bias.
After that, the picture becomes far less one-sided. October has historically been the strongest month of H2 for USD/JPY, while November has tended to deliver the biggest swings in either direction, standing out as the most volatile month of the second half despite offering little directional bias.
However, as a reminder, just because seasonal patterns have been evident historically does not mean they'll play out in 2026.
Bulls remain in control
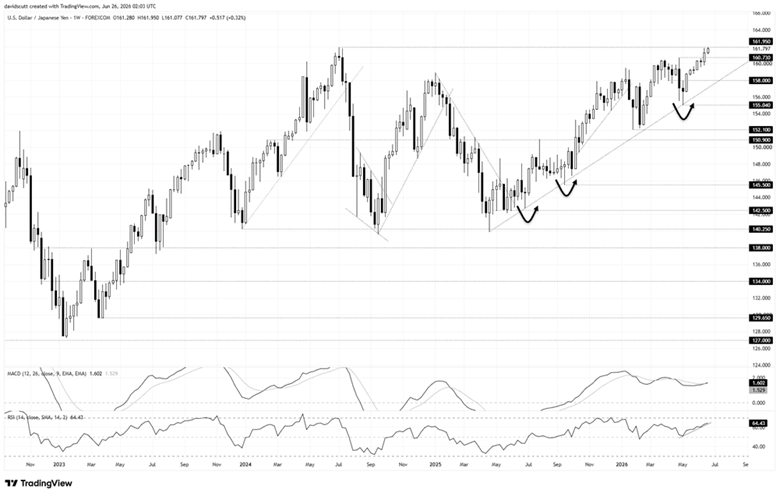
Source: TradingView
If you're a bull, there's not much to dislike about the weekly chart. USD/JPY remains in a well-defined uptrend established from the April 2025 low, with a trendline that's been tested on multiple occasions and held every time, including earlier this year. Each bounce has been followed by fresh highs, leaving the pair testing the 2024 high of 161.95 as we approach H2.
That is the immediate focus overhead. A clean break above would push USD/JPY to multi-decade highs, bringing 164.00, 168.00 and even 180.00 into view, levels all derived from price action established back in 1986.
On the downside, the former year-to-date high at 160.73 is the first level to watch, followed by 158.00, which has acted as both support and resistance previously, before the April 2025 uptrend comes into view.
Like the price action, the message from the oscillators is also bullish. RSI (14) continues to push higher within an established uptrend but remains well short of overbought territory at 64.25. MACD has also crossed higher and continues to build in positive territory. Like the fundamental picture, both continue to favour upside over downside.
A framework, not a forecast
Based on the evidence outlined above, the balance of risks continues to favour USD/JPY upside, although the path higher is unlikely to be a straight line. As the past year has shown, intervention may slow the move, but it has so far failed to reverse the broader trend.
Rather than focusing on any single year-end forecast, traders should keep a close eye on the data and central bank communication that will determine whether the current regime remains intact.
In the US, non-farm payrolls, the unemployment rate, CPI and communication from Federal Reserve officials remain the key guideposts, helping to determine whether the recent hawkish repricing in Fed expectations has further to run.
In Japan, household spending, GDP and the BOJ's preferred underlying inflation measure, which strips out the impact of government subsidies, will provide the clearest read on whether domestic demand is strengthening enough to sustain the virtuous cycle of stronger demand, faster wage growth and persistent inflation needed to justify further policy normalisation.
The scenarios below provide a probability-weighted framework for where USD/JPY may finish 2026 based on the information available today.