Crude oil prices have retraced sharply toward pre-war levels, falling more than 40% from their yearly highs and reviving early-2026 concerns that supply growth could outpace demand during the second half of the year.
Oil is transitioning from a geopolitically driven market in H1 toward a more fundamentals-led environment in H2. While much of the war premium has faded, a residual geopolitical risk buffer remains. The primary shift now centers on supply normalization, particularly from the Middle East, as OPEC+ gradually unwinds production cuts alongside continued growth in non-OPEC output.
Key developments include:
- OPEC production is expected to increase by roughly 200,000 barrels per day, although the effective impact will be amplified by the normalization of flows through the Strait of Hormuz.
- As roughly 20% of global crude flows resume through Hormuz, OECD government inventories are expected to gradually rebuild after falling to their lowest levels since 1990.
Oil Producer Supply by Gulf Countries (February 2026 – June 2026)
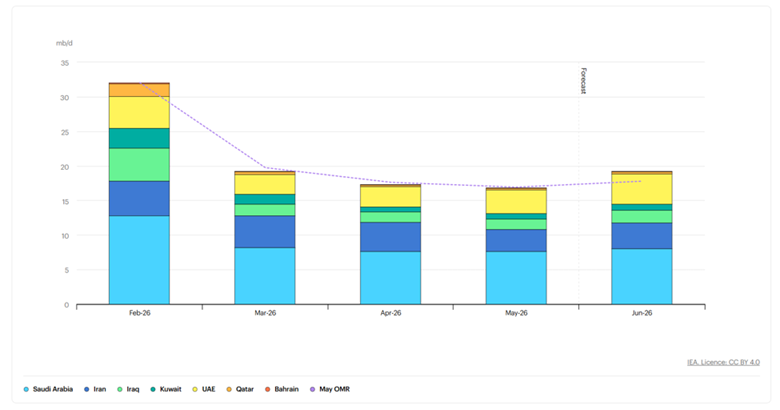
Source: IEA
Between February and June 2026, Gulf crude supply contracted by nearly 40% before beginning a gradual recovery as Hormuz flows resumed. The return of nearly 20% of global crude flows is expected to allow inventories to normalize into Q3 and Q4, particularly as global demand growth remains fragile.
Global Oil Demand Growth (2021–2026)
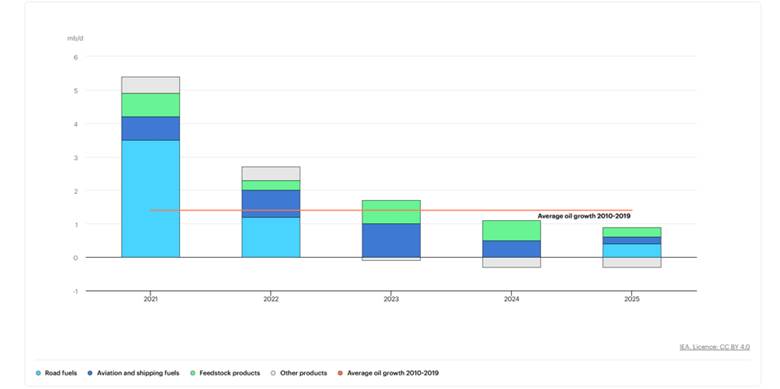
Source: IEA
According to the IEA, global oil demand growth has steadily slowed since 2021, with forecasts pointing to growth of only around 1.1 million barrels per day in 2026, reinforcing concerns that supply may once again outpace demand.
Demand headwinds remain largely structural, including:
- Slower global economic growth
- Continued improvements in energy efficiency
- Accelerating electric vehicle adoption
These factors reinforce the base case for a prolonged consolidation phase rather than a sustained bullish or bearish trend.
Macro Regime Shift: From Disruption to Rebalancing
Following a major geopolitical shock that disrupted global supply chains, economies are increasingly prioritizing resilience, self-sufficiency, and diversification of trade routes.
At the same time, producer nations are becoming increasingly focused on protecting market share after witnessing how rapidly localized conflicts can spill over into global inflation and growth risks.
This evolving macro backdrop supports a gradual rebalancing of the oil market rather than another immediate supply-driven rally.
Rates, the US Dollar, and Oil: The Feedback Loop
While physical disruptions, including Hormuz transit risks and elevated insurance costs, are likely to normalize gradually, financial markets have already repriced much of the geopolitical shock.
However, the inflationary effects stemming from higher transport costs and supply chain disruptions may linger longer than oil prices themselves, keeping major central banks—particularly the Federal Reserve—biased toward a higher-for-longer policy stance.
That environment continues to support:
- Higher front-end Treasury yields
- A structurally stronger US dollar
- Downside pressure on crude oil prices
Crude Oil H2 2026 Outlook: 3-Month Time Frame (Log Scale)
Fibonacci Retracement Analysis of the 1860–2026 Trend
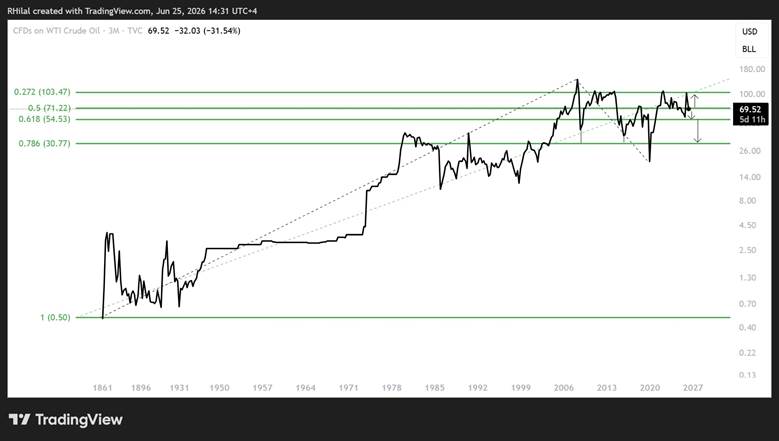
Source: TradingView
Viewed from the lows of the 1860s, crude oil's long-term trend remains structurally bullish.
The recent 40% decline represents a correction from the 27.2% Fibonacci retracement of the entire secular advance dating back to the 1860s. That zone also coincides with the 61.8% Fibonacci extension of the 1860–2008–2020 wave, creating a major resistance area that capped prices throughout the 2011–2026 period.
Following the latest decline, prices are now testing the 50% retracement of the long-term structure near $69, presenting three primary scenarios:
- Higher probability: Extended consolidation between $55 and $70
- A deeper corrective decline toward the $30 region
- Lower probability: A renewed rally toward the long-term resistance zone at $110–120, or potentially higher
Fibonacci Channel Analysis of the 1860–2026 Trend
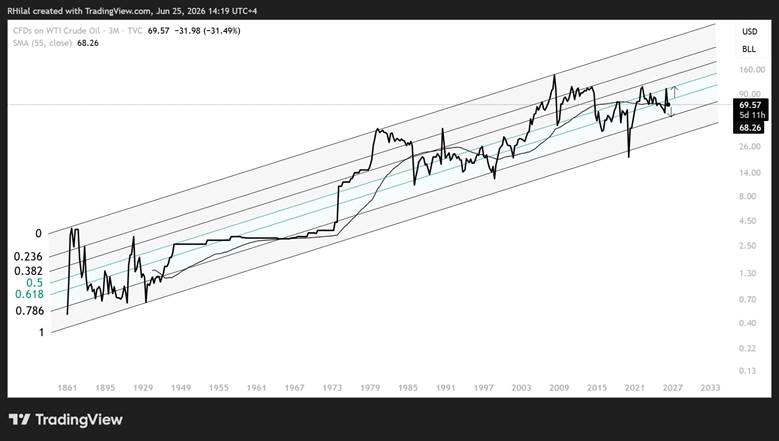
Source: TradingView
From a Fibonacci Channel perspective, the dominant long-term bullish structure remains intact, with price fluctuating between the 50% and 61.8% channel ratios. This positioning reflects a neutral-to-bearish medium-term outlook while continuing to respect the broader secular uptrend.
Price action often discounts market sentiment well before physical supply chains fully adjust.
Although the inflationary effects resulting from the temporary closure of the Strait of Hormuz—including disruptions to agricultural supply chains and sharply higher shipping insurance costs—are expected to unwind gradually, they are likely to do so more slowly than price action itself.
As a result, the Federal Reserve may maintain a relatively hawkish stance into year-end, supporting a stronger US dollar and, in turn, weighing on crude oil prices.
WTI Technical Outlook (2-Week Chart)
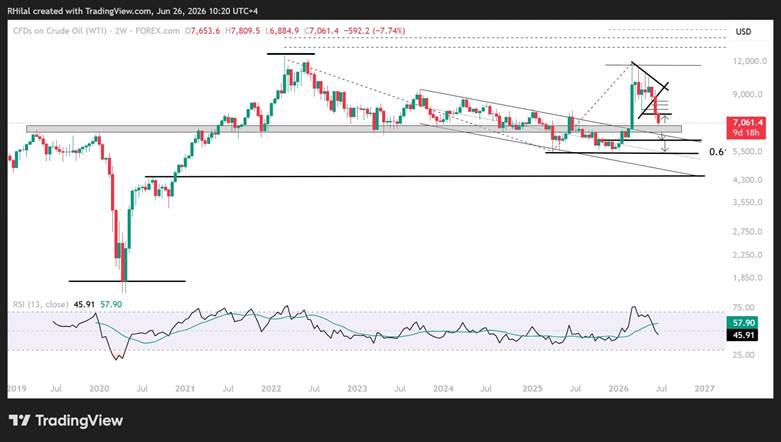
Source: TradingView
From a medium-term perspective, WTI has confirmed a bearish breakout below the March–June contracting consolidation pattern, bringing prices back toward the $70 psychological level.
The measured downside target for that breakdown remains near $55, aligning with the historical support discussed above and the 61.8% retracement of the 2020–2022 advance.
Since the decline has respected Fibonacci extension levels derived from the 2022 high–2026 low–2026 high wave, key downside support levels below $69 include:
- $66.50 – Multi-year support and resistance since 2019
- $61.00–61.30 – 78.6% Fibonacci extension of the 2022 high–2026 low–2026 high wave
- $55.00 – 61.8% retracement of the 2020–2022 rally
The $55 level could either provide another period of consolidation or confirm a deeper decline toward the $45–35 region.
On the upside, reclaiming $73.50 would improve the short-term outlook and expose $76.
Should bullish momentum strengthen further, $80 and $86 become the next major resistance levels separating bearish continuation from a return toward triple-digit prices. Such a scenario, however, would likely require another significant supply shock.
Brent Technical Outlook (2-Week Chart)
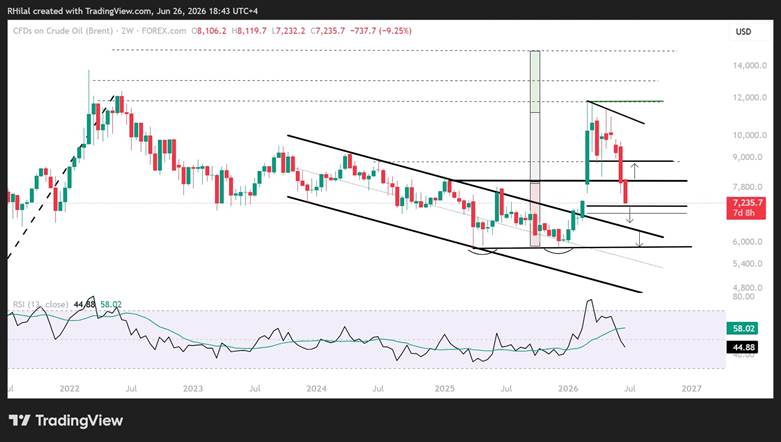
Source: TradingView
Brent recently filled the breakout gap created at the start of the Middle East conflict near $71.20, which also corresponds to the 78.6% retracement of the 2026 advance.
If prices continue lower, the next downside targets are:
- $68.80 – Major support and resistance since 2019
- $58.30 – Key support throughout 2025–2026, where another consolidation phase may emerge alongside a potential move toward $55 in WTI
On the upside, $81 and $88 remain the primary resistance levels separating bullish and bearish continuation.
Crude Oil H2 2026 Forecast
As oversupply risks gradually re-emerge into year-end, crude oil prices remain vulnerable to another $20 decline unless a new structural supply shock fundamentally alters market dynamics.
Meanwhile, alternative energy routes and long-term self-sufficiency projects across major economies continue to reshape the global oil landscape, potentially marking the beginning of a new era for energy markets. Whether these structural changes are sufficient to challenge the secular bullish trend that has persisted since the 1860s remains one of the defining questions for H2 2026 and for the years ahead.
Written by Razan Hilal, CMT
Follow on X: @Rh_waves