The Australian dollar delivered a strong performance in Q1, underpinned by RBA tightening and a widening yield advantage over the US. But the outlook for Q2 is becoming more complex.
Geopolitical tensions, elevated oil prices and shifting expectations for both the RBA and Fed are creating conflicting macro signals. While higher yields have supported the Aussie, they are increasingly being driven by inflation risks rather than growth strength—raising questions about how sustainable the rally really is.
With positioning stretched and seasonality pointing to a choppy quarter, AUD/USD may be vulnerable to near-term downside before any sustained bullish breakout can emerge.
AUD/USD Q2 Outlook: RBA Policy, Fed Rates and Oil Drive the Australian Dollar
The Australian dollar’s strong Q1 performance was largely driven by RBA tightening and a widening yield advantage over the US. But as we move into Q2, those drivers are becoming less straightforward.
Geopolitical tensions, particularly in the Middle East, are complicating the outlook for inflation and growth, while expectations for both the RBA and Fed are shifting. This leaves AUD/USD caught between supportive yield dynamics and growing macro headwinds—setting the stage for a potentially volatile and directionless quarter unless a clear catalyst emerges.
Geopolitics and Oil Risks Complicate the AUD/USD Outlook
The pattern so far has been familiar: the US signals progress on talks that Iran later claims never began. That has driven repeated swings in risk sentiment. Yet it already feels like markets have moved beyond the initial ‘shock and awe’ phase of the cycle. Not that the Australian dollar has taken much notice—it has remained largely rangebound, caught between negative risk-off flows and support from firmer commodities and expectations of further RBA tightening.
That said, the conflict in Iran is clearly complicating the outlook for the RBA. If tensions persist and the Strait of Hormuz remains disrupted, elevated oil prices could weigh on the global economy and add another layer of uncertainty for policymakers. In that scenario, higher energy prices could reinforce expectations for tighter monetary policy—particularly in the US—thereby supporting the US dollar and limiting upside for AUD/USD despite stronger commodities.
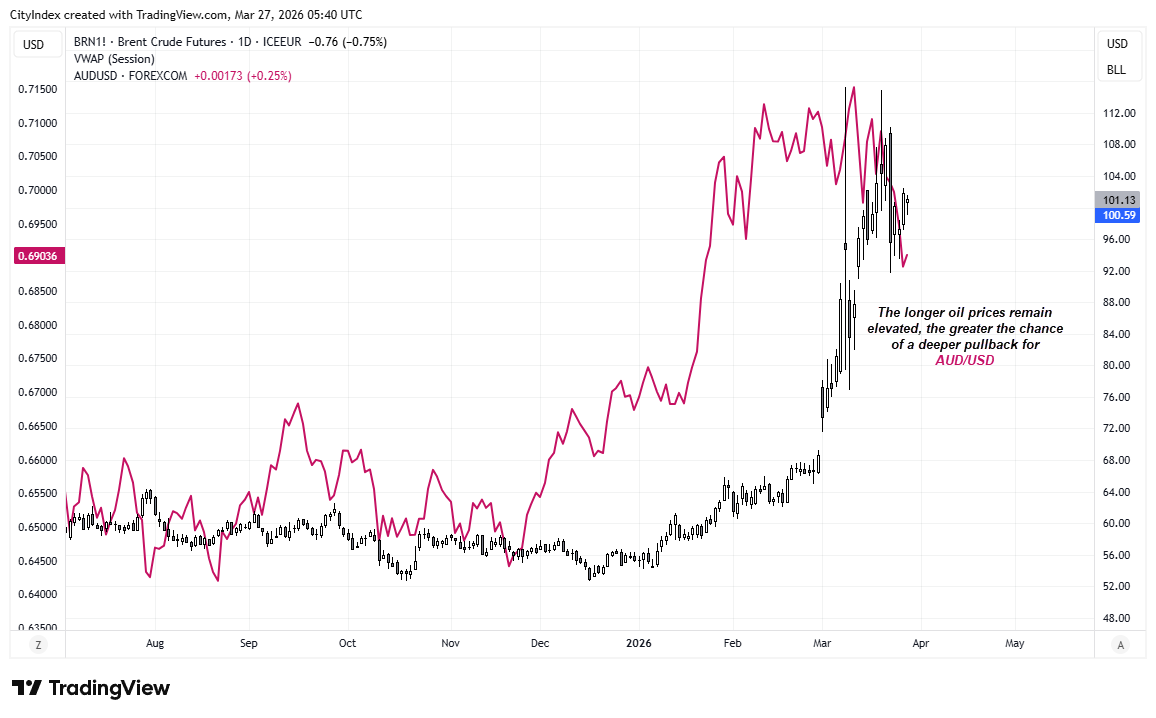
Source: TradingView
A sustained spike in oil prices would also pose downside risks to global growth, particularly in China—Australia’s largest trading partner—which could further weigh on the Australian dollar.
Conversely, any meaningful de-escalation could see oil prices retrace, easing inflation pressures and removing a key pillar of support for the US dollar. That in turn could allow AUD/USD to break higher, especially if RBA hike expectations are repriced.
On balance, the current geopolitical backdrop leans modestly supportive of the US dollar in the near term, increasing the risk of a downside break for AUD/USD before any sustained upside move.
That leaves domestic data and policy expectations as the next key drivers for AUD/USD.
- Higher oil prices could reinforce higher-for-longer rate expectations, supporting the US dollar and capping AUD/USD upside
- Higher-for-longer oil prices raise the risk of further tightening and increase recession risks further out
- China growth risks from elevated energy costs could further weigh on the Australian dollar
- De-escalation could ease inflation pressures, weaken the USD, and open the door for an AUD/USD breakout
Domestic data
With an unemployment rate at 4.3%, a participation rate of 67% and around 139k jobs added since December, the Australian economy is hardly on its knees. But that doesn’t mean there aren’t pockets of weakness. We’ve seen a steady stream of job-cut headlines from the financial and tech sectors, reflected in the 30.5k decline in full-time employment in February. Whether this broadens across other sectors will likely hinge on the trajectory of global growth, although any slowdown may not fully materialise until later in the year.
Inflation was slightly softer than expected in February, although trimmed mean CPI remained at 3.4%—above the RBA’s 2–3% target for a fourth consecutive month—while headline CPI held at 3.7%. That said, this may prove a temporary reprieve given the lagged impact of higher energy prices linked to Middle East tensions.
While growth has held up better than expected, business and consumer confidence are beginning to soften following the RBA’s recent tightening. The key question is whether this deterioration is enough to temper expectations for further hikes—and what that ultimately means for the Australian dollar.
Takeaway: The data points to a resilient but slowing economy, leaving the RBA caught between sticky inflation and softening growth — keeping the AUD/USD outlook finely balanced, with downside risks building.
RBA–Fed Policy Divergence Set to Widen?
The RBA’s February hike pushed the cash rate above the Fed’s for the first time in six years, and the follow-up move in March extended the yield differential to a nine-year high of around 35bp. The spread now looks set to widen further, although that does not necessarily imply AUD/USD will track it higher.
Assistant Governor Kent warned that persistent inflation—particularly if driven by energy—could force the RBA to tighten further to prevent inflation expectations from becoming unanchored. While rate hikes cannot offset the initial supply shock, they can limit second-round effects. RBA cash rate futures now imply around 66.5bp of tightening by December, equivalent to roughly two to three additional hikes.
However, these are not ‘happy hikes’. Policy is being tightened to anchor inflation expectations while households absorb higher energy costs, which could weigh on growth and sentiment. That dynamic raises the risk of a more bearish AUD outlook despite rising yields.
The Fed is also not in a position to cut rates any time soon, with money markets assigning around a 20–25% probability of a further hike into year-end. That should continue to underpin US yields.
Even so, the RBA’s recent hawkish shift may allow the AU–US rate differential to widen modestly further, although the net impact on AUD/USD is likely to be less straightforward given the drag from weaker growth and risk sentiment.
With macro and policy drivers becoming more conflicted, positioning and technicals may ultimately determine the next move for AUD/USD.
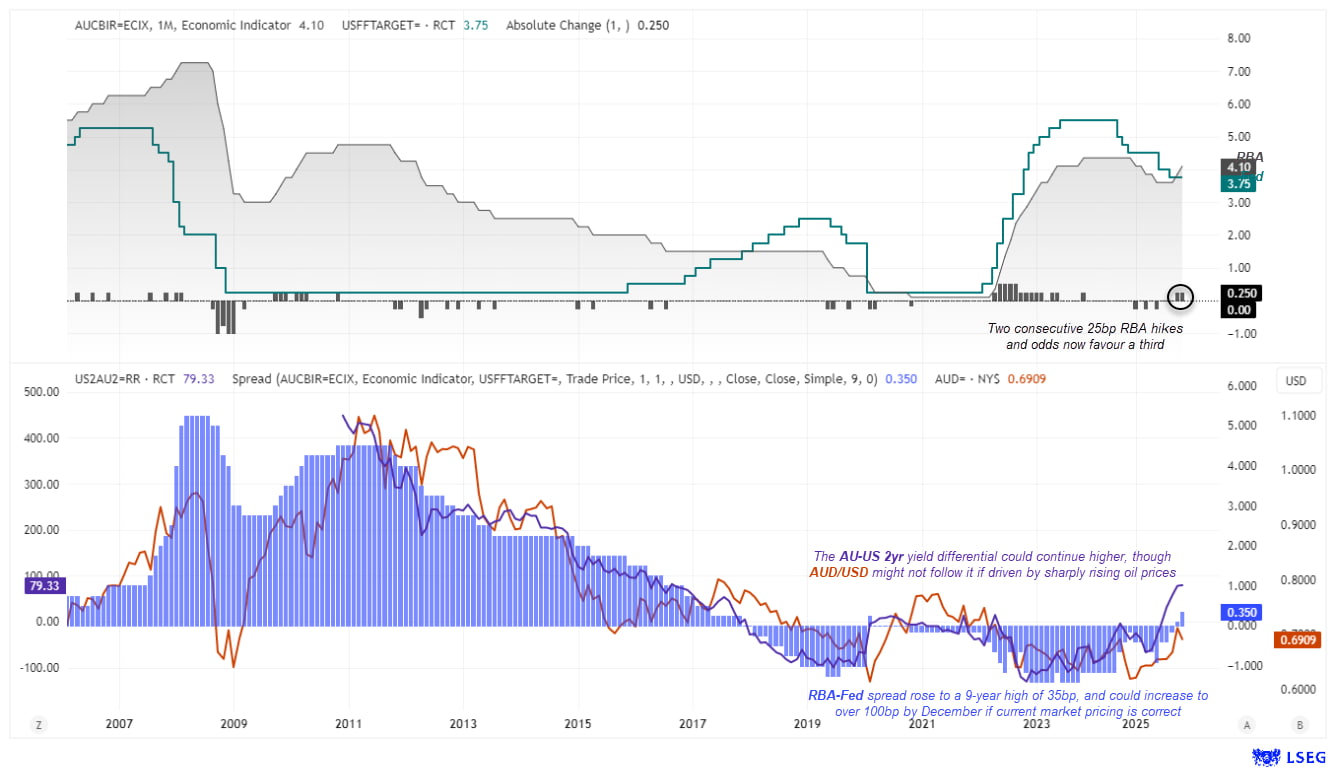
Source: LSEG
Key takeaway: Rising yield differentials may no longer translate into AUD/USD gains, as “unhappy hikes” risk weighing on growth and sentiment.
AUD/USD Technical Outlook: Positioning and Seasonality in Focus
AUD/USD Futures Positioning | COT Report
The Australian dollar has rallied over 20% since its April low and is up 7.8% year-to-date. However, the advance has stalled around the 2023 high, with positioning arguably stretched by several metrics. This raises the risk of a pullback for AUD/USD in early Q2, particularly if the US dollar index breaks higher—as I suspect it will.
- Gross long exposure has reached a record high among asset managers and a 10-year high among large speculators
- Net long exposure is also at a record high among asset managers and a 9-year high among large speculators
- Gross short exposure remains low relative to post-pandemic levels among both groups of traders
The main takeaway is that long exposure may be nearing a sentiment extreme, while there is little appetite to bet against AUD/USD. This suggests any pullback could be limited and driven more by a shakeout of longs than fresh shorting. If Middle East tensions ease, it could pave the way for a bullish breakout in the Australian dollar, particularly if RBA hike expectations are repriced higher.
Seasonality patterns also point to a less straightforward Q2.
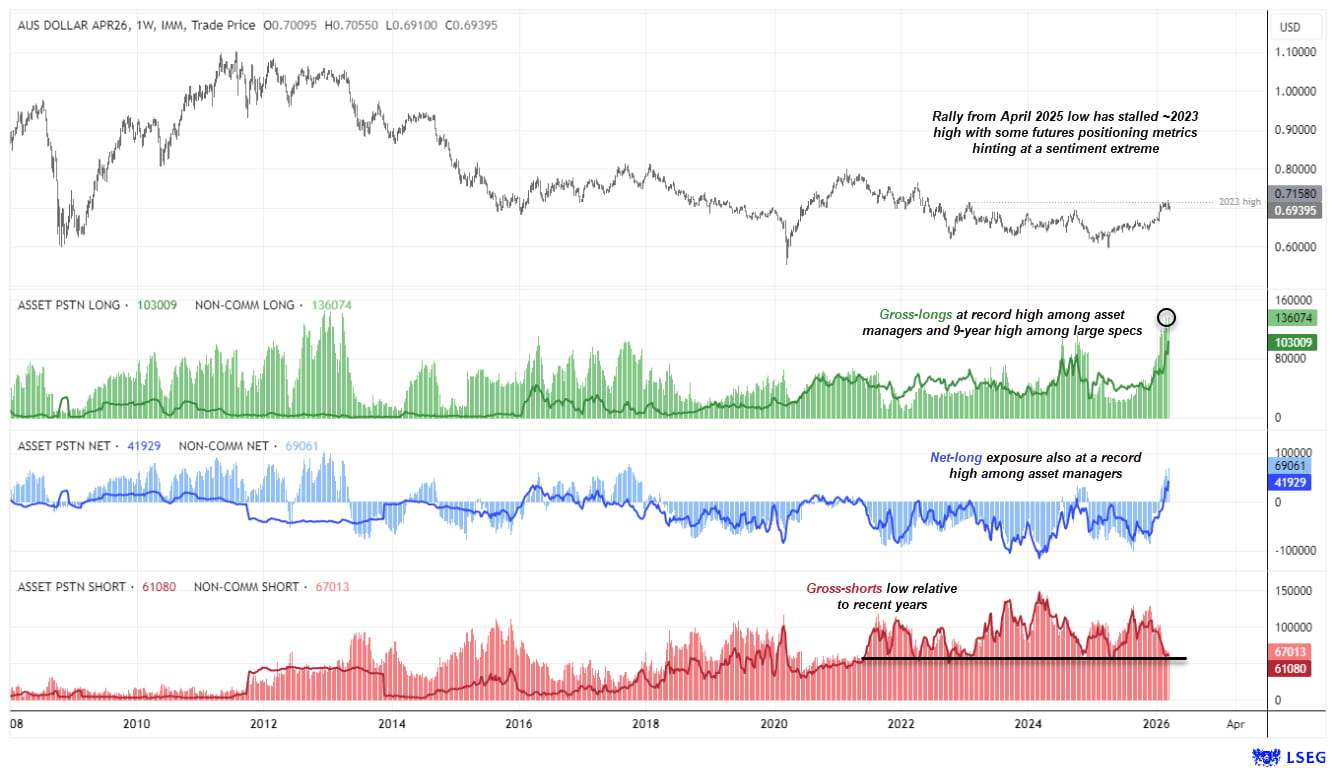
Source: CME, CFTC (COT), LSEG
AUD/USD Seasonality Trends Point to Choppy Q2
Seasonality should be taken with a pinch of salt, particularly given the rise in geopolitical risks and their potential impact on economies and central bank policies. Still, it provides a useful benchmark for what a typical month—or a strong or weak period—may look like at this time of year.
Data since 2000 shows that April tends to be the most bullish month of the year, with an average gain of 1.2%. Its median return is slightly lower at 0.9%, suggesting a handful of stronger months have lifted the average. The win rate of 64% is also respectable, while the 3.1% average gain during bullish Aprils is among the strongest of the year. Average losses for April have been around -2.1%.
May, however, tells a different story. It has negative average and median returns, alongside a relatively low win rate of 42.3%. Its average decline of -3.1% during negative months is also among the worst of the year.
June is more mixed. While its average and median returns are softer than April’s, it boasts one of the highest win rates of the year at around 53.9%.
Overall, Q2 tends to be a choppy period for AUD/USD, albeit with a modest bullish bias.
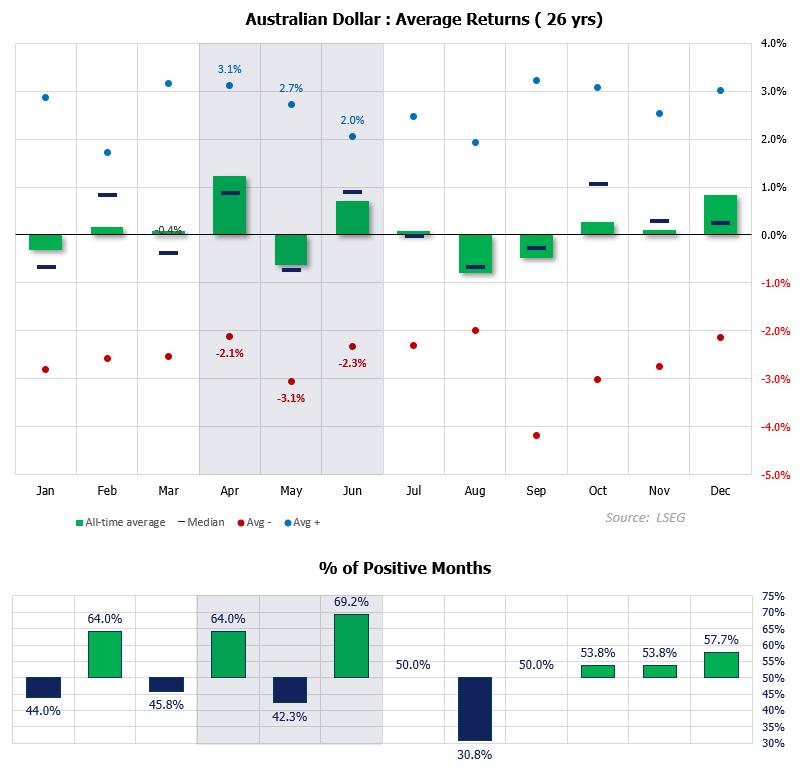
Source: LSEG
Overall, AUD/USD enters Q2 with conflicting drivers. While policy divergence may widen, growth risks and geopolitical uncertainty could limit upside. That leaves the pair vulnerable to near-term downside before any sustained bullish breakout can emerge.