It was in last year’s US equities forecast that I made the connection between the frothy conditions of the AI boom to the Dot Com bubble thirty years earlier. By the end of 2025 that had become a much more common narrative and as we go into 2026, valuations are without a doubt concerning. But, as I said a year ago, a growing bubble doesn’t necessarily mean a market condition ready to ‘pop’ and as we push into the New Year, I remain of the mind that there’s more to go before we see reversion to the mean. And, for now, pullbacks are buying opportunities as stocks have continued to stretch towards fresh all-time-highs.
In my Q4 Forecast, I provided a year-end profit target of 6958 for SPX and as I write this with two weeks remaining in the year, that remains an attainable target. On October 29th, the date of the Fed’s second rate cut of the cycle, the index came within 0.5% of that level before pulling back. That pullback was ultimately driven by fear that the Fed might avoid a December rate cut, which ended up going through anyways, but that driver highlights what’s important for stocks as we push into 2026 trade.
SPX Weekly Price Chart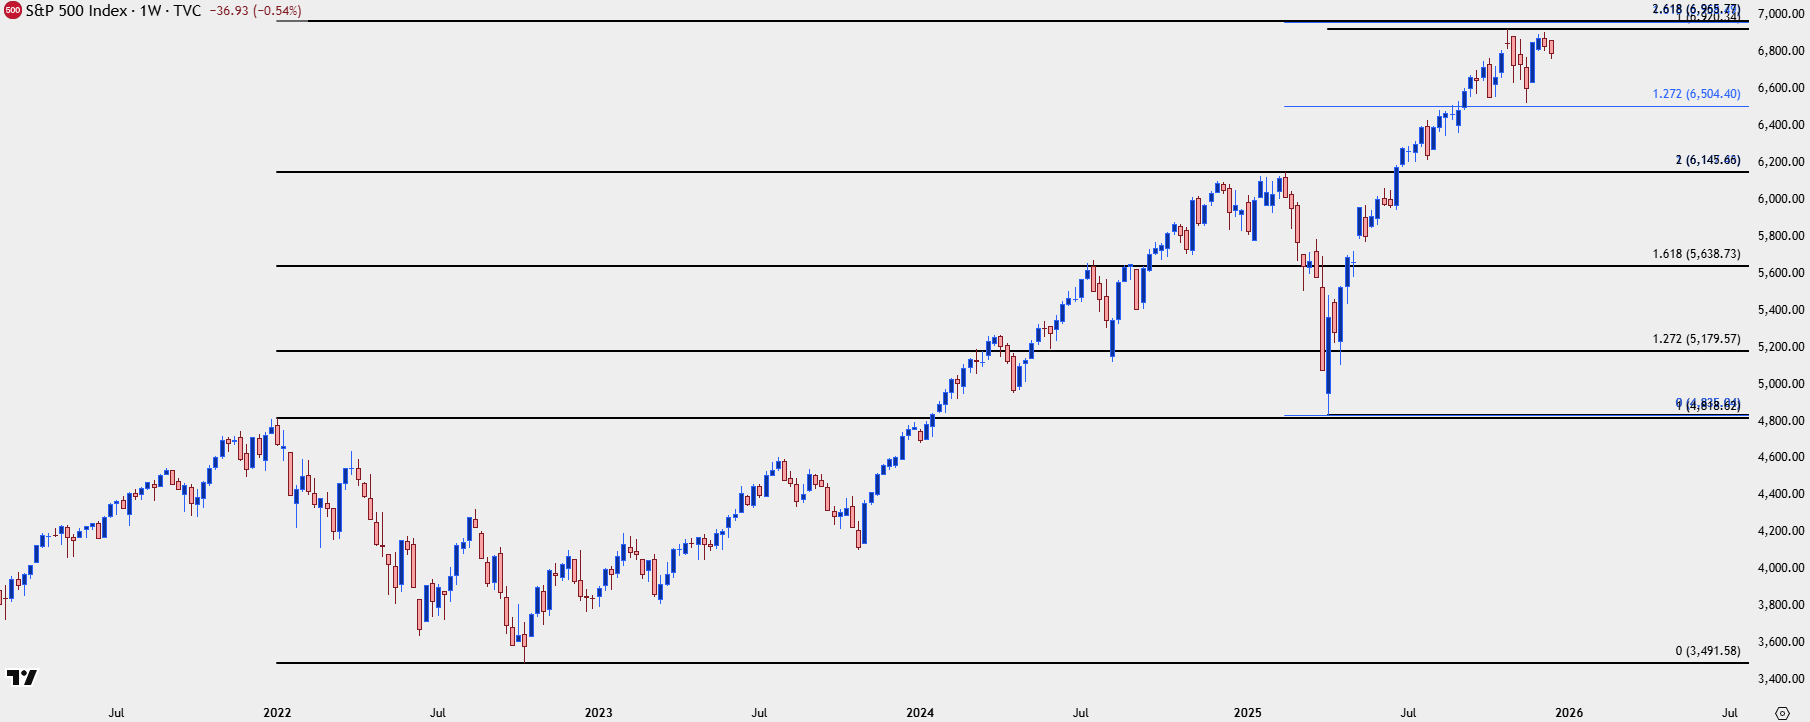
Chart prepared by James Stanley; data derived from Tradingview
Equities 2026 Forecast: Fundamentals - An Alignment of Drivers into 2026
We’re nearing a rare situation and one that really hasn’t been seen in quite some time, perhaps ever depending on your point of view. President Trump is nearing nomination of a new Federal Reserve Chair, and his comments have already indicated that rate cuts and willingness to soften policy are going to be a necessity for whomever he ultimately names. At this point, it seems down to two options with either Kevin Warsh or Kevin Hassett; and some of the more eye-catching comments have been that President Trump would like to see rates fall below 1% by the end of the year, and that he would like the next Fed Chair to consult with him before making rate decisions. He’s also said that an openness to rate cuts was a ‘litmus test’ in naming the next Fed Chair. And this is the very item that stands out as different this time, as the Federal Reserve’s independence seems to be as distant a prospect as it has since Arthur Burns; and perhaps even before that.
This doesn’t necessarily spell doom for equity markets however, and that rate softness, especially up front, can be argued as a strong factor for stocks as there’s a host of fiscal expansion measures coming online in 2026, and that will be coupled with what seems to be strong monetary accommodation - with the aim of setting up Trump and the Republican party for mid-term elections to be held in November. The linchpin to this is inflation data, as that’s ultimately the item that could compel the Fed to stop cutting rates and perhaps even eventually lean towards rate hikes. And to be sure, this may not even be an item that the Fed can stand in the way of as we saw in 2024 with rates markets pushing Treasury yields higher even as the Fed leaned deeper into rate cuts and softer policy.
Into 2026, the fear is weakness in the labor market, a fact obfuscated by the government shutdown slowing data to a trickle and forcing markets to infer perhaps more than usual on a limited number of factors. But provided inflation doesn’t surprise significantly to the upside, the door is open for a rare alignment of expansionary fiscal policy to go along with a rate cutting regime from the Federal Reserve and that can push growth rates higher, even with valuations already quite stretched.
And given that heavy one-sided positioning, this makes the prospect of chasing breakouts even more daunting, as managing risk on those strategies can be challenging with price so far away from nearby supports. But, as I said coming into 2025, pullbacks can be seen as opportunistic given that the large drivers behind fiscal and monetary expansion (Trump and his candidates for Fed Chair) seem keenly aware of the levers they need to push to make growth numbers continue higher.
Nasdaq 100 Weekly Chart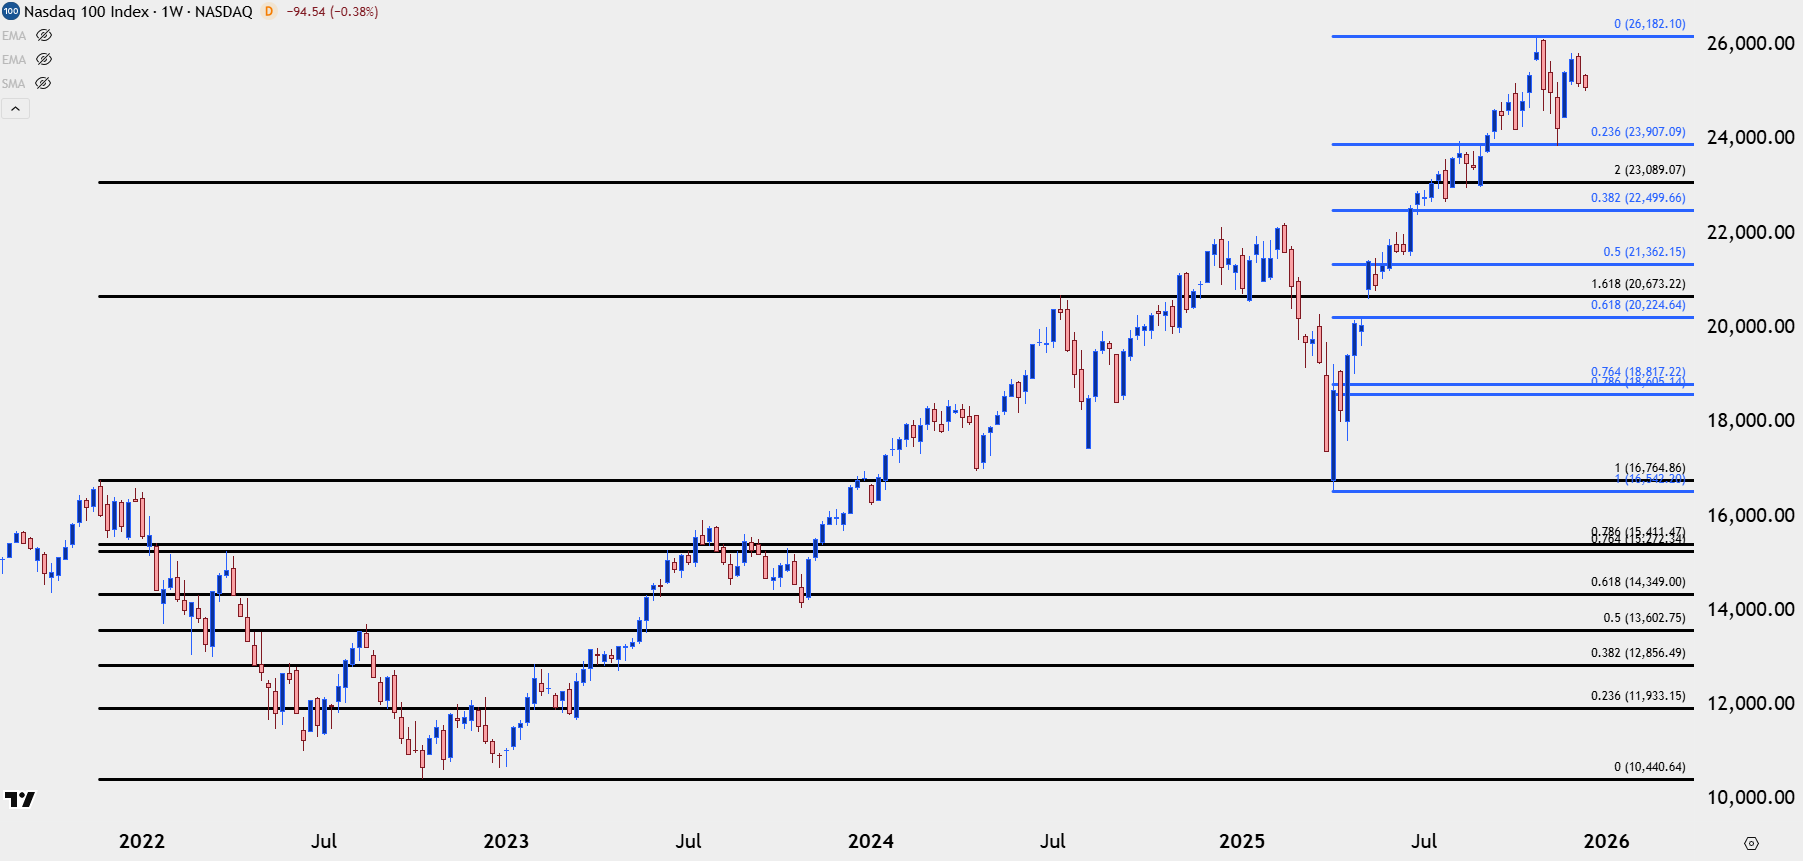
Chart prepared by James Stanley; data derived from Tradingview
Bad is Good, Good is Good-ish, but High Inflation is Terrible
Since the Fed began accumulating assets on the balance sheet there’s been a regular push towards the theme of ‘bad is good,’ driven by the idea that bad news keeps the Fed operating in the market which, in-turn, continues to push the rising tide that floats all boats.
The risk to this forecast is inflation, as higher levels of inflation could deter the Fed from more monetary softening and given the fiscal expansion measures that are online for next year, a turn at the Fed could soon be a necessity should inflation rise.
Going back to my 2025 Forecast for Equities, there’s many parallels between the AI boom today and the Dot Com boom from 30 years ago. Valuations are stretched, AI-names have been bid to massive levels as Dot Com names were back then, and valuations across indices have become quite stretched. But what ultimately popped the Tech bubble then was a series of interest rate hikes from the Federal Reserve in 1999 and 2000, capped by a 50 bp hike in May of 2000 when stocks had already peaked (although we didn’t quite know that yet). The year of 2001 was a dramatic series of rate cuts from the Fed as they tried to stem the bleeding of economic fallout. Those rate cuts then helped to build a bubble in the housing market in the US, which was then countered by more rate cuts and the introduction of QE which probably had a larger role in the macroeconomic backdrop than rate cuts did.
Since then – the Fed has been ultra cautious around causing economic disruption and this has seemingly been driven by the ‘wealth effect,’ which states that consumers feeling more flush with larger investment and retirement accounts are more apt to spend money, thereby helping to produce more growth, corporate profits, etc. The few episodes of reversion that have appeared since the Financial Collapse have large been addressed by the Fed’s extraordinary tools being employed in extraordinary ways.
This isn’t to say that the Fed is perfect because they’re not, and the 2021 ‘transitory’ episode is evidence of such. But even that highlights the fact that the bank will likely err towards the side of more growth than less inflation if necessary. And until there’s evidence that inflation must be addressed, such as we saw in 2022, I think that we’ll see the bank continue to push loose monetary policy which will drives equity prices higher.
The Bubble Talk
Also, from my 2025 Forecast on Equities was the Alan Greenspan ‘irrational exuberance’ story. Greenspan coined this term in December of 1996 in a speech talking about the excessive run in equity prices at the time, and in many recounts of Greenspan’s tenure atop the Fed, this is looked at as the first signs or indications that a bubble may be forming. The timing of that, however, was not great as it wasn’t until March of 2000 that equities ultimately topped and if Greenspan had opened a short position on his initial claim of irrational exuberance, he would’ve been in a difficult spot as stocks just continued to rise in a parabolic manner for years after.
Knowing that we’re in a bubble doesn’t necessarily help to dictate trading strategy and as we saw in late-2025 trade, it seems obvious that many think we’re in an AI-fueled bubble.
But there’s another thought here, which is the rational bubble paradox, an idea popularized by economist Robert Samuelson that describes how an asset’s price can rise far above its fundamental value even in a rational manner; because investors expect future prices to rise even higher which then create a self-fulfilling prophecy, even if detached from intrinsic value. This is why we can see equity prices continue higher even given the already-stretched valuations have pushed to levels that have historically created mean-reversion: If there’s not an inherent demand for investors to look elsewhere, they can continue the speculation chain of bidding prices even higher and higher.
Of course, this isn’t something that I would expect in perpetuity because at some point, inflation will demand the Fed to change tact and that’s when there could be a growing concern for ‘looking elsewhere.’ But guessing that point has historically been a point of folly as we can see from Greenspan’s 1996 speech on irrational exuberance; and in markets, timing matters.
The question here is whether that will take place in 2026 and this is where Trump’s gambit comes to question, as mid-terms later in the year are probably hanging in the balance. If we see inflation run and the Fed forced to hike, fueling a sell-off in equities and a negative spin from the wealth effect, those mid-terms can be more difficult for Republicans to win, setting Trump for a rough back-half of his second term.
But, from where I sit ahead of the 2026 open this is pure speculation as there’s no sign yet that equities are ready to turn over.
In my Q4 Forecast, I provided a year-end profit target of 6958 for SPX and as I write this with two weeks remaining in the year, that remains an attainable target. On October 29th, the date of the Fed’s second rate cut of the cycle, the index came within 0.5% of that level before pulling back. That pullback was ultimately driven by fear that the Fed might avoid a December rate cut, which ended up going through anyways, but that driver highlights what’s important for stocks as we push into 2026 trade.
SPX Weekly Price Chart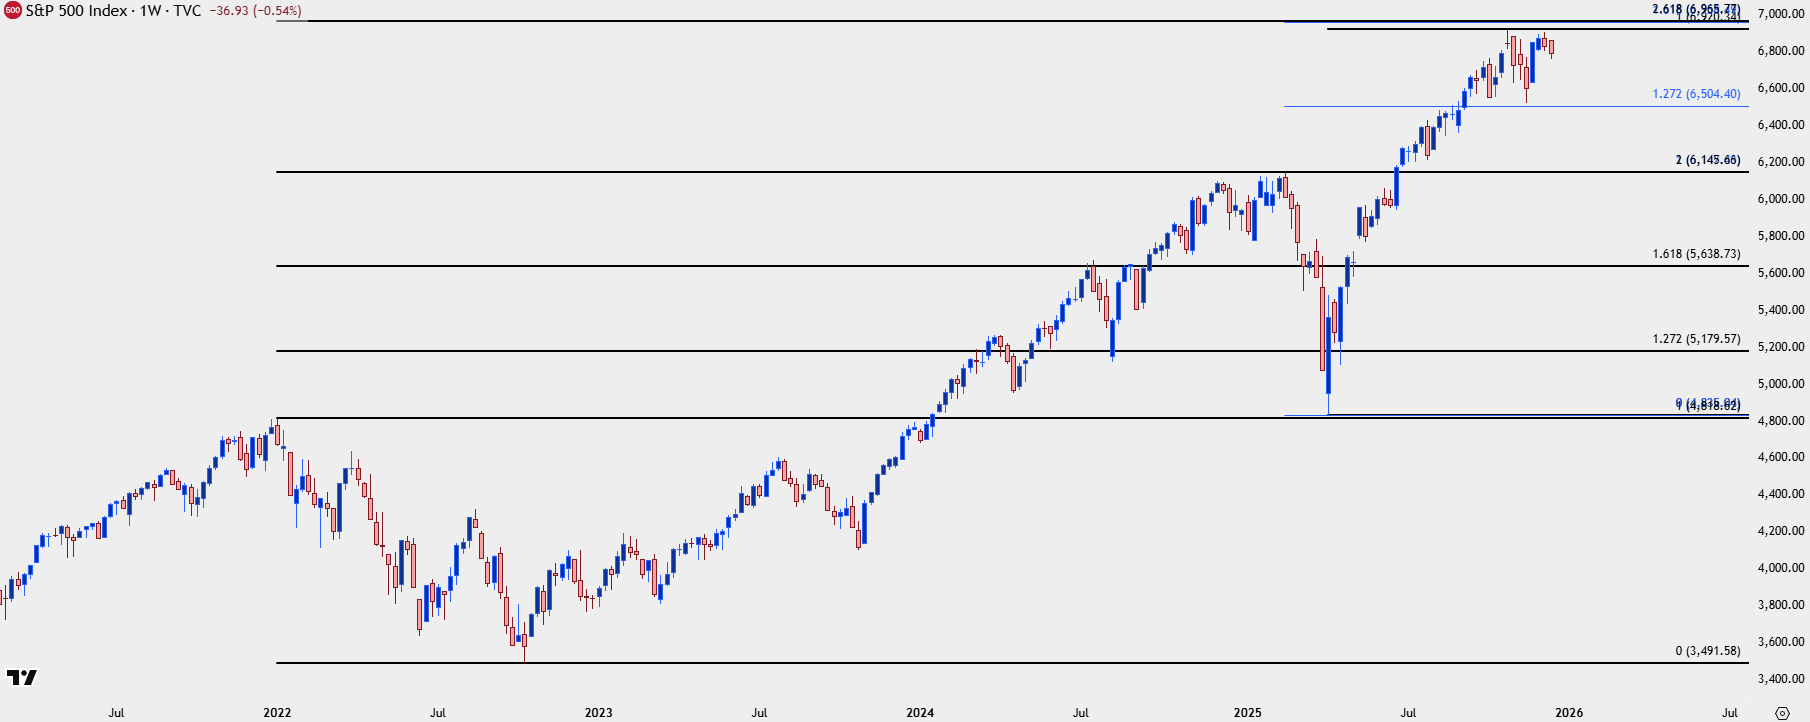
Chart prepared by James Stanley; data derived from Tradingview
2026 Equities Forecast: Technicals
SPX Target: 7500
For 2026 I’m looking for a target of 7500 on SPX. This is a confluent spot with both the 27.2% extension of the April-October rally and a 100% measured move of the early-2025 sell-off. That structure was validated a couple of different times, in my opinion, as the 27.2% extension was resistance that was later defended as support, and the 61.8% extension was my 2025 year-end target which was less than 0.5% away from the high; and with two weeks left in the year remains a viable target by year-end.
SPX Daily Price Chart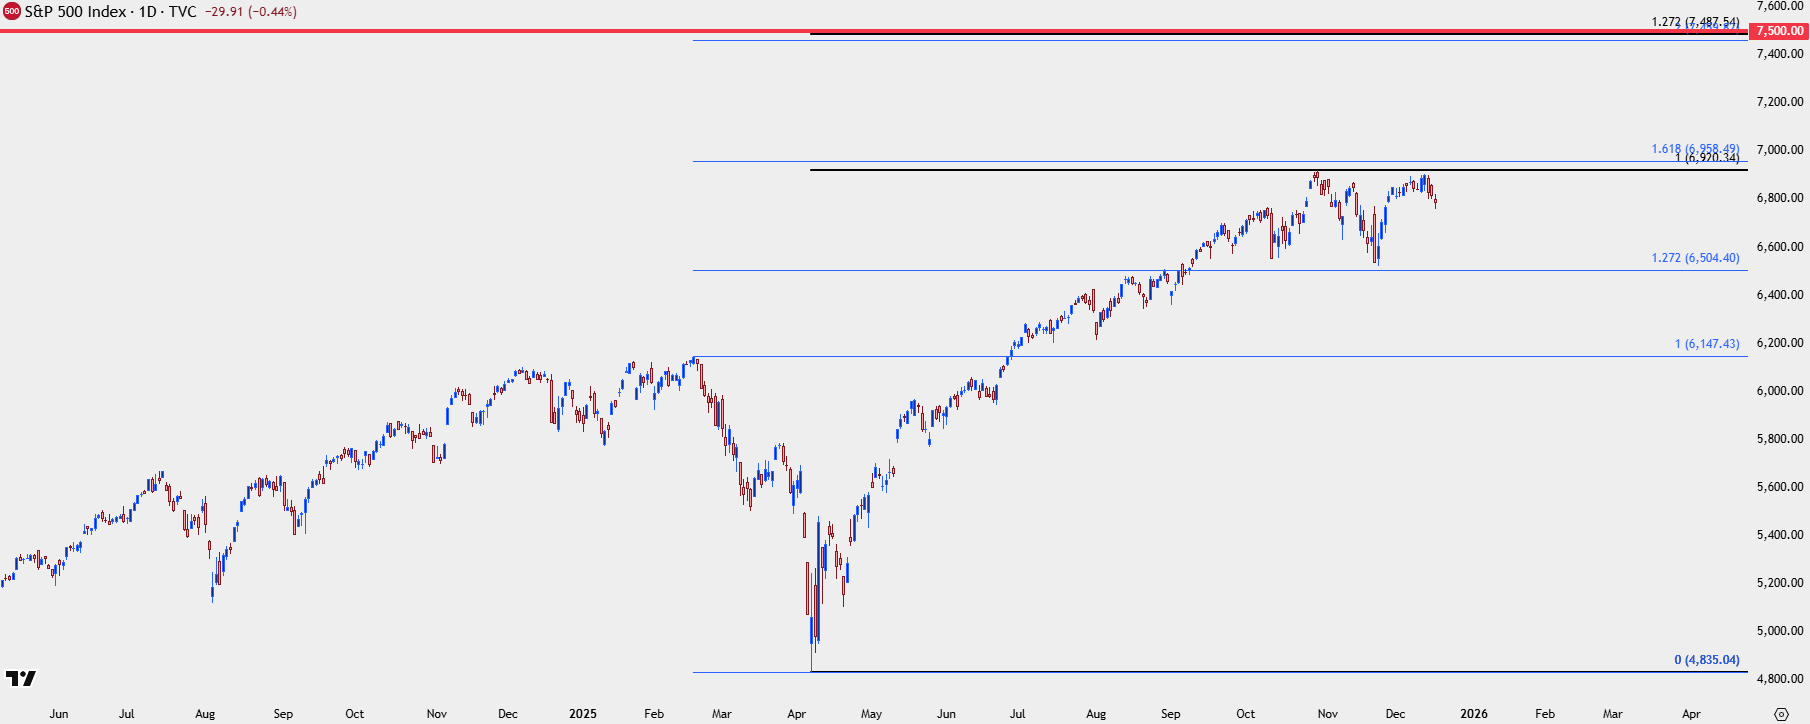
Chart prepared by James Stanley; data derived from Tradingview
Nasdaq 100
In the 2025 Forecast and for my top trade idea for the year, I looked at the long side of equities but only after a pullback. In the Nasdaq, it was my third level of support, around the 17k level that was tested at the April lows and ultimately led into a massive rally of 58.27% into the 2025 high.
For next year my stance is the same: The long side remains attractive but from a risk management perspective price is simply too high to chase up to higher-highs. So, for pullbacks, there remains interest for continuation scenarios and the spot that I think would ideally come into play is the 24k level that was resistance-turned-support. Below that, the 22,133-22,500 area is of interest, and the 20k-20224 zone can also be argued as an ‘s3’ spot of support. If bulls can’t hold prices above that then we’re likely already seeing some significant change on the horizon.
Nasdaq 100 Daily Chart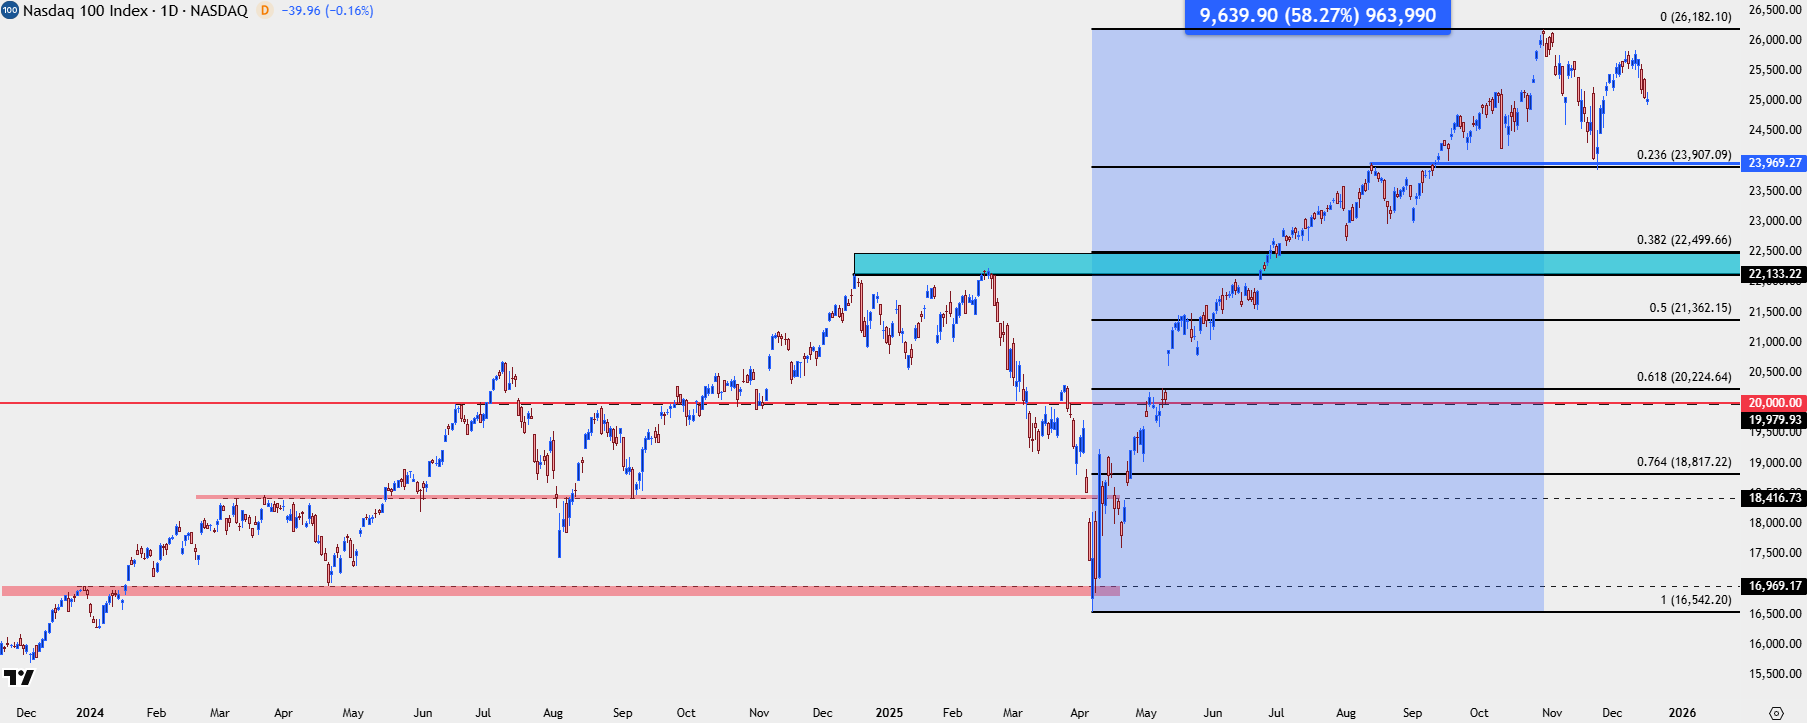
Chart prepared by James Stanley; data derived from Tradingview
--- written by James Stanley, Senior Market Analyst, Global Macro