Talking Points:
- The US-Iran conflict triggered a global swoon among global indices and risk assets similar to 2025 Liberation Day tariffs last year – can ‘recovery rallies’ continue to advance bulls?
- AI is still touted as a transformative theme, but can it fend off constant geopolitical upheaval and the trend towards monetary policy tightening?
- US indices’ proximity to record highs seem to maintain their status as pacing the bulls, but it may be more a preference for tech than it is American exposure
What are the Clear and Consistent Fundamental Themes
Equity markets are in large part a reflection of the general risk appetite settings for the broader market. Sure there are unique fundamental considerations that can lead to the divergence between different regions’ stock markets; but in general, risk appetite tends to a dominant governing principal of stock index trends – whether bullish, bearish or neutral. That said, the first half of 2026 seemed to experience a few reversals in underlying sentiment. The first quarter seemed to be on pace for a quiet but consistent grind higher for the likes of the S&P 500, FTSE 100 and Nikkei 225 until the breakout of the US-Iran war on February 28th.
A new conflict in the Middle East and the closure of the vital Strait of Hormuz triggered a retreat initiated by shock and carried through by tangible downstream economic consequences. However, despite the global impact of the engagement, major equity benchmarks would notch technical corrections but not full ‘bear market’ designations, which is 10 percent and 20 percent retracement from highs respectively. Less than 40 days after the intense attacks began, the US and Iran announced a ceasefire that would eventually turn into a 60-day Memorandum of Understanding to allow for peace during further negotiations. In turn, markets indulged a recovery rally that retraced all the preceding losses and more.
Chart of the S&P 500 and Key Fundamental Events (Weekly)
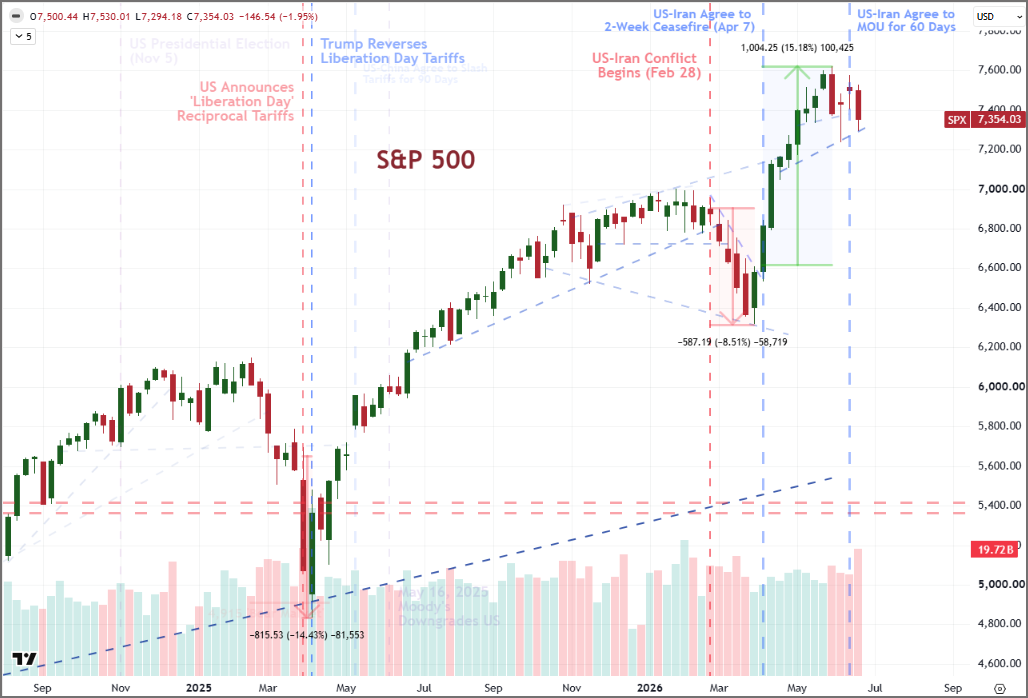
Source: TradingView.com; John Kicklighter
This pattern was remarkably similar to one seen approximately a year before when US President Donald Trump exacerbated a retreat by announcing a Liberation Day of ‘reciprocal tariffs’ against a laundry list of trade partners. Yet, just before the S&P 500 tipped into a full ‘bear market’, the President walked back the import levies and the markets eventually returned to record highs. The result of this 2025 fundamental wobble seemed to be the imposition of a ‘discount’ that bulls would find opportunity to re-enter a larger advance beginning after the rout from the pandemic in early 2020. How persistent is the market’s next bullish leg without the opportunity of a pullback to offer an economical entry for those still suffering from FOMO?
A Struggle for Fundamentals to Live Up To – Much Less Pace – Enthusiasm
Without an exogenous catalyst for a temporary recharge of speculative appetite, what does the fundamental backdrop look like for global capital markets? First and foremost, the aftermath of the US-Iran conflict looks less-than-settled. Even in a best-case scenario for negotiations and the path to peace, there will be lingering aftereffects of the two months of the virtual standstill in Hormuz traffic. There is no favorable scenario to be drawn from this period, only less-severe-than-expected circumstances such as a quick retreat in inflation which can curb the tightening response by major central banks – a policy path that typically has a negative impact on equity performance.
General growth trends are still unclear as a macro foundation with greater risk of underperforming – particularly against the backdrop of record highs in stock prices. Similarly, trade relations are still sour with the US looking to avenge perceived injustice and exploration to circumnavigate the dollar still underway. One of the last bastions of outright enthusiasm seems to be the promise of AI (Artificial Intelligence). There are corollaries being drawn to this new technology and its influence on the economy harkening back to the internet revolution around the turn of the century or the industrial revolution a century before that.
There is opportunity to stretch the speculative gains against the ambiguity around how much impact this new wave of innovation brings. In 2025 and 2026, the value seems to have been derived through the amount of spending major tech companies have poured in to lead the race. That positive interpretation has sense turned into scrutiny over tangible value in the closing weeks of the second quarter. New versions of LLMs and headlines trumpeting major companies (not the tech leaders) integrating AI for greater efficiencies are inevitable, but the markets are likely to be more skeptical around its value implications going forward. Following the SpaceX IPO, if major AI players like OpenAI and Anthropic push back their timing to go public, it will likely be registered as concern that the bullish wave has crested…at least for the near term.
Google Trends Global Scale of Search for Key Fundamental Themes
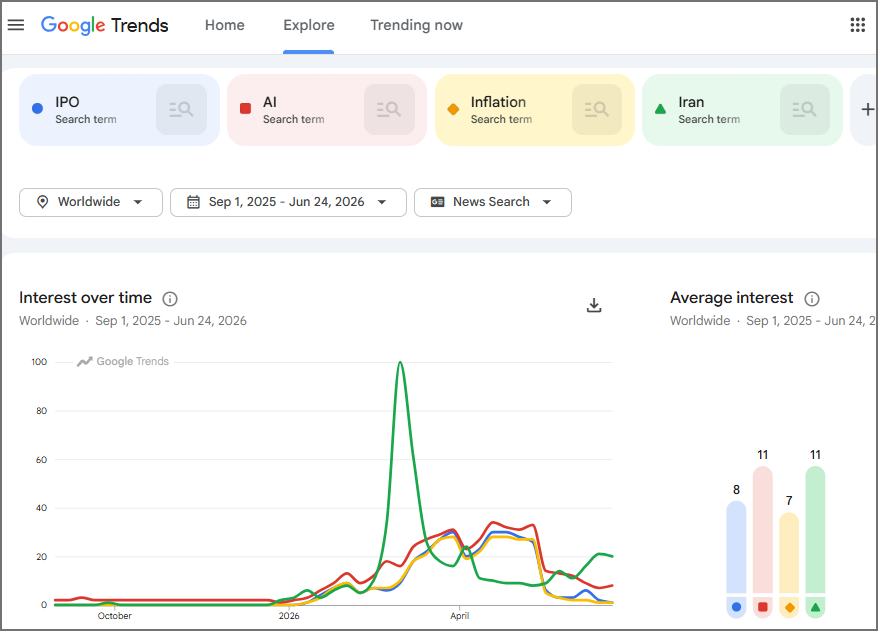
Source: Google Trends; John Kicklighter
Considering the Seasonal and Longer-Term Cycles
Shifting the focus from themes to ‘market conditions’, we are entering a period of the traditional calendar year that may find traditional expectations providing some reprieve to closer fundamental scrutiny. Historically, we are entering into the notorious ‘summer doldrums’ where volume tends to drain and volatility hits its nadir (using the S&P 500 as the baseline). While there are averages around market performance, the skew around the sample size can vary wildly. The activity levels, on the other hand, are more reliable. If the summer months for the Northern hemisphere adhere to norms of vacation and family time, it can compound resilience against strong swoons of risk aversion through shallower markets or outright bits to halt collapse in less liquid underlying positions. When market participants and volatility return late September, though, it is all bets off.
S&P 500 Averaged Performance and Volume by Calendar Week
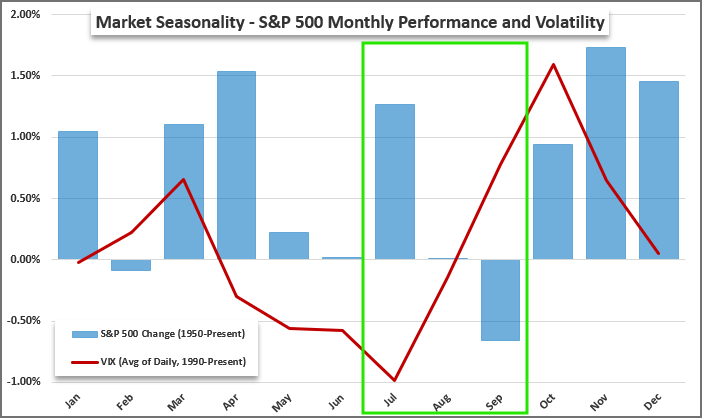
Source: Standard & Poor’s; John Kicklighter
On a longer and less cyclical time frame, it is worth considering where we may be on the scale of a full market cycle. There is wide room for debate on this, but the general population would likely put us either in the accumulation/growth or maturity/mania phase of the traditional cycle. Cynics can label our current standing as late-stage mania born of the AI boom. For the true believers in the technology, they believe we are only starting to realize the value implications on the economy and therefore the market. As incredible as artificial intelligence may ultimately prove, it is unlikely to continue to unfold and advance at an accelerating pace to match the incredible pace seen in US indices. I believe that we are in the maturity phase of the cycle, but the actual turn will likely require a tangible weight on fundamentals and not a mere disappointment that the value-add is not as incredible as current valuations and spending suggest.
Stages of a Market Cycle and Bubble
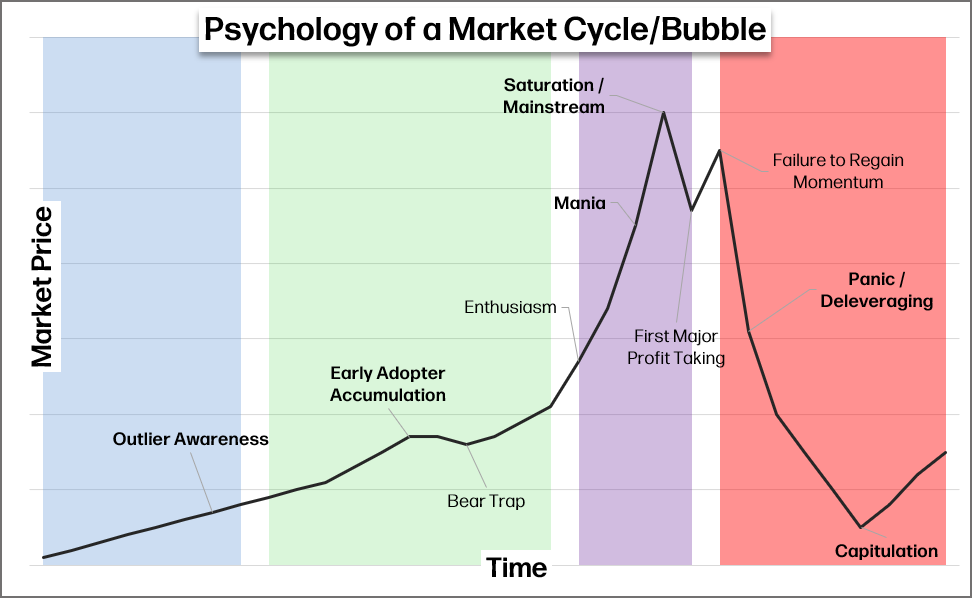
Source: John Kicklighter
Americas: The Nasdaq 100 Leads the Technical Race
Through the second quarter, there seemed to be a transition in speculative pacing whereby the PHLX Semiconductor Index (the SOX) took up the representative lead for the AI trade – over more familiar banners like the Magnificent 7 or the Nasdaq 100. I still think the NDQ is the more anchored benchmark for AI, tech and American market representation. It is also experiencing a significant premium in volatility – with the VXN-VIX difference the highest in over two decades. If the index manages new record highs, I suspect it will be a slower climb similar to 2024 or post-Liberation Day reversal 2025. Alternatively, breaking below 28,000 and 26,000 – particularly if there isn’t an extremely unilateral catalyst for the move – can dig deeper into traders’ psyches.
Chart of the Nasdaq 100 with 12-Week ATR (Weekly)
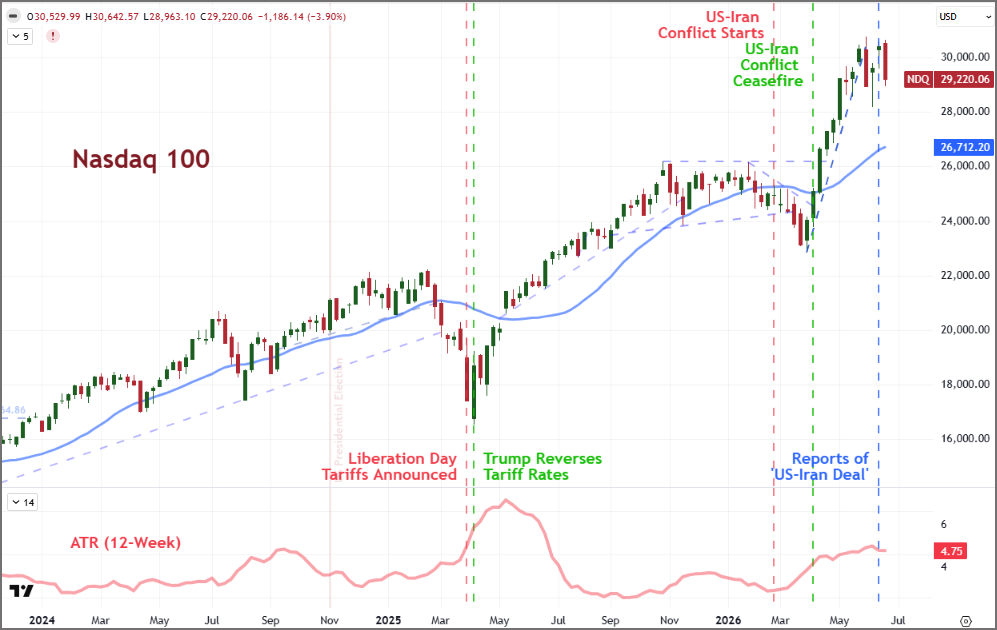
Source: TradingView.com; John Kicklighter
European Markets Look Like American Benchmarks with More Congestion
From a chart’s perspective, the European indices seem to have the same general structure as their American counterparts. However, there seems to be a notable throttle to the enthusiasm relative to their Western peers. Where the S&P 500 and Nasdaq 100 have pushed to fresh record highs in the second quarter, the FTSE 100, DAX 40 and CAC 40 very noticeably did not. These major indices developed congestion patterns that show a more uncertain picture of convictions moving forward. Resolution higher may ultimately be the order, but the curb in enthusiasm will not go unnoticed. Clearing either 11,000 or 10,000 will be the first order for deciding commitment for the FTSE 100 into Q3 but the dominant trend is still bullish.
Chart of the FTSE 100 and Relative Momentum Overlaid with UK 10-Year Yields (Weekly)
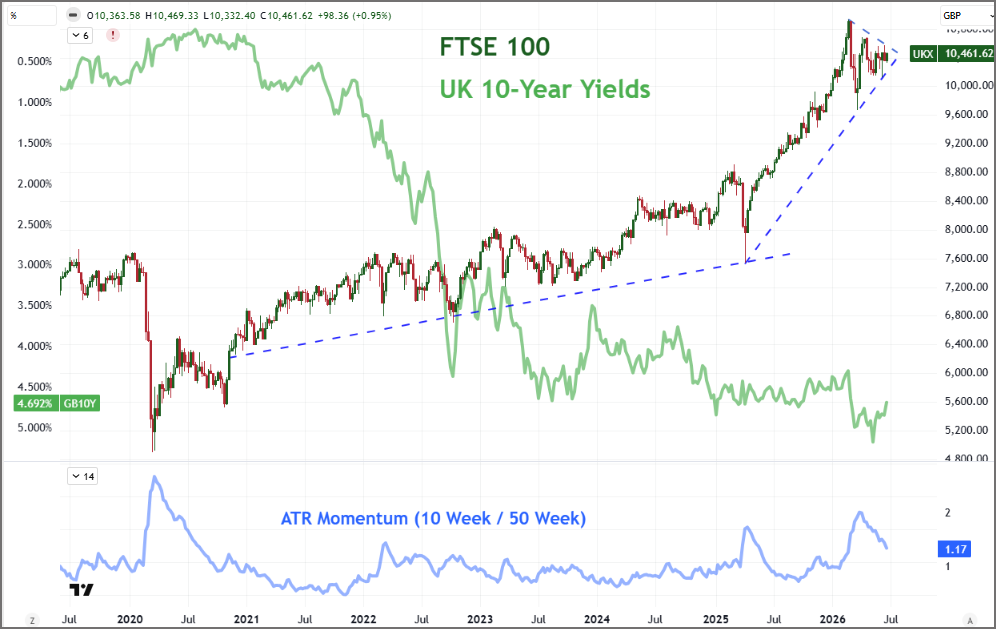
Source: TradingView.com; John Kicklighter
Nikkei 225 Charge Draws Contrast to the Yen’s Slide
Among the dominant APAC stock indices, the Nikkei 225 deserves close attention heading into the second half of 2026. The momentum of the Japan index’s climb is extraordinary. In fact, in the climb through June, the market stretched well over 30 percent above its trailing 100-day simple moving average. That is the largest stretch in acceleration over the long-term benchmark in 13 years – a peak that eventually lead to a ‘bear market’ flip in mere weeks. There are some extreme drivers contributing to this extreme move – like the rapid drop in the Japanese Yen to multi-decade lows – and those influences are likely to prove as temporary as the tempo in the charts. The question is whether their resolution will result in settling at highs or a necessary retrenchment.
Chart of Nikkei 225 Overlaid with the USDJPY Exchange Rate (Weekly)
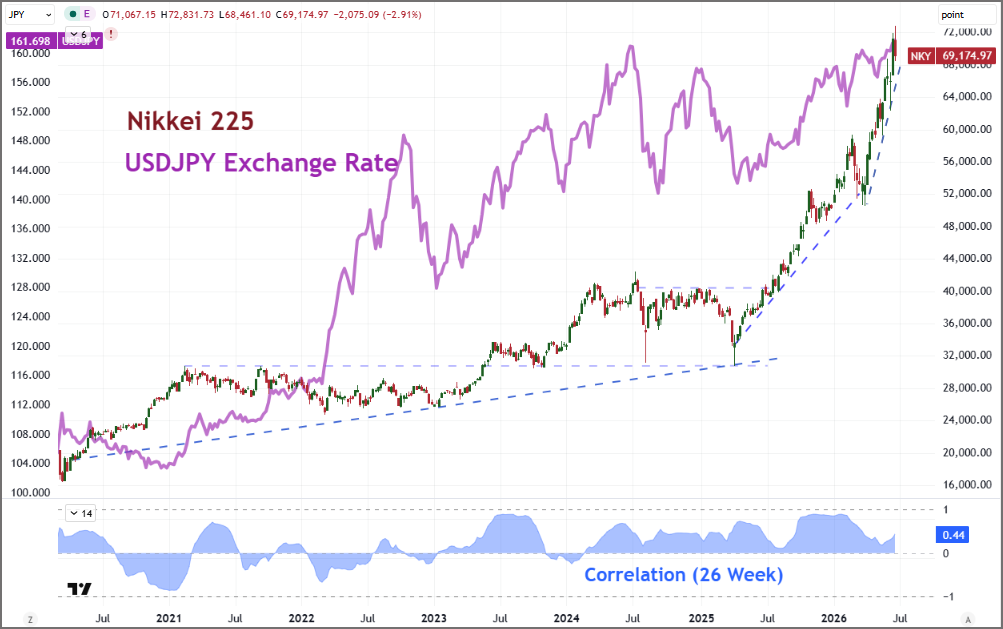
Source: TradingView.com; John Kicklighter
KOSPI is Asia’s AI Beacon – For Better or Worse
One more index to keep close tabs on is South Korea’s KOSPI. While Japan’s Nikkei 225 is an outperformer and representative of one of the largest economies in the world, the KOSPI has significantly outperformed over the past year. The tech concentration of the index has amplified the year-over-year performance of the South Korean benchmark to an incredible ~170 percent climb versus its Japanese counterpart’s ~75 percent swell. This move is far more extreme and has pushed the ‘acceleration’ (spot relative to 100-day SMA) to heights not seen since 1998. If this index starts to reverse in earnest, it can offer a signal to the broader market.
Chart of the KOSPI with 100-Day SMA and Relative Position (Weekly)
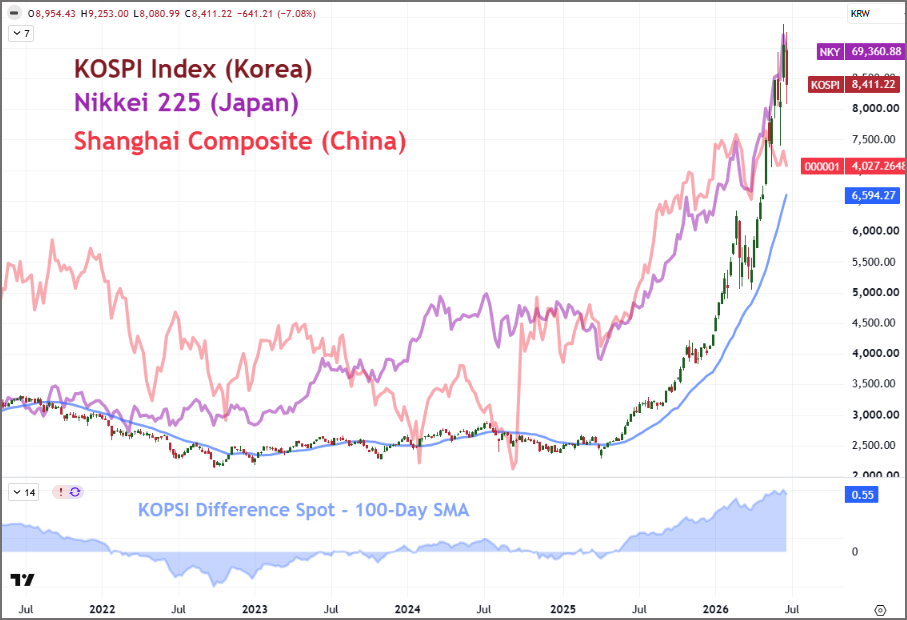
Source: TradingView.com; John Kicklighter
Access More Global Macro Insights, Forecasts and Tools
Stay connected to timely global macro analysis designed to help market participants navigate shifting economic conditions and evolving risk. Gain access to regular market commentary, updated quarterly forecasts, a comprehensive two-week forward economic event calendar, and specialized tools built to support informed trading and risk management decisions.
Sign Up
-- Written by John Kicklighter, Senior Strategist and Global Head of Content