
Gold 2026 Outlook: What’s in store for XAU/USD in Q2?
Gold has been on a rollercoaster ride in recent quarters - how will the precious metal fare in Q2? Read our full outlook!

Fawad Razaqzada
- Global Macro
By: Editorial Team, StoneX Media
Q4, 2025 Forecast for US Equities: S&P 500, Nasdaq 100
As we move into Q4 there’s a similar backdrop in US equities as what was showing at the start of the year: A well-priced bullish rally that has shown only a minimum of pullback lately. We had the start of rate cuts at the September FOMC meeting, in both years, and there’s a wide expectation for another 50 bps in cuts for 2025, along with more softening in 2026 and 2027. Frankly, there’s little reason to doubt the bullish trend that’s taken over stocks from the April lows and the one hindrance at this point is just how aggressively that’s priced in, with the Nasdaq 100 up almost 50% from the lows of just five months ago.
As I’ve said for the past couple years in these equity forecasts, I remain bullish. But like I also said coming into this year, this is an environment that’s ripe for a pullback and that could be the trader’s best friend when working with such trends. That pullback arrived forcefully in early-Q2 trade and ultimately, that proved to be one of the most opportune long setups for stocks in decades. The oversold RSI reading on the weekly chart was only the second such observation in the past ten years, with the Covid pandemic as the other. In both cases, stocks showed a massive reversal thereafter and now we’re dealing with the hangover effect of that second instance.
At this point there remains little reason to expect the normally bullish backdrop of the past 16 years to change. The Fed remains dovish, even with inflation 50% above their target, and the executive branch has certainly taken interest in talking stock prices higher. So, any pullback that does show will likely be met with supportive commentary either from the fiscal or monetary side of the coin and perhaps even both.
The risks to this forecast are surprise moves with inflation and given the Fed’s most recent forecast for Core PCE to finish the year at 3.1%, that would seem to be the line in the sand that could start to question the dovish expectation around the FOMC. But that might be more of a Q1, 2026 theme than something of note for next quarter. It was the flare in inflation earlier in the year that caused the Fed to take a step back from rate cuts earlier in the year, and equity prices suffered as the prospect of tariffs came into the equation, as well.
For targets, the 161.8% extension of the 2025 pullback plots at 6958, which is confluent with the 7k psychological level. That’s just about 4.7% away from current price and that seems a reasonable estimate for where prices may move as we push into the end of the year. That would be roughly a 17% gain for SPX in 2025, which doesn’t seem outlandish given the backdrop of a softening Fed and 30-year bonds trading below 5%.
For support – the 6500 level is notable, as this is confluent with the 127.2% extension of that same major move. That price had provided resistance for the rally on the way up, and this becomes the area of the chart that bulls need to defend in the event of pullback scenarios. If we do get a larger sell-off, the price that sticks out as important is the same that caught the high in February at 6148, which is the 161.8% extension of the 2022 pullback. Notably, that level hasn’t yet been tested for support since the breakout so in an adverse scenario, with a deeper pullback whether that’s driven by inflation data or just a top heavy trade pulling back, that becomes the next significant line in the sand below 6500.
SPX Weekly Chart
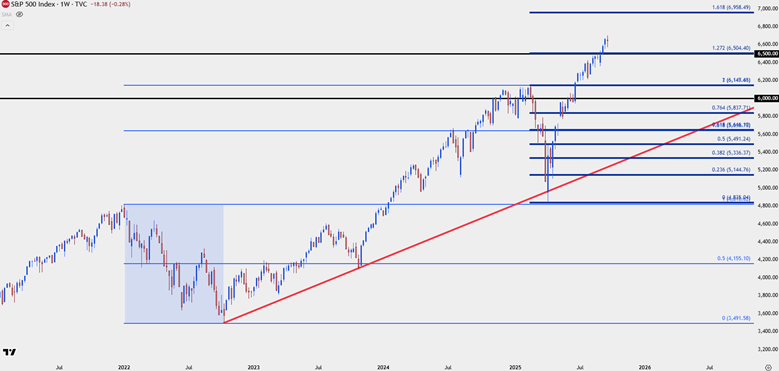
Chart prepared by James Stanley; data derived from Tradingview
Nasdaq
Tech remains the more worrisome part of the US equity backdrop at the moment, largely just because of how aggressively it’s run and there’s questions remaining around the revenue potential of the AI trade, which has absolutely taken over. And like I had looked at coming into this year, that does bear resemblance to the dot com trade that drove so aggressively in 1999 as the unbridled hope for follow-through growth on the back of this ‘new’ medium created lofty valuations that would be difficult to justify even in a best case scenario.
But valuation alone is not a bearish thesis, and as example, we can go back Alan Greenspan’s warning of outlandish valuations in tech stocks as an example. In December of 1996, Greenspan had the famous remark about ‘irrational exuberance.’ This is often quoted by the media as testament to ‘the maestro’ being able to see that a reversion was on the horizon.
But in December of 1996 the Nasdaq 100 was trading at around 800. The index then went on to grow more than five times that amount over the next three years, and when it did finally fall – it was that same 800 level that came in as support in 2003. The index never fell below the level that it was at when Alan Greenspan made that comment.
Nasdaq 100 1993-2007
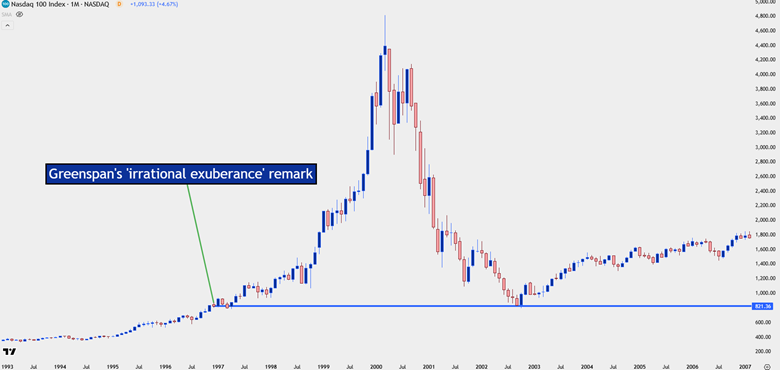
Chart prepared by James Stanley; data derived from Tradingview
NDX in Q4
For the Nasdaq, I’m going to employ a similar method for targets by using a 161.8% extension of the 2025 pullback move, which again, lines up to just around 5% from current market price. That seems a reasonable estimate for topside targets into the final quarter of the year, and if that is attained, it would amount to an approximate 21.5% move for 2025, which also seems reasonable.
For support, the 127.2% extension aligns with an area of prior resistance, around 23768 and this would be the ‘s1’ level for the index as we move into Q4. For the ‘s2’ zone, I’m tracking that a little deeper at some unfilled gap in NDX from 22763-22973, and for the ‘s3’ zone, it’s the same area as the February high of 22222 spanned down to a prior resistance level of 21856.
If bears are able to elicit a break below that ‘s3’ zone, my assumption is that something in the backdrop would have changed and that’s impossible to predict from where we’re at right now; but bigger picture, the next major test below that would be the support zone around the 20k handle which has a wide range of unfilled gap following the breakout in May.
A test there would be a legitimate ‘moment of truth’ for bulls.
Nasdaq 100 Weekly Price Chart
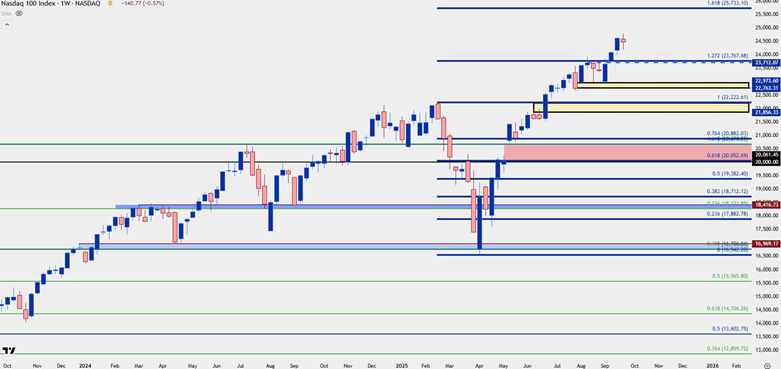
Chart prepared by James Stanley; data derived from Tradingview
--- written by James Stanley, Senior Strategist
This material should be construed as market commentary and represents the opinions and viewpoints of the author, and does not reflect tailored advice associated with any specific account.
The views are current only through the date stated and are subject to change at any time based upon market or other conditions, and StoneX Group Inc. (“SGI”) disclaims any responsibility to update such views. Actual results, performance, or achievements may differ materially from those expressed or implied. Information is based on data gathered from what we believe are reliable sources. Past performance does not guarantee future results.
The StoneX Group Inc. group of companies provides financial services worldwide through its subsidiaries, including physical commodities, securities, exchange-traded and over-the-counter derivatives, risk management, global payments and foreign exchange products in accordance with applicable law in the jurisdictions where services are provided.
References to certain OTC products or swaps are made on behalf of StoneX Markets, LLC (SXM), a member of the National Futures Association (NFA) and provisionally registered with the U.S. Commodity Futures Trading Commission (CFTC) as a swap dealer. SXM’s products are designed only for individuals or firms who qualify under CFTC rules as an ‘Eligible Contract Participant’ and who have been accepted as customers of SXM.
StoneX Financial Inc. (SFI) is a member of FINRA/NFA/SIPC and registered with the MSRB. SFI is registered with the U.S. Securities and Exchange Commission (SEC) as a Broker-Dealer and with the CFTC as a Futures Commission Merchant and Commodity Trading Advisor. StoneX Financial (Canada) Inc. (SFCI) is registered in Canada and is a member of CIRO and CIPF. References to certain securities trading are made on behalf of the BD Division of SFI and are intended only for an audience of institutional clients as defined by FINRA Rule 4512(c). References to certain exchange-traded futures and options are made on behalf of the FCM Division of SFI. Wealth Management is offered through SA Stone Wealth Management Inc., member FINRA/SIPC, and SA Stone Investment Advisors Inc., an SEC-registered investment advisor, both wholly owned subsidiaries of SGI.
R.J. O’Brien & Associates, LLC (RJO) is registered with the CFTC as a Futures Commission Merchant and is a member of NFA.
StoneX Financial Ltd (SFL) is registered in England and Wales, company no. 5616586. SFL is authorized and regulated by the Financial Conduct Authority (FCA) (registration number FRN:446717) to provide services to professional and eligible customers including: arrangement, execution and, where required, clearing derivative transactions in exchange traded futures and options. SFL is also authorized to engage in the arrangement and execution of transactions in certain OTC products, certain securities trading, precious metals trading and payment services to eligible customers. SFL is authorized and regulated by the FCA under the Payment Services Regulations 2017 for the provision of payment services. SFL is a category 1 ring-dealing member of the London Metal Exchange. In addition SFL also engages in other physically delivered commodities business and other general business activities which are unregulated and not required to be authorized by the FCA.
This communication is issued in the European Economic Area by StoneX Financial Europe GmbH (SFEG). StoneX is the trade name used by STONEX GROUP INC. and all its associated entities and subsidiaries. StoneX Financial Europe GmbH (“SFEG”) is a securities trading firm registered in Germany under Company No. HRB 80844.
StoneX APAC Pte. Ltd. (“SAP”) (Co. Reg. No 200616676W) is regulated as a Dealer (PS20190001002) under the Precious Stones and Precious Metals (Prevention of Money Laundering and Terrorism Financing) Act 2019 for purposes of anti-money laundering and countering the financing of terrorism. SAP is an “Approved International Trading Company” authorized to act as a “Spot Commodity Broker” under the Commodity Trading Act.
StoneX Financial Pte Ltd (Co. Reg. No 201130598R) (“SFP”) is regulated by the Monetary Authority of Singapore and is a Capital Markets Service Licence holder (for dealing in capital market products), an Exempt Financial Adviser (for advising on investment products and issuing or promulgating analyses/ reports on investment products) and a Major Payment Institution (for domestic and cross-border money transfer services).
SFP may distribute analysis/report produced by its respective foreign affiliates within the StoneX Group of companies pursuant to an arrangement under Regulation 32C of the Financial Advisers Regulations Recipients should contact SFP at (65) 6309 1000 for any matters arising from, or in connection with, this webinar.
StoneX APAC Pte. Ltd. (“SAP”) (Co. Reg. No 200616676W) is regulated as a Dealer (PS20190001002) under the Precious Stones and Precious Metals (Prevention of Money Laundering and Terrorism Financing) Act 2019 for purposes of anti-money laundering and countering the financing of terrorism.
StoneX Financial (HK) Limited (CE No.: BCQ152) (“SHK”) is regulated by the Hong Kong Securities and Futures Commission for Dealing in Securities and Dealing in Futures Contracts.
StoneX Financial Pty Ltd (ACN 141 774 727) holds an Australian Financial Service License (AFSL: 345646) for Dealing in Securities, Exchange-Traded Derivatives Contracts, OTC Derivatives Contracts and Foreign Exchange Contracts, and is regulated by the Australian Securities and Investments Commission.
StoneX Securities Co., Ltd. (“SSJ”) (Co. Reg. No 010401047199) is regulated by the Japanese Financial Services Agency as a Type-I Financial Instruments Business Operator (Kanto Local Finance Bureau (FIBO)No.291’), is a member of the Financial Futures Association of Japan for dealing and broking FX and FX Option transactions, and is a member of the Japan Securities Dealers Association for dealing and broking stock indices and option transactions.
Trading swaps and over-the-counter derivatives, exchange-traded derivatives and options and securities involves substantial risk and is not suitable for all investors. Past performance of any futures or option is not indicative of future success. Indicators are not a trading system and are not published as a specific trade recommendation. The information herein is not a recommendation to trade nor investment research or an offer to buy or sell any derivative or security. It does not take into account your particular investment objectives, financial situation or needs and does not create a binding obligation on any of the StoneX group of companies to enter into any transaction with you. You are advised to perform an independent investigation of any transaction to determine whether any transaction is suitable for you. No part of this material may be copied, photocopied or duplicated in any form by any means or redistributed without the prior written consent of StoneX Group Inc.
The report/analysis herein is not directed to, or intended for distribution to or use by, any person or entity who is a citizen or resident of or located in any locality, state, country or other jurisdiction where such distribution, publication, availability or use would be contrary to law or regulation.
© 2026 StoneX Group Inc. All Rights Reserved.
Our subscribers have access to comprehensive market analysis from StoneX spanning commodities, equities, currencies and more.
Gold has been on a rollercoaster ride in recent quarters - how will the precious metal fare in Q2? Read our full outlook!

How will major US indices fare in Q2 after the big swoon in March? Read our full outlook!


EUR/USD slides toward a make-or-break level as Fed bets shift. Can support hold or is a larger breakdown underway?

Our market expertise, advanced platforms, global reach, culture of full transparency and commitment to our clients’ success all set us apart in the financial marketplace.
Reach
With access to 40+ derivatives exchanges, 180+ foreign exchange markets, nearly every global securities marketplace and numerous bi-lateral liquidity venues, StoneX’s digital network and deep relationships can take clients anywhere they want to go.
Transparency
As a publicly traded company meeting the highest standards of regulatory compliance in the markets we serve; our financials and record of accomplishment are matters of public record. StoneX’s commitment to “doing the right thing over the easy thing” sets us apart in the industry and helps us build respect, client trust and new partnerships.
Expertise
From our proprietary Market Intelligence platform, to “boots on the ground” expertise from award-winning traders and professionals, we connect our clients directly to actionable insights they can use to make more informed decisions and achieve their goals in the global markets.