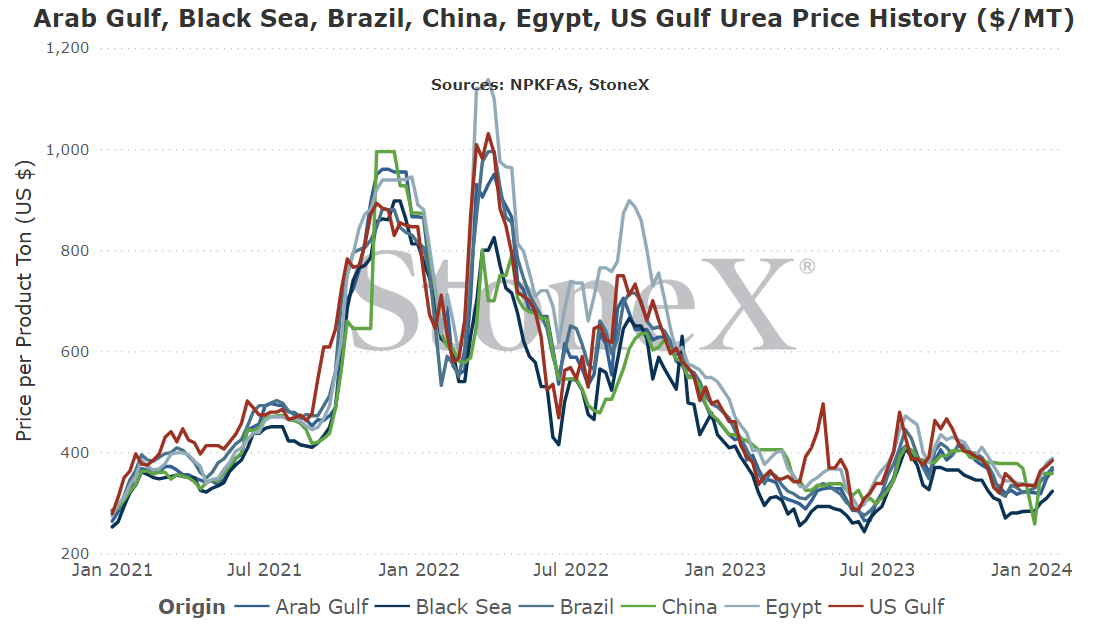
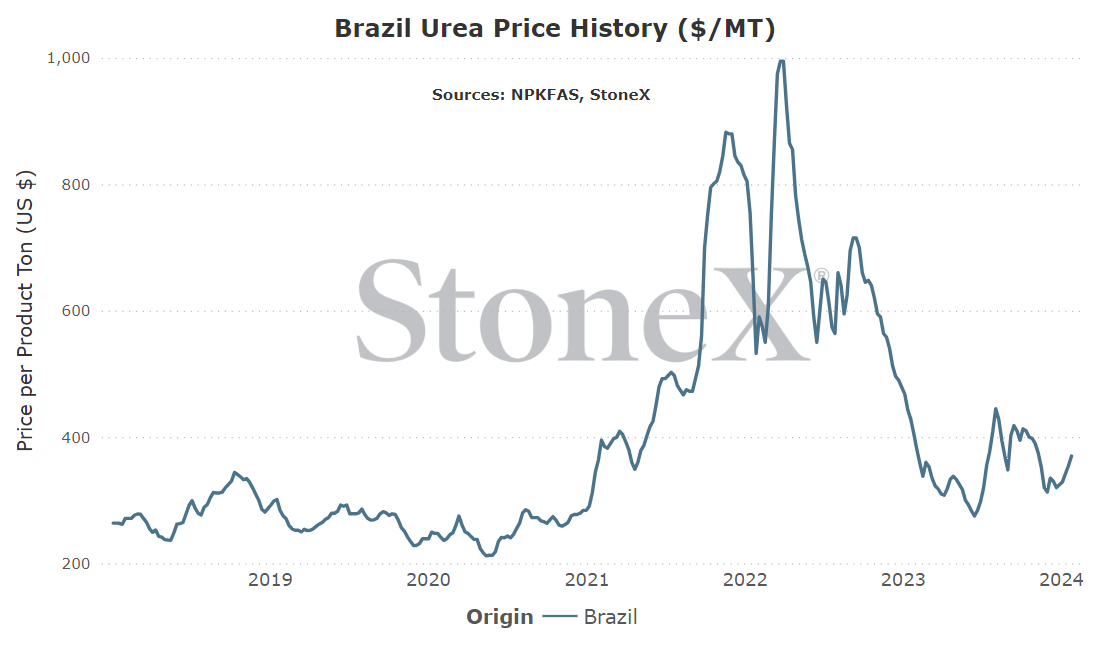
The intention of the below graphs are not to use to say "my price should be X based on this graph". These prices are derived from an FOB price point average. The intent is to show major global price movement trends. Your values will likely have significant basis difference (similar to your local grain price being different than the traded market price).
This graph is labeled as MT in USD currency.
While the fertilizer futures market is far from as liquid as its grain counterparts, it is still active and gives us an insight into what the market is thinking.
Please note that the values below can and will change daily. This is merely a look at where they are as of writing:
|
- The U.S. takes further action against Houthi rebels only - in this scenario, we will see some nations protest the attacks and blame the U.S. as they do but ultimately, the attacks will come and go and everyone will move on. Decent chance of occuring, low impact to urea.
- The U.S. attacks Houthi rebels and implements sanctions against Iran - in this scenario, tensions will be elevated and the push back from some nations likely larger and louder. For urea, we need to be cognizant of the chance that urea exports would be included in those sanctions. If they are, we could see a lot of their urea removed from the world market which would benefit market bulls. As they did before, they would likely find "work arounds", flowing their product to a nearby nation and then sailing on under that new nationality flag to skirt sanctions. Still, there would be an impact. Decent chance of occuring, medium impact to urea.
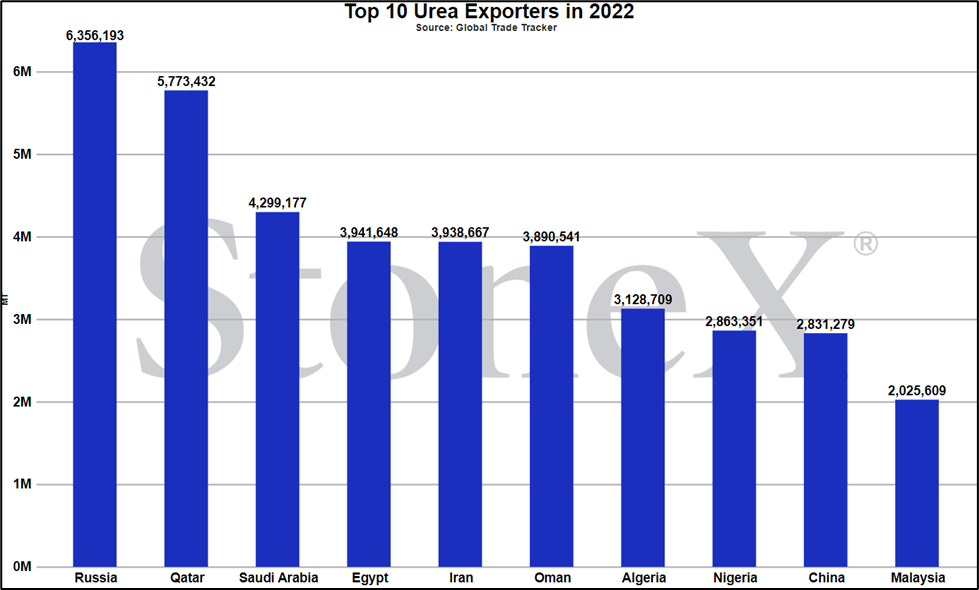
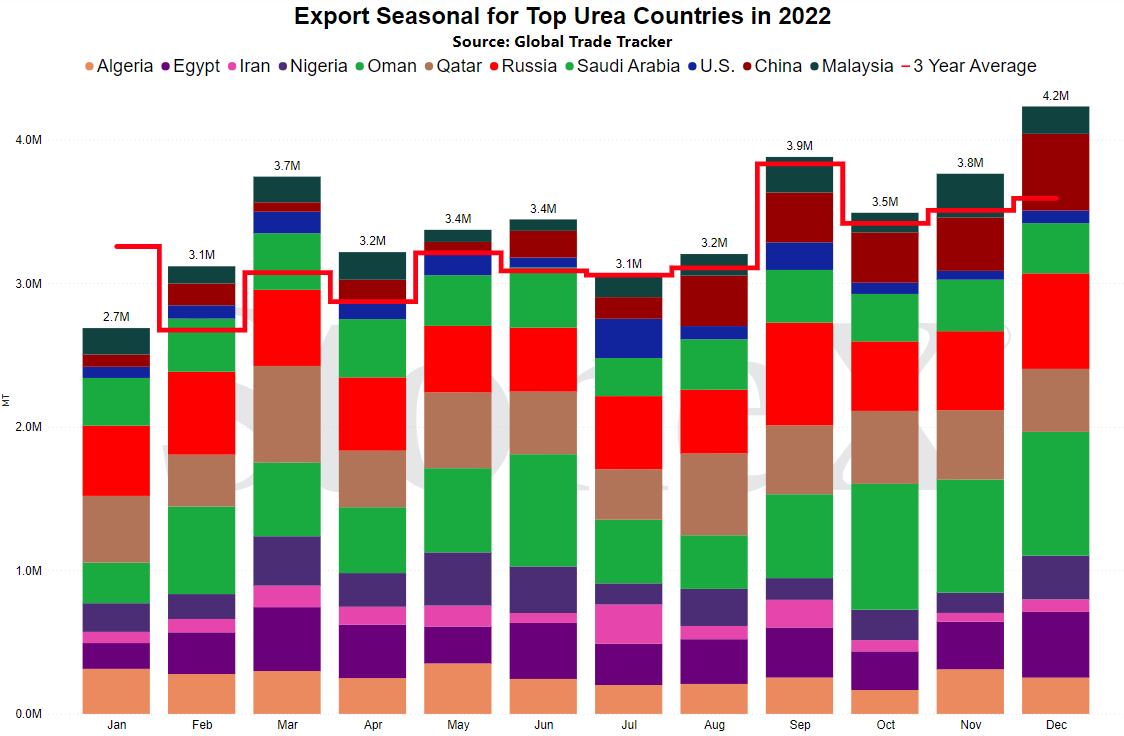
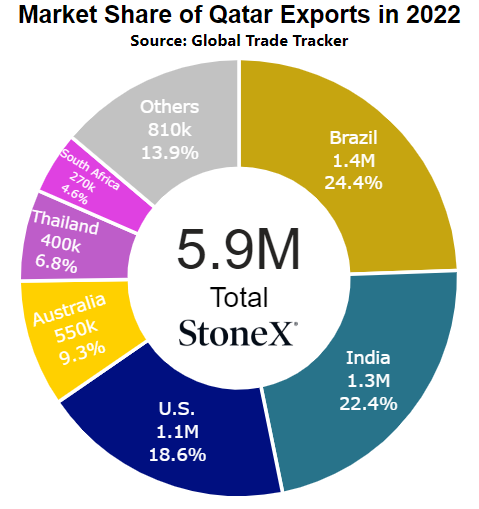
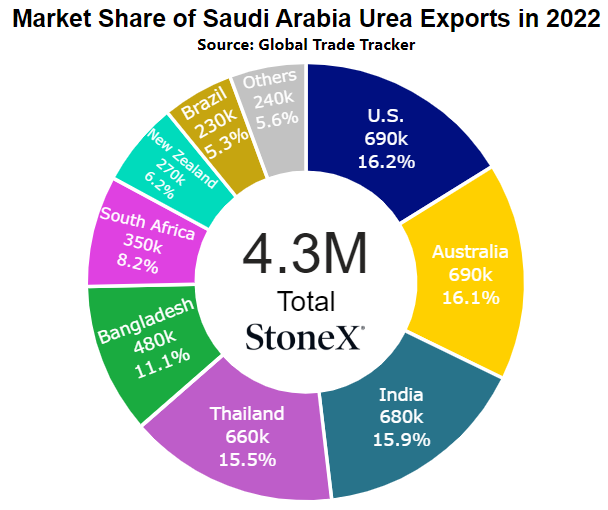
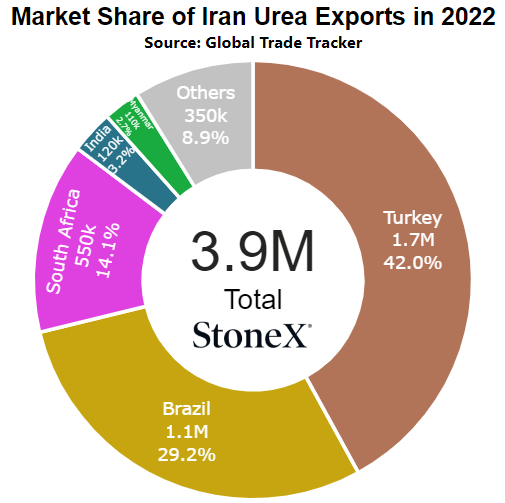
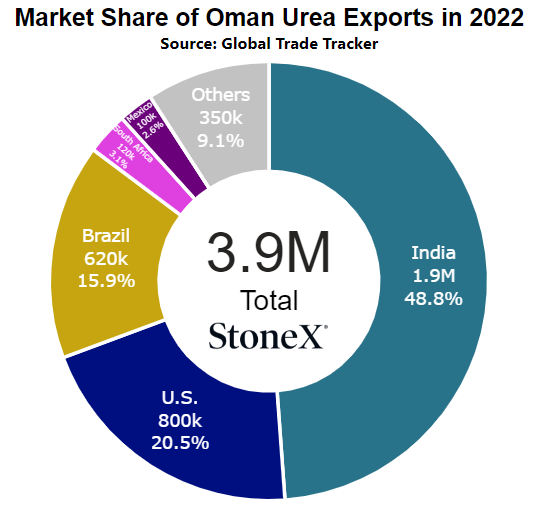
- The U.S. retaliates against both Houthi rebels and Iran, seeing both as one in the same. I put this as an extremely low likelihood due to the chance of creating a regional war in the Middle East. We know the region is already on edge today and it wouldn't take much to push it over the cliff. There is already conflicts between Israel/Hamas and Russia/Ukraine. Would the U.S. really want to chance a 3rd major conflict at the same time? Still, in the very low chance of it happening, Iran probably isn't going to sit back and take it. In my mind, if they are smart, they will not look for a direct conflict with the U.S. Rather, they could use their proximity in the Persian Gulf/Straight of Hormuz to attack vessels. As proven in the Red Sea, it does not take many attacks to discourage vessels from sailing thru. If this happens, the world news will be focused on the oil markets and inability to move product. However, it is massive for urea. Look at the map below. There are literally millions of tons that originate around and thru the Persian Gulf to the rest of the world. The global urea market lost its mind when we thought Russian exports were going to be lost. Russia is one of the top 10 exporting countries. There are several around the Persian Gulf. I really hope this does not become reality... Incredibly low chance of occuring, huge impact to urea.
Today, the market seems comfortable to shove the possibility to the side and does not seem to be factoring it into values. That said, if you wake up one morning to the news of fighting expanding, be on your toes.
This is a storyline that quickly captured the attention of the North American nitrogen market.
There had been rumors swirling that OCI was open to the sale of their Weaver, IA nitrogen plant. Weaver was, based on my memory, the last new nitrogen production facility to have come online in the U.S. The plant was seen as a welcome change as it helped add new competition and additional tonnage in a demand rich territory. This plant was courted by several states in the Midwest but eventually, packages offered by the state of Iowa won out.
Now, with it being confirmed that Koch will spend $3.6 billion to purchase the facility and many organizations are not pleased.
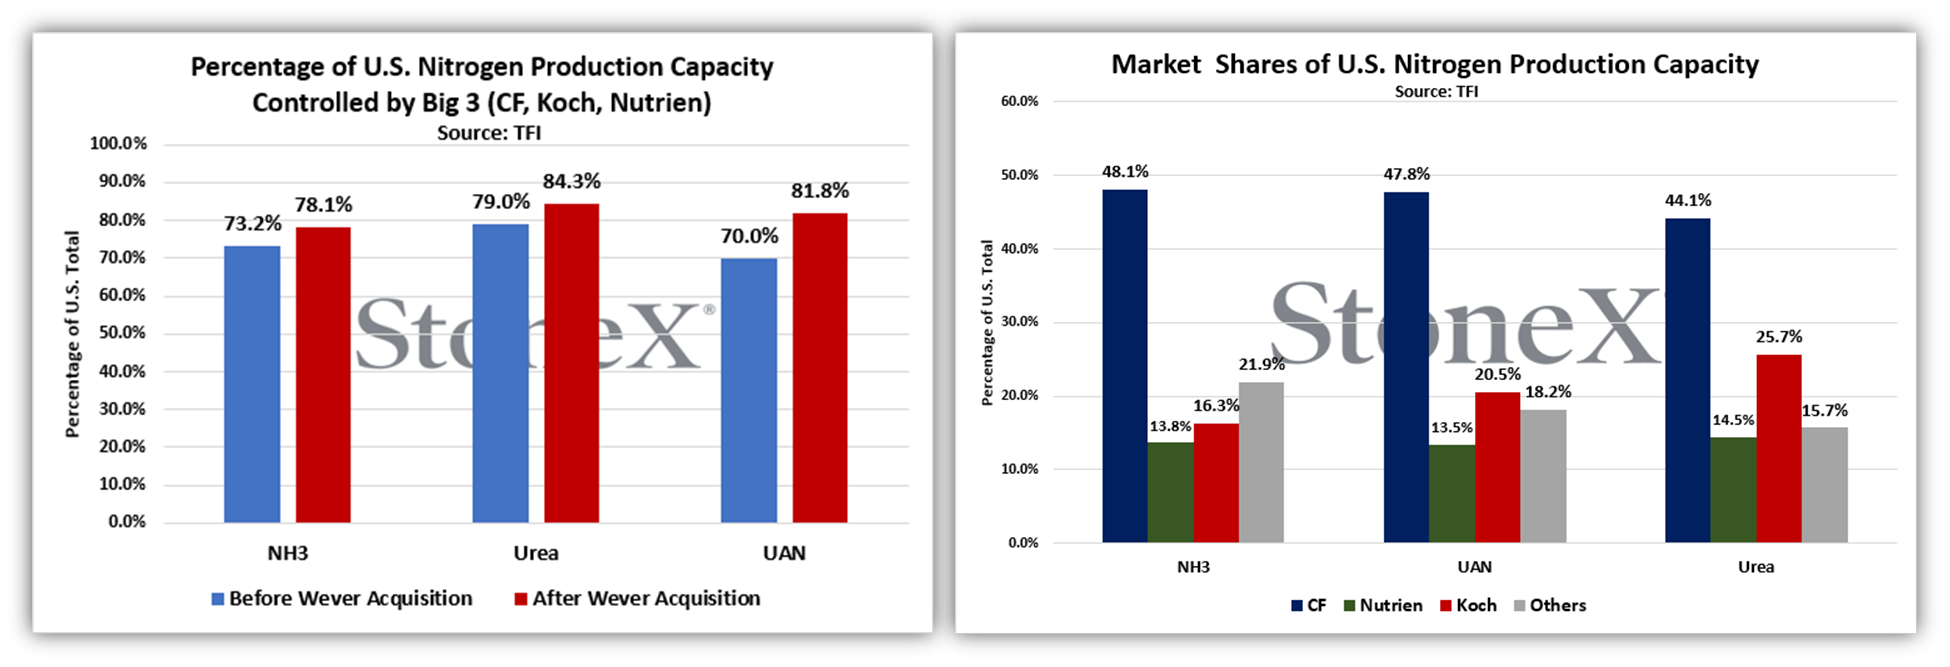
Several groups have come forward in opposition to the sale. While several arguments are being thrown to the industry, it ultimately comes down to further consolidation. If this sale proceeds, U.S. urea production by the big 3 (CF, Koch, Nutrien) will rise from an approximate 79% to just over 84% control. This is another step toward a UAN/nitrogen oligopoly and the market is making it known.
Not that my opinion matters but I continue to believe that the sale will proceed with few issues...but the chance of it being struck down are higher. The market is pushing. D.C. has started to shine a light on the fertilizer market. If I had to put odds on it, I would say 75% approval/25% disapproval odds. Those are not great for those wanting the sale to be stopped but we have seen less likely things happen in recent years.
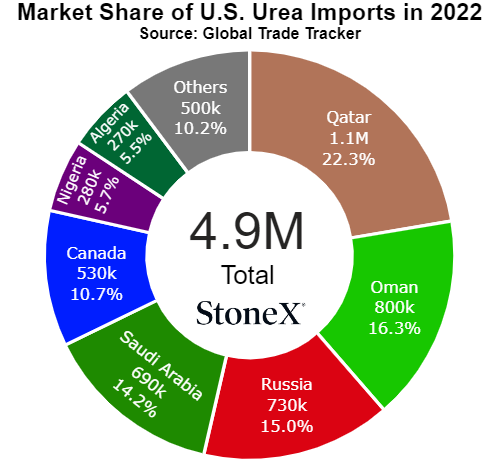
NOLA/New Orleans, Louisiana
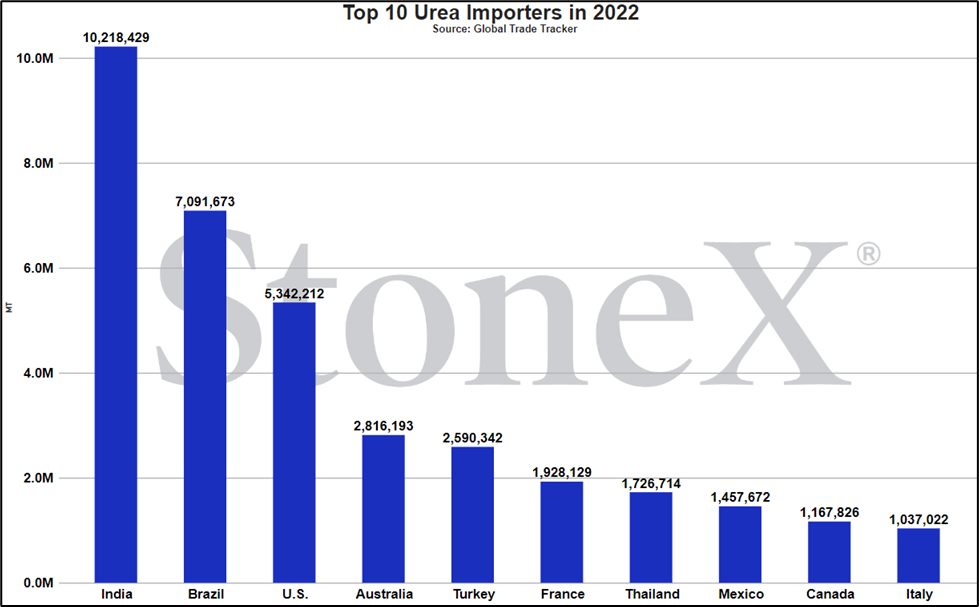
Number 3 global importer in 2022
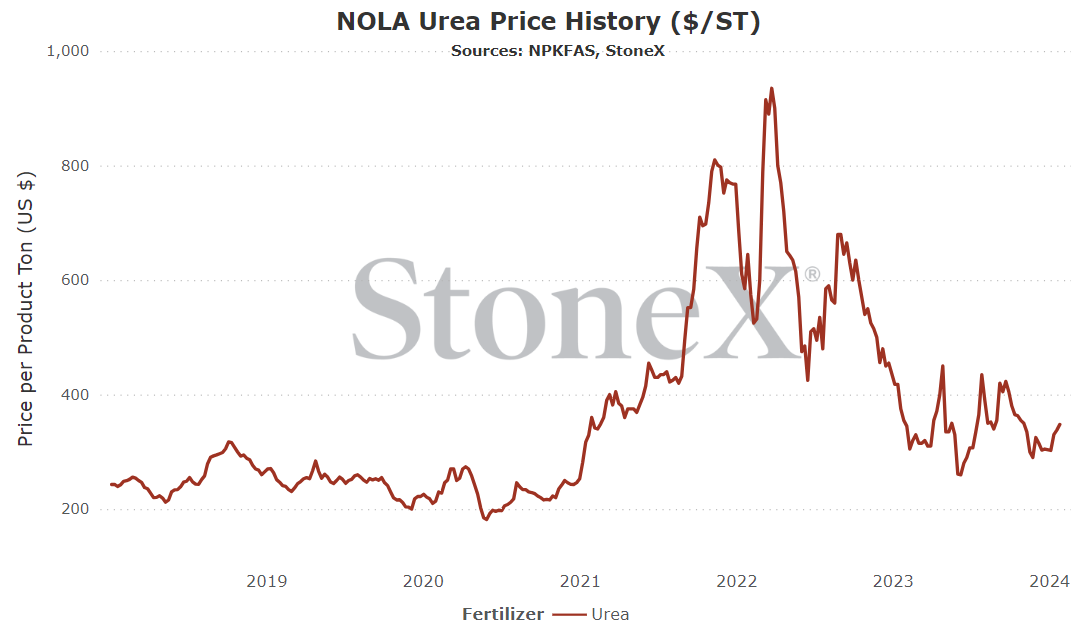
Price comparisons
Vs 30 days ago - +14% or approximately $43 higher
Vs 90 days ago - -4% or approximately $15 lower
Vs 6 months ago - -5% or approximately $17 lower
Vs 1 year ago - -2% or approximately $7 lower
U.S. Midwest Average
Vs 30 days ago - +6% or approximately $21 higher
Vs 90 days ago - -18% or approximately $82 lower
Vs 6 months ago - -12% or approximately $51 lower
Vs 1 year ago - -14% or approximately $61 lower
U.S. Southern Plains Average
Vs 30 days ago - +12% or approximately $43 higher
Vs 90 days ago - -11% or approximately $50 lower
Vs 6 months ago - +6% or approximately $23 higher
Vs 1 year ago - -9% or approximately $40 lower
U.S. Northern Plains Average
Vs 30 days ago - +2% or approximately $6 higher
Vs 90 days ago - -14% or approximately $63 lower
Vs 6 months ago - -2% or approximately $9 lower
Vs 1 year ago - -12% or approximately $55 lower
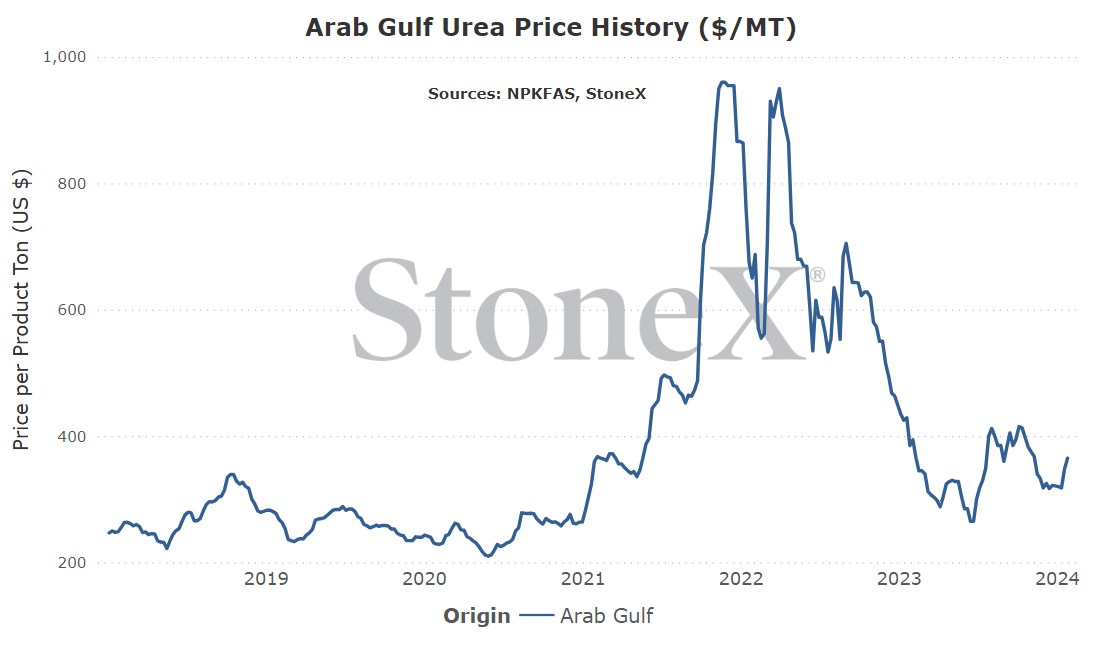
Middle East
Number 1 exporter (as a region, not as individual nations)
Vs 30 days ago - +13% or approximately $43 higher
Vs 90 days ago - -8% or approximately $33 lower
Vs 6 months ago - +5% or approximately $17 higher
Vs 1 year ago - -5% or approximately $20 lower
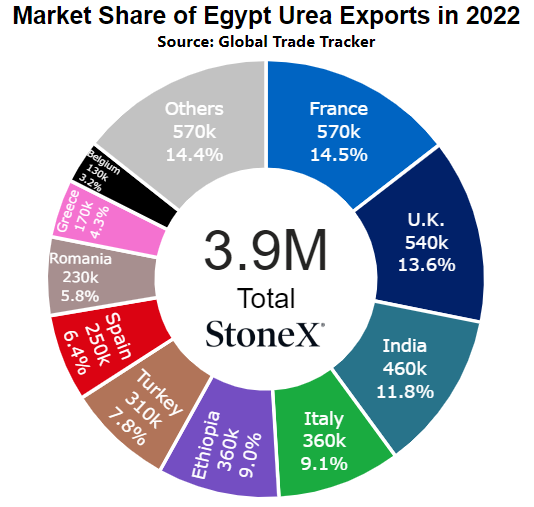
Egypt
Number 4 global exporter in 2022
Price comparisons
Vs 30 days ago - +15% or approximately $50 higher
Vs 90 days ago - -3% or approximately $14 lower
Vs 6 months ago - -3% or approximately $13 lower
Vs 1 year ago - -11% or approximately $50 lower
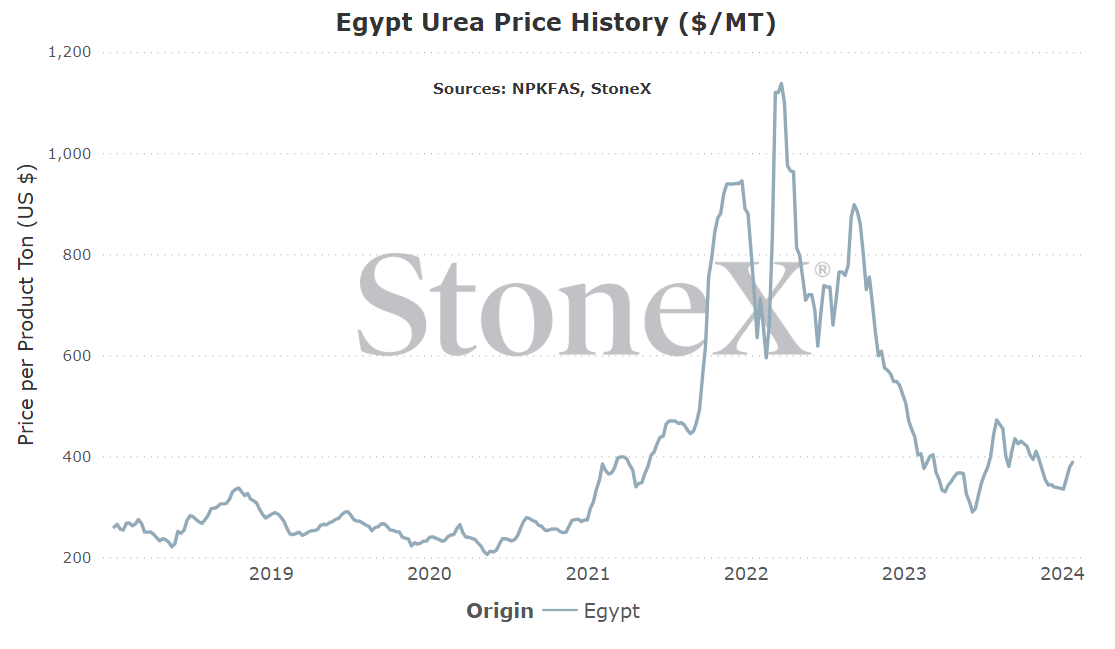
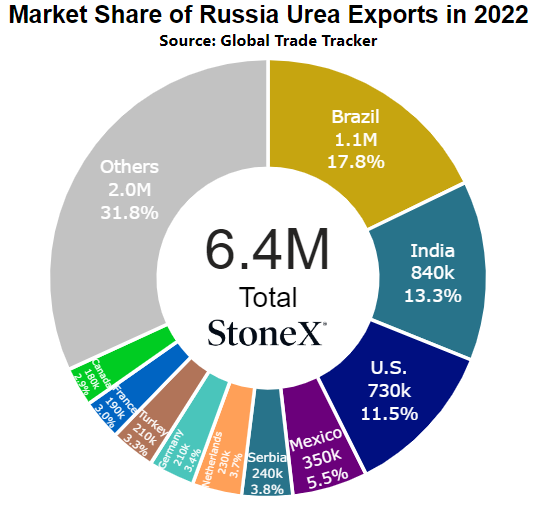
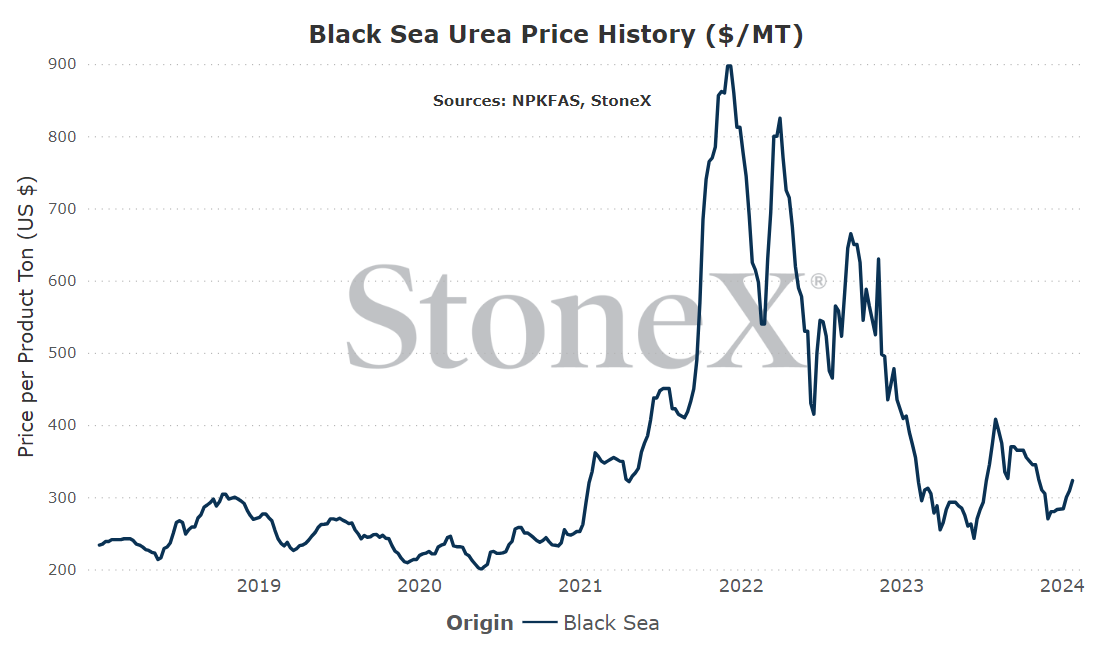
Black Sea
Number 1 global exporter in 2022
Price comparisons
Vs 30 days ago - +14% or approximately $40 higher
Vs 90 days ago - -8% or approximately $28 lower
Vs 6 months ago - -7% or approximately $23 lower
Vs 1 year ago - -13% or approximately $50 lower
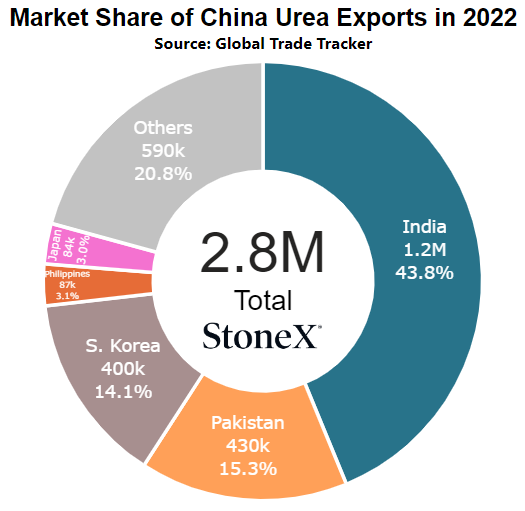
China
Number 9 global exporter in 2022
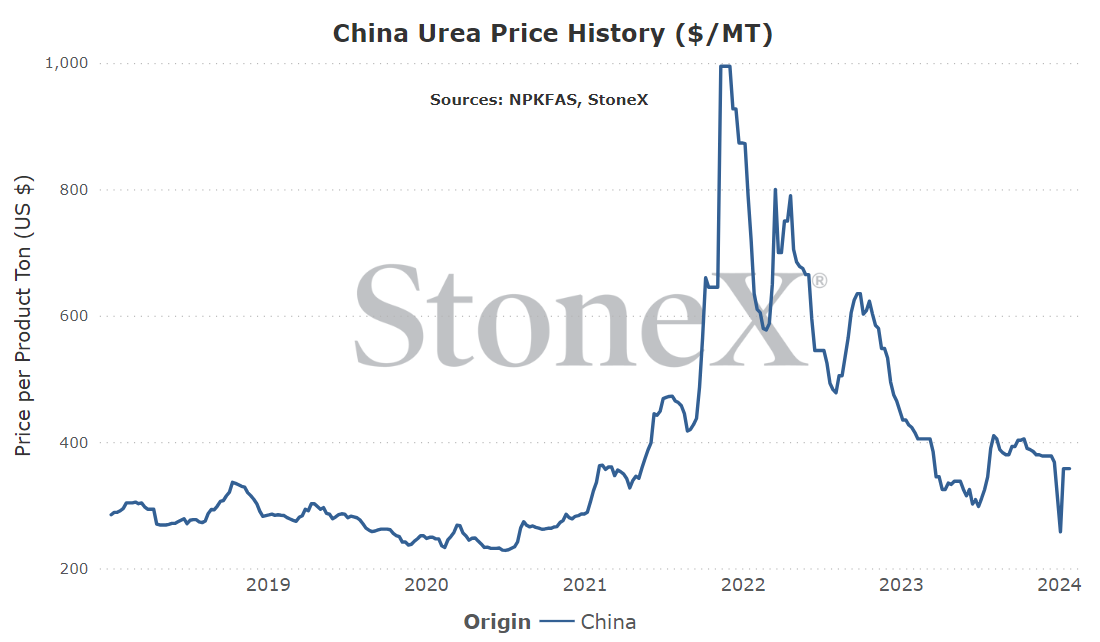
Price comparisons
Vs 30 days ago - -3% or approximately $10 lower
Vs 90 days ago - -8% or approximately $33 lower
Vs 6 months ago - +4% or approximately $13 higher
Vs 1 year ago - -15% or approximately $65 lower
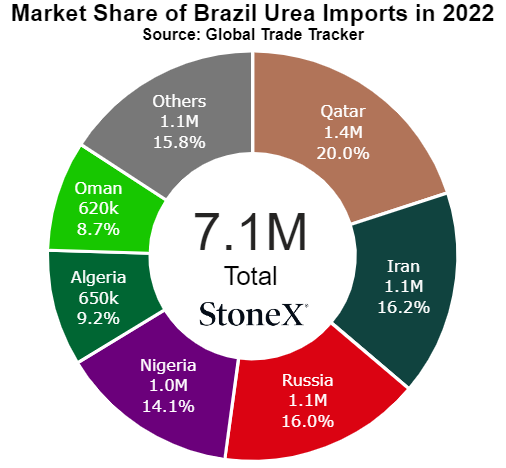
Brazil
Number 2 global importer in 2022
Price comparisons
Vs 30 days ago - +16% or approximately $50 higher
Vs 90 days ago - -7% or approximately $30 lower
Vs 6 months ago - -2% or approximately $7 lower
Vs 1 year ago - -9% or approximately $35 lower
- The Middle East ignites on recent attacks - unfortunately, it appears we are inching closer to war in the region following attacks on a U.S. base in Jordan which resulted in the death of 3 service members and dozens of other injuries. The world is waiting with baited breath for the response. If this turns into a regional conflict, Persian Gulf shipments could easily be slowed/stopped and there are literally millions of tons of urea exports that transit that stretch annually.
- Red Sea attacks continue to hamper vessel transit - this is still more of a nuisance situation than a complete blockade as vessels are able to sail around the danger area. However, this means higher freight rates and longer sail times which eventually flows down to the end user to bear the cost...
- World demand remains front, center, and constant - a big reason for recent price gains is the near constant push to purchase product by certain areas. Manufacturers are able to sell small blocks of tons, push the price up to test conviction of buyers, eventually sell that higher price and then rinse/repeat. As long as buyers are willing to keep the torrid buying pace they have had, values should see support.
- Buying could dry up quickly - we have seen this before. Buyers continue to step forward daily...until they do not. If/when the buying dries up and markets go quiet, fertilizer prices struggle to hold. This seems less likely right now given how close we are to spring for the Northern Hemisphere as well as manufacturers appearing well sold, but it is still possible.
- Fears of carrying product into summer could cause sellers to panic sell - at some point, position holders will want/need to make the decision to offload inventories as summer nears. Light summer demand as well as price reset fears truly drive this. If this emotion gets triggered, it becomes easier to lower a price idea to make a sale. Get a few doing this, and you have a bearish marketplace.
- European nitrogen plant restarts could add supply/reduce demand - hard to believe how improved the European picture has become. Dutch TTF values have fallen firmly into single digits while global nitrogen/urea values are bullish. If we see the remaining offline European plants restart (likely quietly), it would likely mean they have less need for imports. That means more supply for the world.
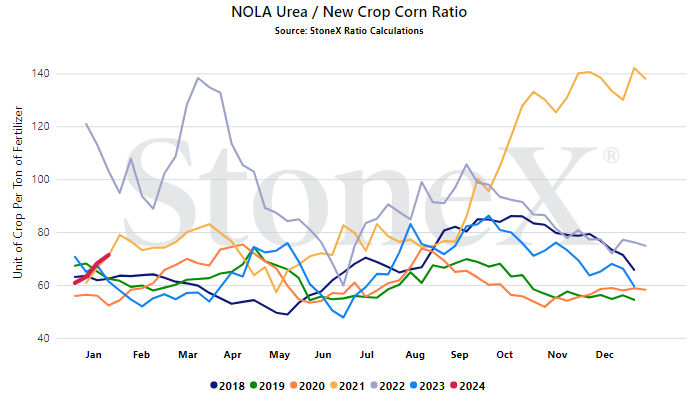
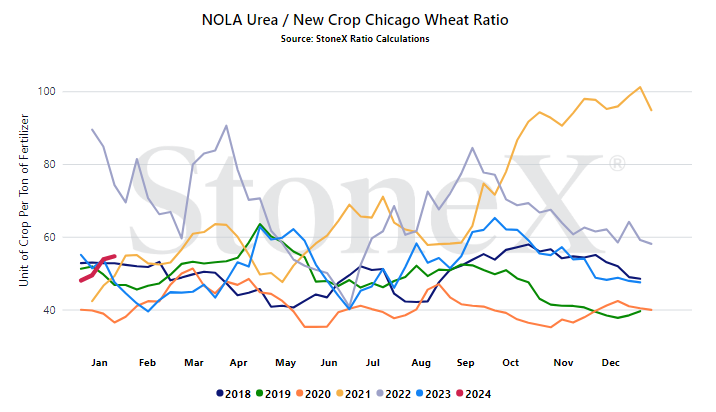
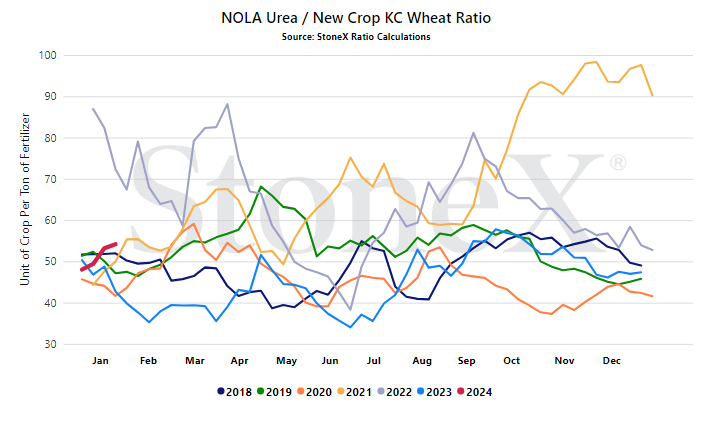
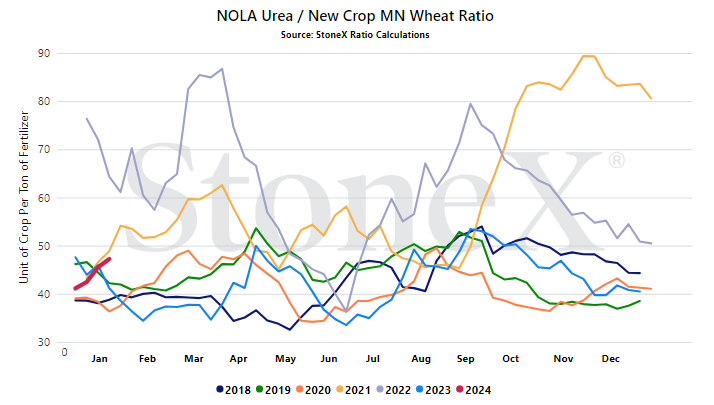
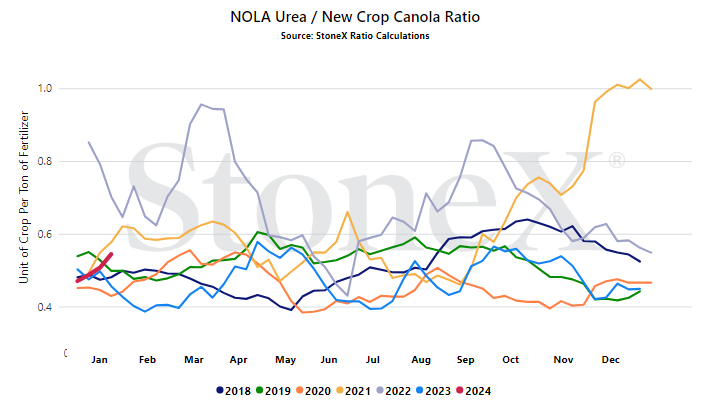
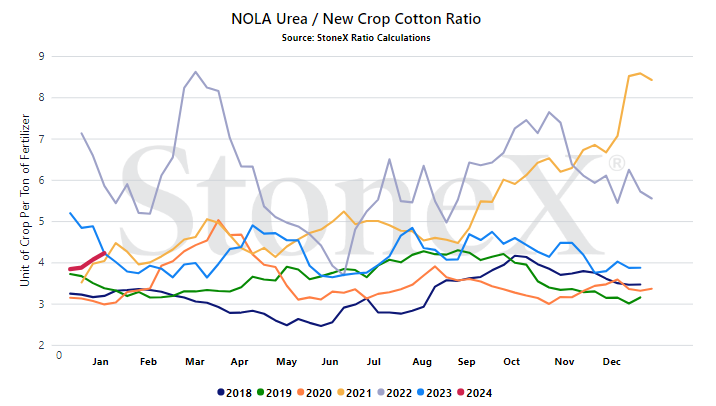
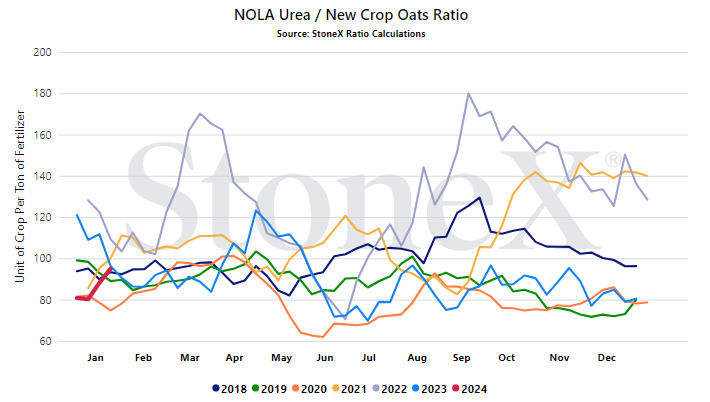
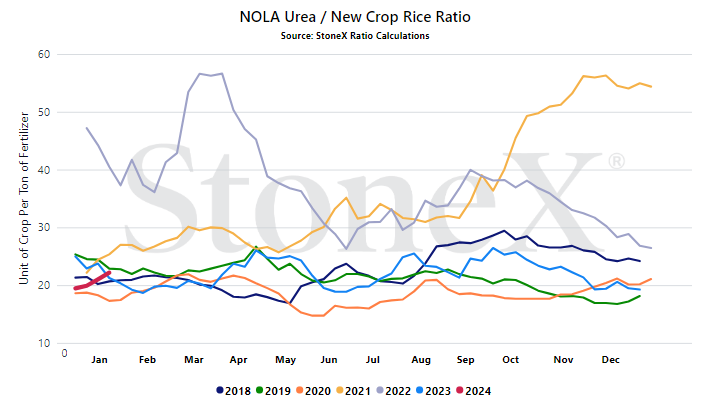
We believe that only looking at the flat price of either grains or fertilizer can be misleading:
- Only selling grain can hurt you if fertilizer prices rise substantially
- Only buying fertilizer can hurt you if grain prices fall
We look at the ratio "value" to get a better indication of where we are or how many bushels of X does it take to pay for 1 ton of fertilizer.
Would you rather:
- Spend 135 bushels to pay for 1 ton of urea
- Spend 55 bushels to pay for 1 ton of urea
When we compare the current ratio value against recent years, we start to see if we are high or low.
YOUR VALUES MAY LOOK DIFFERENT
This graph looks at the NOLA urea price vs the flat grain price. There are no logistics on either product. Your location will look different due to fertilizer logistical costs, grain basis, etc.
- Middle East - rather than list out all the different hot spots, I'm just saying the Middle East in general. This is especially true because as I am writing this, we are waiting to see what the U.S. response will be to the recent death of military members in Jordan. This has the potential to spiral out of control. The difficulties following Red Sea attacks have been hard enough. If we start having Iran play a direct role and we start talking about the Persian Gulf shipping capacity...urea will be a completely new marketplace.
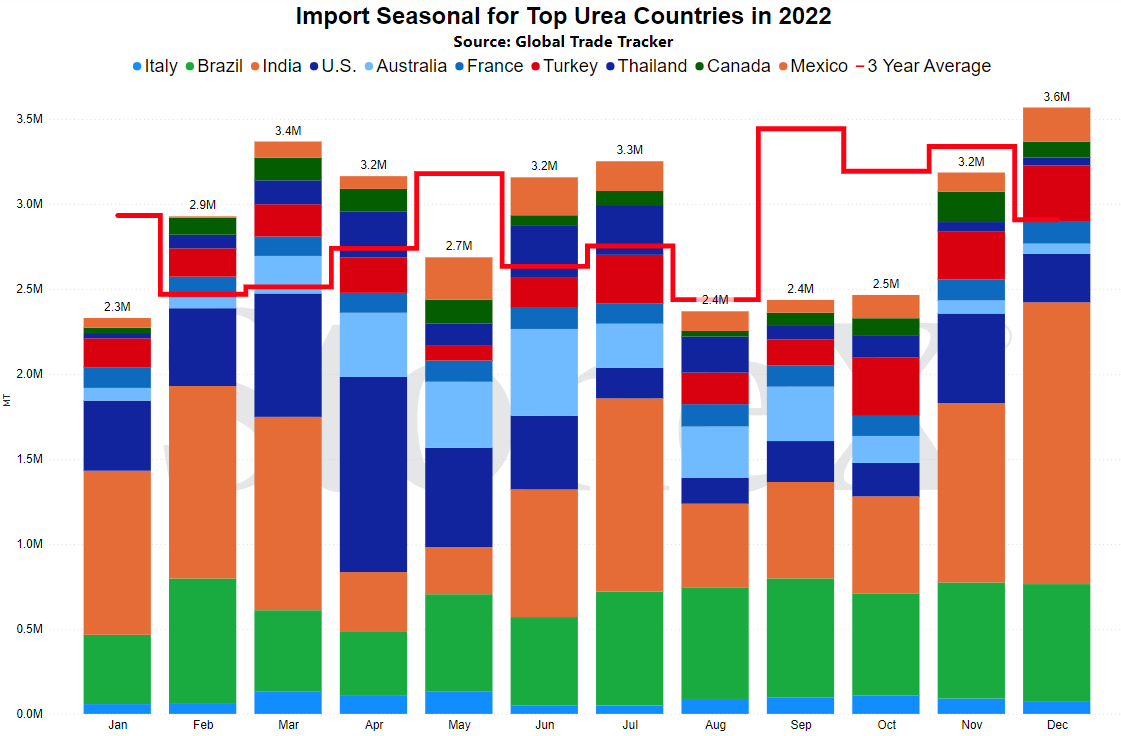
- N.A. imports before start of spring - July thru November, the U.S./N.A. has had a really solid start to urea imports. There is still a ways to go but a good start. However, we need December/January imports to be solid to help offset the shipping issues in the Red Sea and possibly in the Persian Gulf.
StoneX Ratio Calculation
The ratio calculation is derived from Bloomberg historical grains values as well as fertilizer values from StoneX, NPKFAS, and Argus.
The calculation is simply dividing the fertilizer price by each grain price.
All data was sourced from StoneX unless otherwise noted.
This material should be construed as the solicitation of an account, order, and/or services provided by the FCM Division of StoneX Financial Inc. (“SFI”) (NFA ID: 0476094) or StoneX Markets LLC (“SXM”) (NFA ID: 0449652) and represents the opinions and viewpoints of the author. It does not constitute an individualized recommendation or take into account the particular trading objectives, financial situations, or needs of individual customers. Additionally, this material should not be construed as research material. The trading of derivatives such as futures, options, and over-the-counter (OTC) products or “swaps” may not be suitable for all investors. Derivatives trading involves substantial risk of loss, and you should fully understand the risks prior to trading. Past results are not necessarily indicative of future results.
All references to and discussion of OTC products or swaps are made solely on behalf of SXM. All references to futures and options on futures trading are made solely on behalf of SFI. SXM products are intended to be traded only by individuals or firms who qualify under CFTC rules as an ‘Eligible Contract Participant’ (“ECP”) and who have been accepted as customers of SXM.
SFI and SXM are not responsible for any redistribution of this material by third parties, or any trading decisions taken by persons not intended to view this material. Information contained herein was obtained from sources believed to be reliable, but is not guaranteed as to its accuracy. Contact designated personnel from SFI or SXM for specific trading advice to meet your trading preferences.
Reproduction or use in any format without authorization is forbidden.
© Copyright 2024. All rights reserved.


