



USD/JPY Eyes October Low as China Responds to Trump Tariffs
USD/JPY falls to a fresh yearly low (144.00) as China imposes an additional 50% tariffs on the US.
Written by
David Song
Strategist
US Dollar Outlook: USD/JPY
USD/JPY falls to a fresh yearly low (144.00) as China imposes an additional 50% tariffs on the US, and the update to the US Consumer Price Index (CPI) may keep the exchange rate under pressure as the report is anticipated to show slowing inflation.
USD/JPY Eyes October Low as China Responds to Trump Tariffs
USD/JPY may attempt to test the October low (142.97) as it extends the decline from earlier this week, and the exchange rate may track the negative slope in the 50-Day SMA (150.04) as the threat of a trade war puts pressure on the Federal Reserve to further unwind its restrictive policy.
Join David Song for the Weekly Fundamental Market Outlook webinar.
In turn, speculation surrounding US monetary policy may continue to sway the carry trade as Fed officials still forecast lower interest rates for 2024, and the US Dollar may face headwinds ahead of the next Federal Open Market Committee (FOMC) rate decision on May 7 as the shift in trade policy clouds the economic outlook.
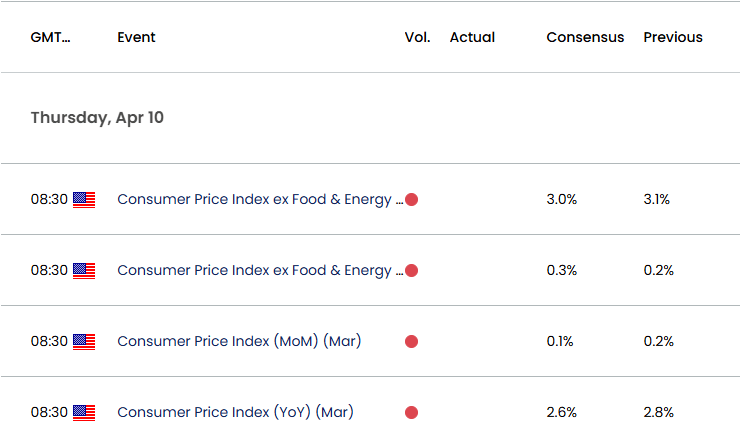
US Economic Calendar
In addition, the update to the US CPI may drag on the Greenback as the headline and core reading for inflation are expected to narrow in March, and signs of slowing price growth may encourage the Fed to implement lower interest rates in an effort to prevent a recession.
However, a higher-than-expected CPI print may push the FOMC to further combat inflation, and evidence of sticky price growth may generate a bullish reaction in the Greenback as it curbs speculation for an imminent Fed rate-cut.
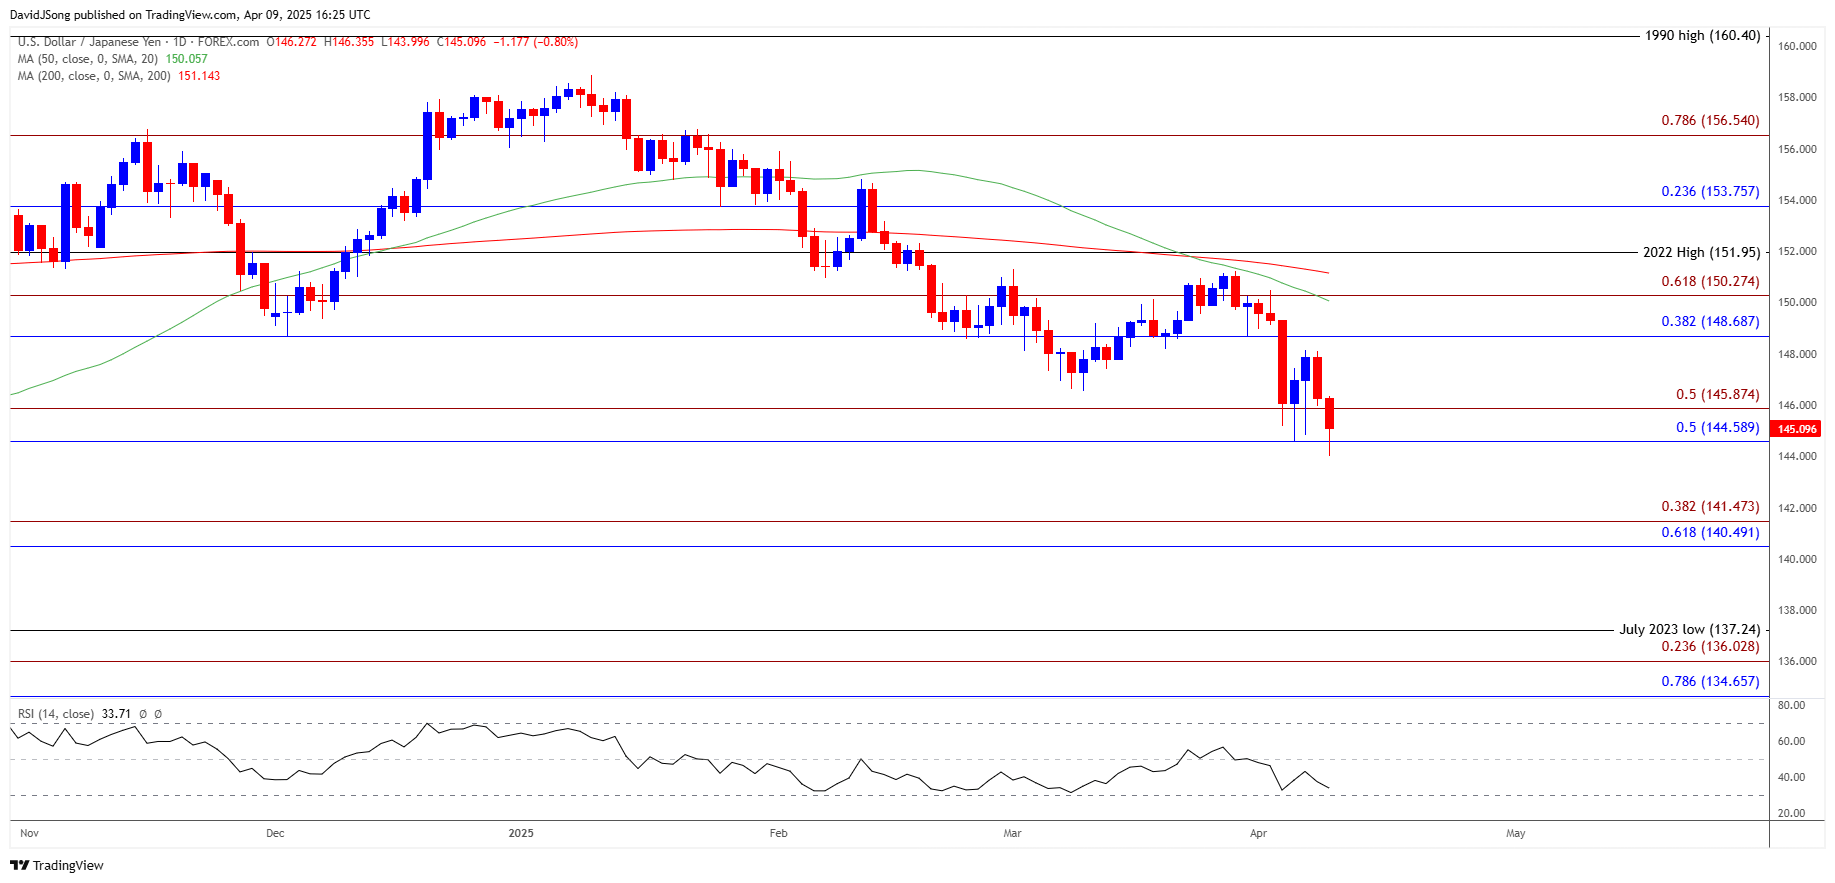
With that said, a rebound in USD/JPY may keep the Relative Strength Index (RSI) out of oversold territory, but a move below 30 in the oscillator is likely to be accompanied by a further decline in the exchange rate like the price action from last year.
USD/JPY Price Chart – Daily
Chart Prepared by David Song, Senior Strategist; USD/JPY on TradingView
- USD/JPY extends the decline from earlier this week to register a fresh yearly low (144.00) but need a close below the 144.60 (50% Fibonacci retracement) to 145.90 (50% Fibonacci extension) region a bring the October low (142.97) on the radar.
- A break/close below the 140.50 (61.8% Fibonacci retracement) to 141.50 (38.2% Fibonacci extension) zone opens up the July 2023 low (137.24), with the next area of interest coming in around 134.70 (78.6% Fibonacci extension) to 136.00 (23.6% Fibonacci extension).
- At the same time, lack of momentum to close below the 144.60 (50% Fibonacci retracement) to 145.90 (50% Fibonacci extension) region may push USD/JPY back towards the 148.70 (38.2% Fibonacci retracement) to 150.30 (61.8% Fibonacci extension) region, with a breach above the monthly high (150.49) raising the scope for a test of the March high (151.31).
Additional Market Outlooks
Canadian Dollar Forecast: USD/CAD Rebound Fizzles amid Trump Tariff Negotiations
AUD/USD Selloff Persists as US Threatens Additional 50% Tariff for China
Euro Forecast: EUR/USD Completes Cup-and-Handle Formation
GBP/USD Pulls Back to Keep RSI Out of Overbought Zone
--- Written by David Song, Senior Strategist
Follow on Twitter at @DavidJSong
Related tags:






Web Trader platform
Our sophisticated web-based platform is packed with features.
Open an account today
Experience award-winning platforms with fast and secure execution.
Economic calendar
Related articles

USD/JPY weekly outlook: Payrolls may challenge the Fed’s hawkish reset
USD/JPY has finally woken from its slumber. Payrolls now loom as the key test of whether the latest hawkish repricing sticks or sinks.


Japanese Yen Forecast: USD/JPY Survives 5% Intervention Plunge – Uptrend at Risk 8 25 2026
USD/JPY remains perched above major trend support as intervention risk and Jackson Hole raise the stakes for the next directional move.

FX Futures Positioning: USD Falls, CAD Strengthens, JPY Shorts Return | COT Report
USD weakness, rising CAD demand and renewed JPY shorts shape this week’s COT report ahead of Jackson Hole.
