


ASX 200 Market Outlook: All Sectors See Red After Hawkish RBA Hold
ASX 200 fell across all sectors after a hawkish RBA hold lifted rate expectations and pushed yields higher.
Written by
Matt Simpson
Market Analyst
The Reserve Bank of Australia kept the cash rate at 3.6% as expected but delivered a distinctly hawkish tone. Policymakers warned that inflation risks have “tilted to the upside”, with Governor Bullock signalling the board remains dissatisfied with current price pressures. February’s meeting now hinges on the trajectory of inflation, placing extra weight on the January 26 quarterly CPI release.
Bond markets reacted swiftly: Australia’s 3-year yield climbed to 4.15%, while the 1-year sits at 3.97%. Bloomberg data shows a 25bp hike now fully priced by June, compared with November before the meeting. AUD/USD gained 0.4%, although further upside may be limited given a hawkish outcome has been priced for weeks.
The ASX 200 fell 0.45% in its worst session in six days, with all 11 sectors trading lower following the RBA’s stance.
View related analysis:
ASX 200 Slides as Hawkish RBA Weighs on All Sectors
ASX 200 Market Snapshot
- A 3-bar evening star reversal formed on the ASX 200 daily cash chart.
- Information Technology (XIJ), Health Care (XHJ) and Energy (XEJ) led all 11 sectors lower.
- Materials (XMJ) pulled back from its record high for a second straight session.
- Market breadth weakened: 66 stocks advanced, 123 declined and 11 finished unchanged.

Chart analysis by Matt Simpson - source: ASX, LSEG

ASX 200 Futures (SPI 200) Sector Analysis
The daily chart shows bearish momentum returning around the 200-day EMA and monthly pivot. Daily volumes remain below the 20-day average, although they are slightly higher than yesterday’s. While price holds beneath last week’s high, the bias still favours a move towards 8500.
Take note that the FOMC meeting could influence the ASX 200 via Wall Street’s reaction. I suspect the Fed will lean slightly hawkish, which may lift the US dollar and weigh on US indices. That said, the ASX also has a tendency to firm into the new year from around mid-December.
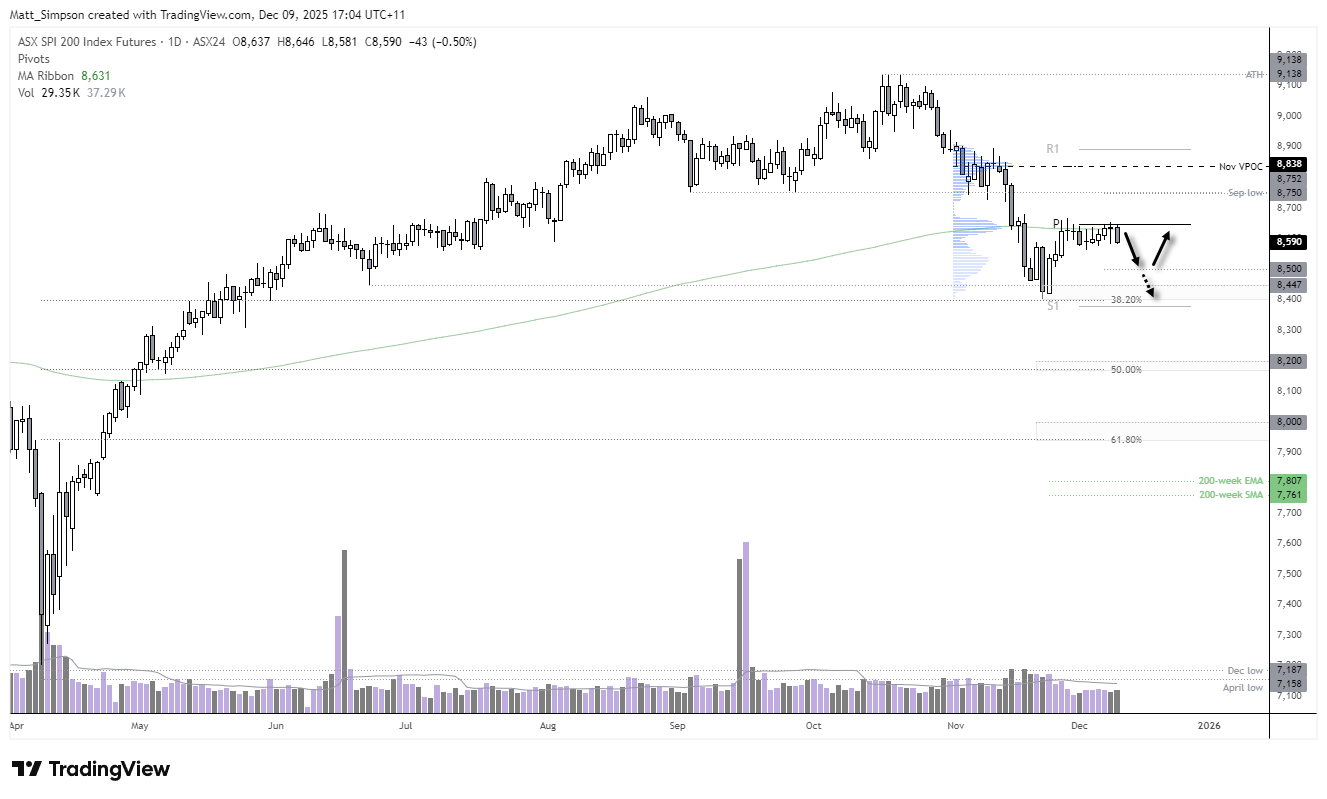
Chart analysis by Matt Simpson - Source: TradingView, ASX SPI 200 Index Futures
Related tags:






Web Trader platform
Our sophisticated web-based platform is packed with features.
Open an account today
Experience award-winning platforms with fast and secure execution.
Economic calendar
Related articles

Euro Short-term Outlook: EUR/USD Pullback Nears Pivotal Uptrend Support 8 28 2026
Warsh's comments accelerated the EUR/USD selloff, raising the stakes as buyers look to stabilize the broader recovery.

Gold and S&P 500 analysis: What now after Warsh’s hawkish speech?
The dollar surged across the board after the Fed Chair Kevin Warsh surprised with a hawkish-leaning speech at the Jackson Hole summit. All the bearish dollar bets that had been accumulated since last Friday on the back of data weakness and bond market troubles had to be squared and that triggered a short squeeze rally for the dollar. Gold and silver dropped, as a result, as too did bitcoin, while US indices were giving back earlier gains.


EUR/USD forecast: All eyes on Warsh at Jackson Hole - Forex Friday
For much of this week, the EUR/USD has been edging lower with the US dollar regaining some ground after last week’s sell-off that was triggered, in part, by the bond market worries. Investors have been unwilling to bet further against the US dollar so far this week ahead of Kevin Warsh’s keynote speech at the Jackson Hole summit, due later today.