


Australian Dollar Forecast: AUD/USD Bulls Eye Key Resistance as December Range Takes Shape 12 2 2025
AUD/USD presses toward key resistance as the December range forms. Traders watch for a reaction at this level for direction in the days ahead. Battle lines drawn.
Written by
Michael Boutros
Sr. Technical Strategist
Australian Technical Forecast: AUD/USD Weekly Trade Levels
- AUD/USD rebounded approaching confluent resistance as the December opening-range begins to take shape- possible head-and-shoulders formation identified
- Recent rally may be vulnerable, and the immediate focus is on the reaction to this key barrier as price approaches the 2022 trendline
- Resistance 6592/98 (key), 6651, 6723 - Support 6453 (key), 6404/20, 6357
The Australian Dollar closed November with a V-shaped recovery, and the AUD/USD rebound is now approaching pivotal resistance as the December opening-range begins to take shape. Price has not yet reached the barrier, but the push toward the 2022 trendline defines a critical area of interest in the sessions ahead. While the near-term outlook remains constructive, the reaction into this zone will be key in determining whether the advance can extend or if a near-term inflection takes hold. Traders should stay alert as momentum carries the pair toward this threshold. Battle lines drawn on the AUD/USD weekly technical chart.
Review my latest Weekly Strategy Webinar for an in-depth breakdown of this Aussie setup and more. Join live on Monday’s at 8:30am EST.
Australian Dollar Price Chart – AUD/USD Weekly
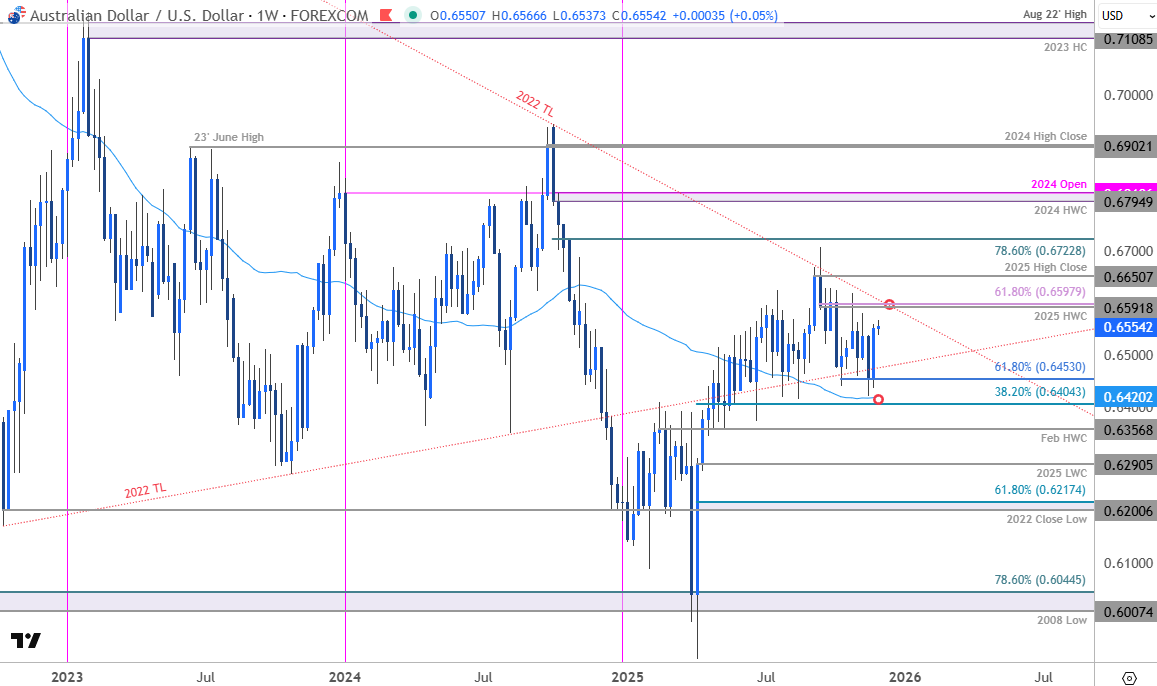
Chart Prepared by Michael Boutros, Sr. Technical Strategist; AUD/USD on TradingView
Technical Outlook: In last month’s Australian Dollar Forecast we noted that, “from a trading standpoint, rallies would need to be limited to 6605 IF price is heading lower on this stretch with a close below 6469 needed to fuel the next leg of this decline…” AUD/USD registered an intraweek high at 6580 the following week before turning lower and although price did mark a weekly close low at 6456, the bears were unable to break below the 61.8% extension of the September decline at 6453.
The subsequent rebound has now rallied more than 2.2% off the lows and with confluent resistance now in view at 6592/98- a region defined by the 2025 high-week close and the 61.8% retracement of the decline off the yearly high. Note that the 2022 trendline converges on this threshold over the next few weeks, and a breach / weekly close above is needed to keep the bulls in control here. Subsequent resistance objectives eyed at the 2025 high-close at 6651 and the 78.6% retracement of the 2024 decline at 6723.
A break below the weekly lows would expose key support at the 38.2% retracement of the yearly range and the 52-week moving average at 6404/20. Losses below this threshold would put a potential head-and-shoulders pattern in play with subsequent support objectives eyed at the February high-week close (HWC) at 6356 and the 2025 low-week close (LWC) at 6290. Look for a larger reaction there IF reached.







Web Trader platform
Our sophisticated web-based platform is packed with features.
Open an account today
Experience award-winning platforms with fast and secure execution.
Economic calendar
Related articles

USD/JPY weekly outlook: Payrolls may challenge the Fed’s hawkish reset
USD/JPY has finally woken from its slumber. Payrolls now loom as the key test of whether the latest hawkish repricing sticks or sinks.

Euro Short-term Outlook: EUR/USD Pullback Nears Pivotal Uptrend Support 8 28 2026
Warsh's comments accelerated the EUR/USD selloff, raising the stakes as buyers look to stabilize the broader recovery.

AUD/CAD breakout puts the Bradman barrier in sight
A bullish breakout has pushed AUD/CAD to its highest level since early 2021. Whether it can clear 0.9994 may determine if the move extends well above parity.