

Australian Dollar Outlook: AUD/USD Faces RBA-Fed Rate Tug-of-War
AUD/USD faces competing RBA and Fed hike bets this week, with Australian GDP and US payrolls set to test the eight-week rally.
Written by
Matt Simpson
Market Analyst
The Australian dollar snapped an eight-week winning streak after Fed Chair Kevin Warsh’s hawkish Jackson Hole speech revived US rate-hike bets. Yet stronger Australian inflation and household spending have also raised expectations of another RBA hike, leaving AUD/USD caught between competing policy risks ahead of Australian GDP and US nonfarm payrolls.
View related analysis:
AUD/USD Caught Between RBA and Fed Hike Bets
Warsh described the Fed's 2% inflation objective as a "firm, fixed target" and said policymakers need to be confident that underlying inflation is moving towards it "clearly and at sufficient speed". Otherwise, in his words, the Fed has "work to do". Fed funds futures now imply around a 60% chance of a hike in September and 50% chance of another in December, rising to 85% for a second hike by March.
Were it not for renewed bets of an RBA hike, AUD/USD could have closed lower than it did. Interestingly, if the RBA hikes once and the Fed twice, the RBA-Fed cash rate spread would narrow to just 10bp. That makes relative rate expectations increasingly important for AUD/USD, particularly if markets become more confident that the Fed has two more hikes to deliver.
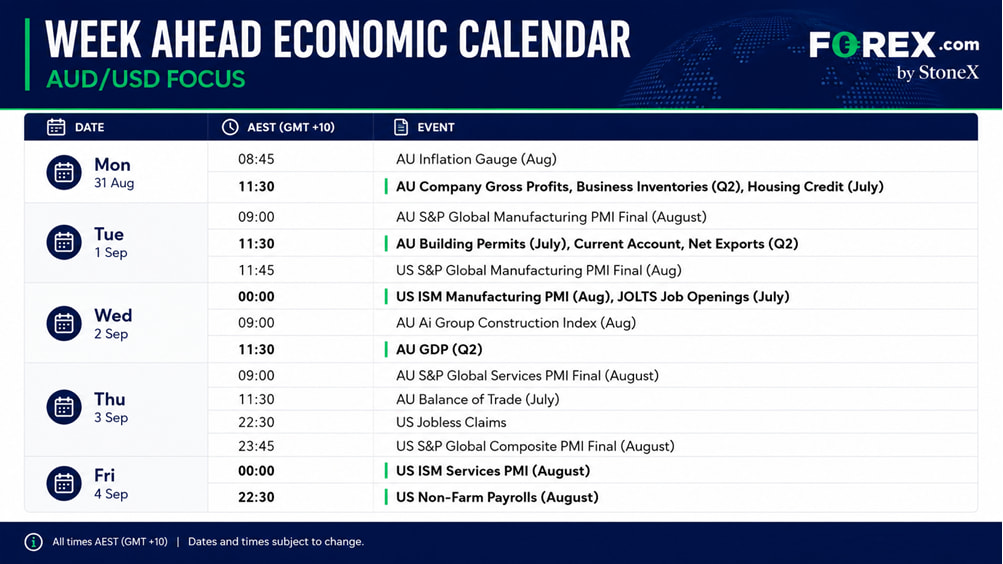
Australia This Week: Economic Data and Events for AUD/USD Traders
Australian GDP Could Reinforce RBA Hike Bets
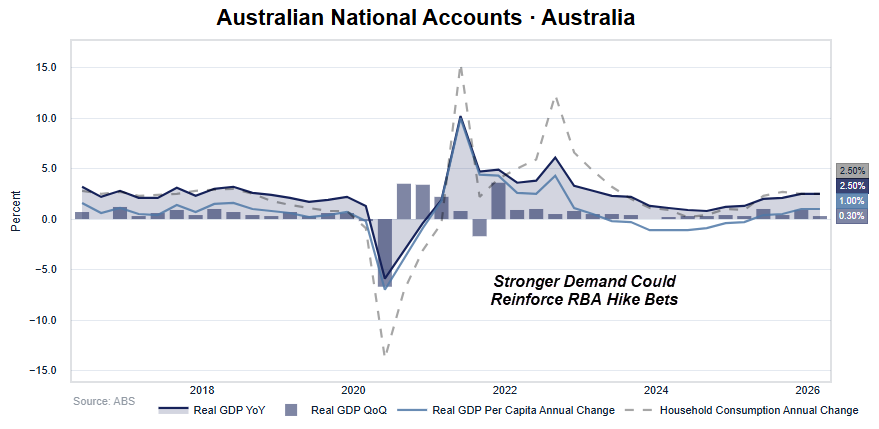
Australia’s Q2 GDP report is the main domestic event on Wednesday. Stronger growth would add to the case that demand remains too resilient, particularly after hot inflation and household spending data revived expectations of another RBA hike. Tuesday’s current account and net exports data could also shape GDP expectations.
NAB and Deutsche Bank expect a September hike, while ANZ and CBA favour November. Citi and UBS expect another hike before year-end, while Westpac remains the outlier and expects the RBA to stay on hold through 2026.

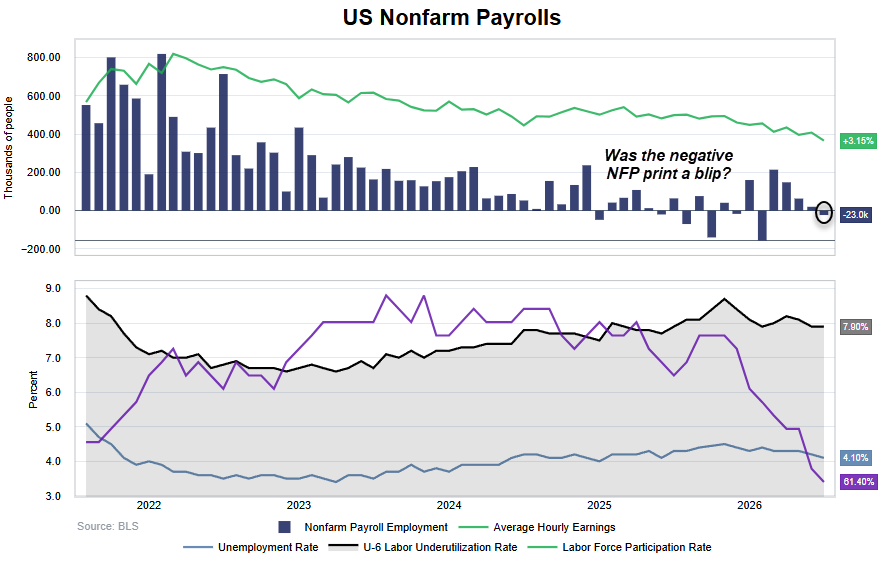
US Payrolls Put Fed Hike Bets to the Test
ISM manufacturing and services lead into Friday’s nonfarm payrolls report, which could be the biggest event risk for AUD/USD this week.
Warsh’s hawkish Jackson Hole speech raised the bar for weak US data. A resilient payrolls report could strengthen Fed hike bets and the US dollar, while another soft or negative print would test the market’s newly hawkish interpretation and potentially support AUD/USD. Conversely, another negative payroll print — or a material deterioration across employment, unemployment and wages — would test the market's newly hawkish interpretation of Warsh and could quickly unwind some of Friday's US-dollar gains.
That arguably makes Friday's employment report the biggest single event risk for AUD/USD this week.
This content was created by an affiliate of FOREX.com and represents the views and opinions of the author/speakers, not the views and opinions of FOREX.com, StoneX Group Inc., or its subsidiaries. The content has not been independently reviewed by FOREX.com.
AUD/USD Technical Analysis: Australian Dollar vs US Dollar
AUD/USD Correlations
Most 10-day correlations have weakened considerably, including the US dollar at just -0.25. That suggests AUD/USD is currently being driven by a more idiosyncratic mix of Australian, Chinese and commodity-related factors, rather than simply tracking broad US dollar or risk-on/risk-off moves.
The 20-day data still shows particularly strong relationships with CNH/USD, gold and commodities, although the inverse relationship with the US dollar has softened to -0.67. Equity correlations have also flipped negative over this window, highlighting some divergence between the Australian dollar and broader risk sentiment.
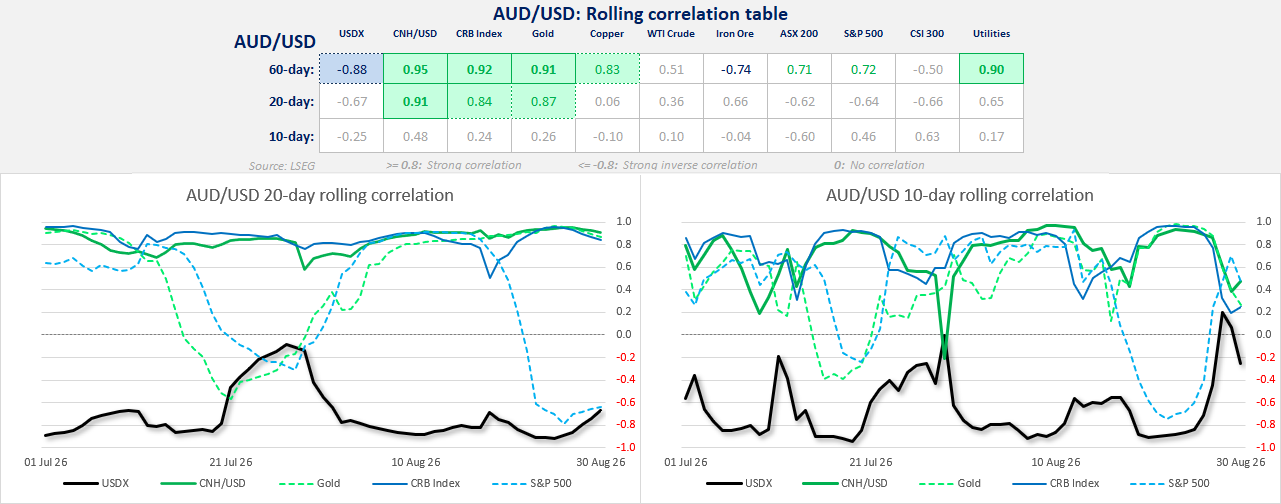
Source: LSEG
AUD/USD Futures Positioning | COT Report
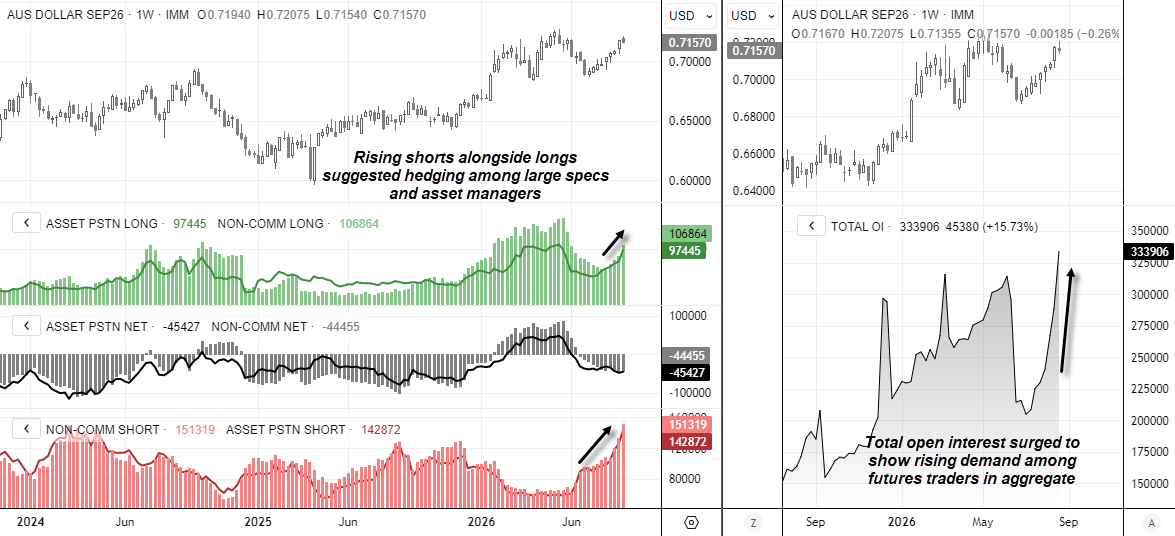
I expected to see a reduction of gross-short exposure in the latest Commitment of Traders (COT) report. Yet instead we saw another sharp rise of longs and shorts, which effectively kept net-short exposure to around 90k among large speculators and asset managers. It would see, traders were hedging their best heading into what would turn out to be a hot CPI report.
However, total open interest continued to surge to a new high. Which represents rising demand for the Australian dollar among all trendline groups. That said, the rebound of the US dollar on Friday post Jackson hole saw the Aussie close marginally lower to snap an 8-week winning streak and form a small shooting star candle.
Source: CFTC (COT) CME, LSEG
For traders wanting a deeper understanding of futures positioning, I’ve also published a guide on how to read and interpret weekly COT data in forex markets.
AUD/USD Options and Volatility Analysis (Risk Reversals, HVN Levels)
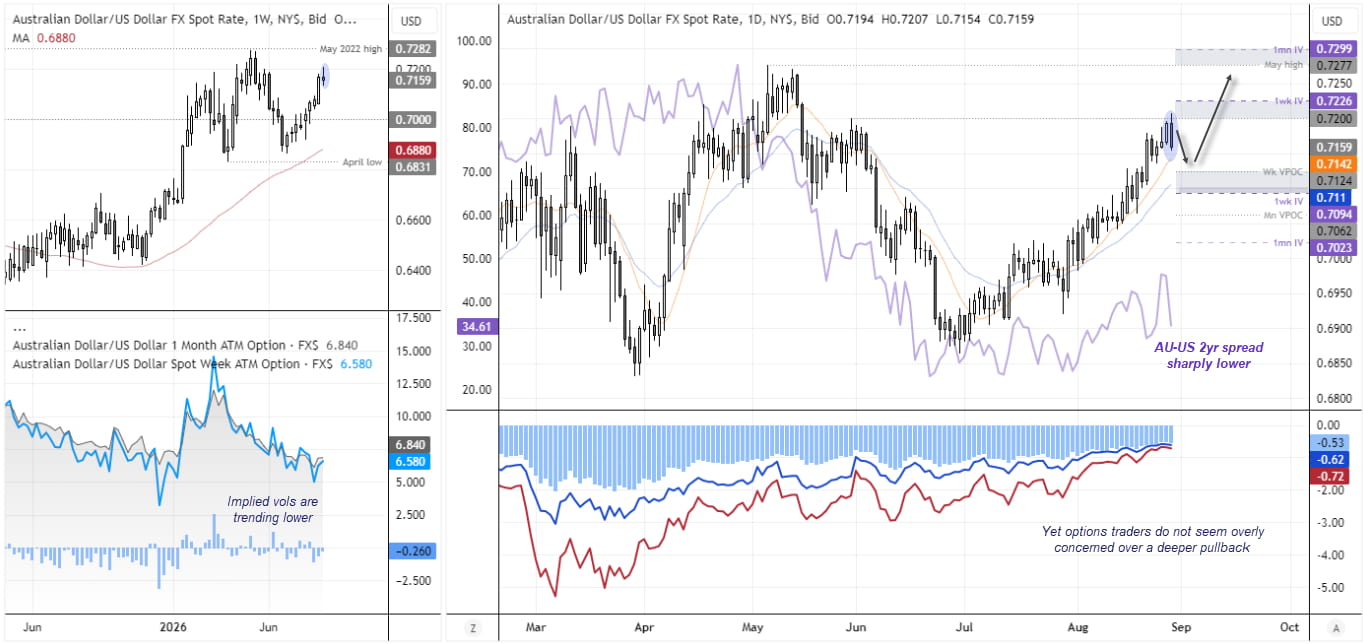
Friday’s bearish engulfing candle and weekly shooting-star reversal pattern suggest a near-term top may have arrived, with scope to retrace towards the 10- and 20-day EMAs. Note that a weekly VPOC sits between these averages, while the lower one-week implied volatility level sits just beneath 71c. Ultimately, I’m not on guard for an aggressive pullback unless Australian data undershoots, lowers RBA hike bets and allows USD bulls to embrace the prospect of 50bp of Fed hikes on expectations that the RBA-Fed spread could narrow significantly.
However, risk reversals remain elevated, so for now at least, AUD/USD options traders are not rushing to buy puts hand over fist relative to calls. Implied volatility is also trending lower overall, with the 1-month remaining above the 1-week. In other words, options traders do not seem overly concerned about a deep pullback.
For now, I suspect bulls will continue to look for evidence of a swing low and seek to buy dips in AUD/USD.
Source: ICE, TradingView









Web Trader platform
Our sophisticated web-based platform is packed with features.
Open an account today
Experience award-winning platforms with fast and secure execution.
Economic calendar
Related articles

Australian Dollar Outlook: AUD/USD Faces RBA-Fed Rate Tug-of-War
AUD/USD faces competing RBA and Fed hike bets this week, with Australian GDP and US payrolls set to test the eight-week rally.

Canadian Dollar Forecast: USD/CAD Weekly Reversal Puts Yearly Uptrend Back in Focus 8 29 2026
USD/CAD has staged its strongest weekly advance since June, shifting the focus to whether a more durable low is finally taking shape.


USD/JPY weekly outlook: Payrolls may challenge the Fed’s hawkish reset
USD/JPY has finally woken from its slumber. Payrolls now loom as the key test of whether the latest hawkish repricing sticks or sinks.
