


Bitcoin Analysis BTC tries to hold the 60k area
During the latest trading session, Bitcoin started to show a gain of more than 2.6%, moving slightly back above the key 60k area. However, this advance also highlights the neutral phase that continues to surround the cryptocurrency, as the weakness seen in previous weeks remains relevant.
Written by
Julian Pineda
Market Analyst
During the latest trading session, Bitcoin started to show a gain of more than 2.6%, moving slightly back above the key 60k area. However, this advance also highlights the neutral phase that continues to surround the cryptocurrency, as the weakness seen in previous weeks remains relevant.
For now, demand activity is still not strong enough to confirm a clear shift in bias. Because of this, Bitcoin may be entering a phase of indecision, especially as the market tries to determine whether it can hold the psychological 60k area over the next few trading sessions.

Is BTC activity still under pressure?
Despite the slight recovery during the session, Bitcoin has been facing significant weakness for several weeks. The market continues to show lower appetite for cryptocurrencies, in an environment where high interest rates in the United States can increase borrowing costs and reduce the liquidity available for risk assets such as crypto.
Although BTC is trying to hold an important psychological area in the short term, demand activity still does not seem strong enough to confirm a more solid recovery.
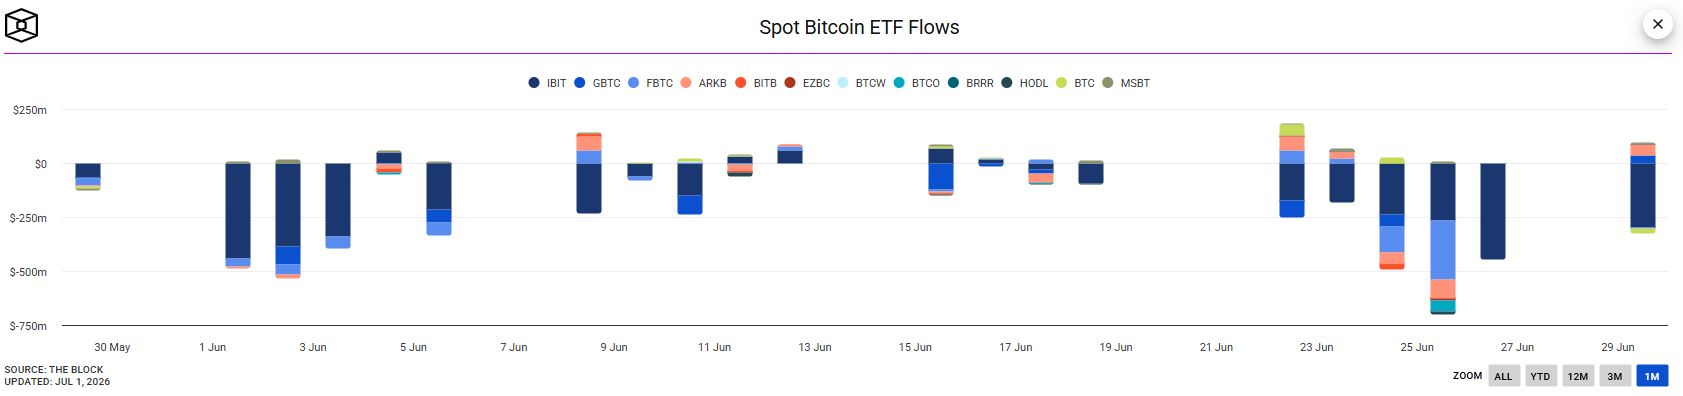
This dynamic can also be seen in Bitcoin ETFs. As of June 29, 2026, the market recorded another net capital outflow of more than 300 million dollars. For now, the common factor remains the constant outflow of capital, a trend that has been in place for several weeks.
In fact, the Bitcoin market has not recorded a positive week of institutional demand in more than a month. This suggests that, despite the recent price rebound, the move still looks more like a technical recovery than a real and consistent demand inflow capable of offsetting the ETF outflows seen in previous weeks.
Source: TheBlock
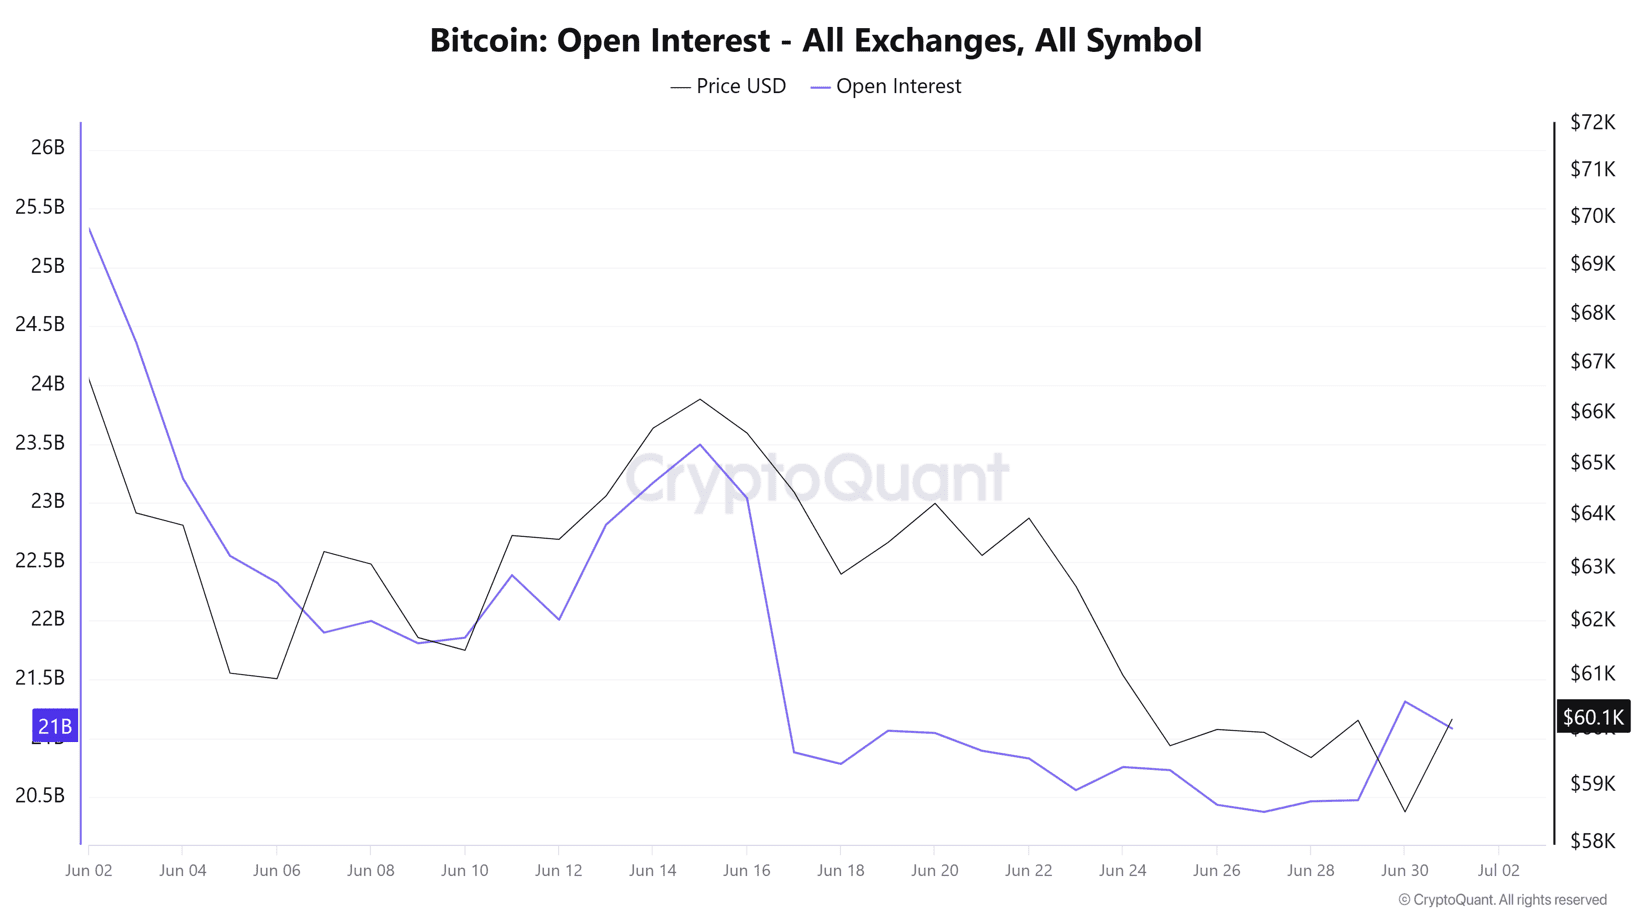
Another important metric to evaluate market activity is open interest, which measures the total number of open buy and sell positions across different exchanges. This indicator helps track part of the demand dynamic from both institutional and retail participants.
Now, open interest has tried to recover in the short term and is now above the 21 billion dollar area. Together with the recent rise in Bitcoin’s price, this could suggest a small increase in long positions. Still, this recovery is far from dominant.
The indicator remains well below the levels seen in early June, when it was above 25 billion dollars. This shows that, although some demand may have returned to different exchanges in recent sessions, it is still not enough to point to consistent buying strength. For now, the move looks more like a natural recovery after several weeks of losses.
Source: Cryptoquant
Taking all of this into account, the slight increase in demand activity around Bitcoin does not seem enough to confirm a stronger buying bias. If activity indicators fail to move closer to the levels seen months ago, the current recovery could continue to reflect indecision rather than a clear change in market direction.
If BTC stays near the psychological 60k area without a stronger recovery in activity, this phase of indecision could remain relevant over the next few trading sessions.
Confidence remains in sensitive territory
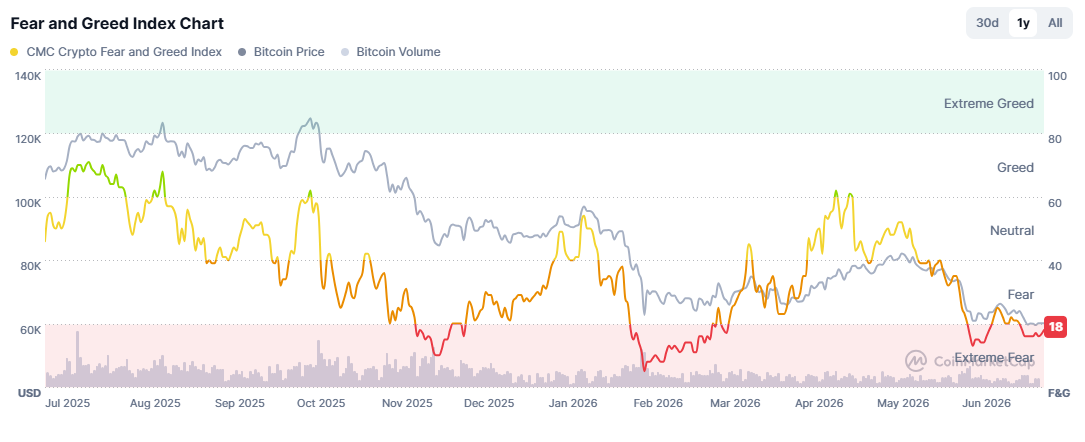
Looking at the cryptocurrency Fear and Greed Index, the indicator is still moving near the 18-point area, within “extreme fear” territory. Although there has been a slight recovery in recent sessions, the index has not shown a clear improvement in short-term confidence.
This behavior shows that the crypto market remains cautious, with no strong signs of a solid recovery in sentiment.
Source: Coinmarketcap
This is important because, while sentiment remains in negative territory, it will be difficult to build a favorable environment for consistent cryptocurrency demand. If the index stays weak, it could suggest that investor perception remains fragile, limiting demand for Bitcoin and keeping the market in a phase of indecision over the next few sessions.
Technical outlook for Bitcoin
Source: StoneX, Tradingview
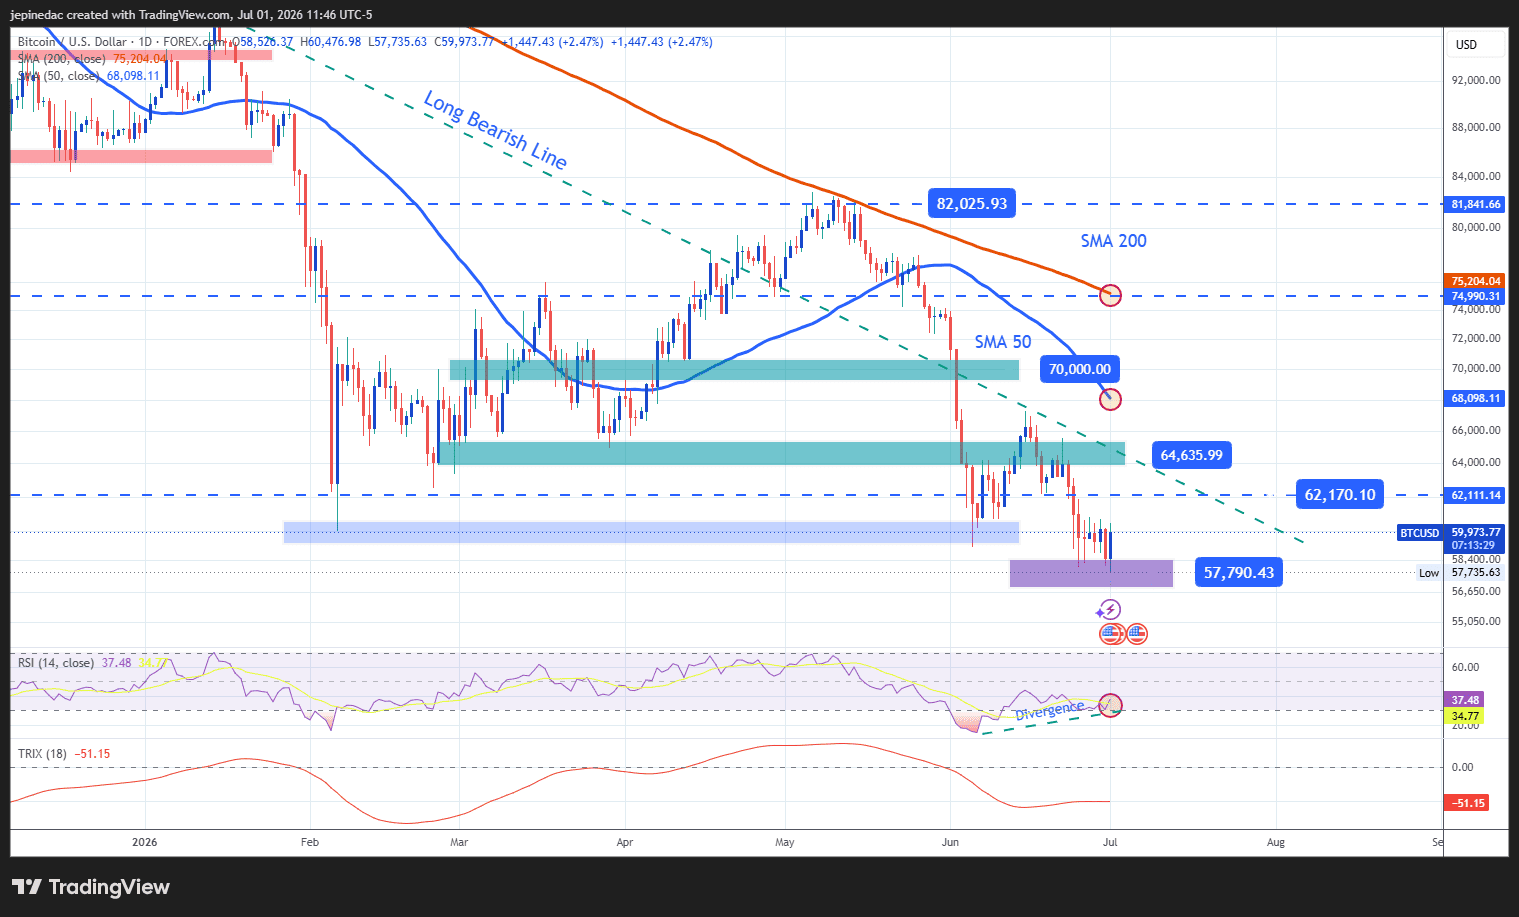
- The major bearish trendline continues to dominate: Now, the dominant technical pattern on the daily BTC chart remains the major bearish trendline that has shaped price action over the last few months. Despite recent recovery attempts, the bullish move is still not strong enough to confirm an important structural change. If bearish pressure stabilizes again, this trendline could remain relevant over the next few trading sessions.
- TRIX: The TRIX indicator has started to flatten, although it remains below the 0 neutral line. This suggests that bearish strength is still present in the long-term exponential moving averages. For now, the selling bias appears to be shifting more toward neutrality than toward a new relevant buying bias.
- RSI: The RSI continues to move below the 50 level, which shows that the average bearish impulse remains relevant on the chart. However, BTC is also forming lower lows in price while the RSI is forming higher lows. This suggests a possible bullish divergence, warning of a recent excess of selling pressure. This could open the door to bullish corrections over the next few sessions, although it is still not enough to put the long-term bearish trendline at risk.
Key levels:
- 64,600 – Important resistance: Relevant high area from recent weeks that aligns with the barrier formed by the bearish trendline. Moves toward this level could start to put the selling structure at risk and open the door to a more dominant buying bias over the coming weeks.
- 62,170 – Nearby barrier: Nearby resistance level that corresponds to a neutrality zone. This point could act as a tentative barrier if bullish corrections continue to develop over the next few trading sessions.
- 57,790 – Definitive support: Recent low area that also matches the 2026 lows. Moves below this level could reinforce a dominant selling bias and open the door to a larger extension of the bearish trendline over the coming weeks.
Written by Julian Pineda, CFA, CMT – Market Analyst
Follow him on: @julianpineda25







Web Trader platform
Our sophisticated web-based platform is packed with features.
Open an account today
Experience award-winning platforms with fast and secure execution.
Economic calendar
Related articles

Bitcoin Forecast: BTC/USD Back to $80K Ahead of Warsh’s Jackson Hole Speech
After surging over $15,000 in the past 10 days alone, there is risk of a near-term pullback if Warsh says anything remotely hawkish at Jackson Hole - what are the levels to watch from here?


Bitcoin’s failed breakouts are becoming hard to ignore
Three failed breakout attempts and fading momentum have put Bitcoin bulls on notice. Another rejection could open the door lower just as attention swings back towards NVIDIA and the AI trade.


US Dollar, Gold & Bitcoin Weekly Technical Outlook 8 24 2026
Key levels on active technical setups in DXY, Gold, and Bitcoin heading into the start of the week.
