


Bitcoin Bounce Fails to Shake Bearish Outlook
Bitcoin’s rally above key averages failed to lift sentiment, as volume, RSI, and higher timeframe patterns continue to point to bearish momentum.
Written by
Matt Simpson
Market Analyst
Bitcoin’s rebound early this week failed to convince traders that the bearish phase is over. While prices gapped higher on improved US–China sentiment, key indicators such as volume delta and momentum remain weak. With prices still capped below 120k, the broader bias stays tilted toward a corrective rally rather than a renewed uptrend.
View related analysis:
Bitcoin Bears Remain in Control Despite Short-Term Rebound
Last Thursday I warned of the potential for a short-covering bounce for bitcoin futures, given the notably bearish volume despite the lack of a bearish breakout. I argued the longer this persisted, the greater the odds of a bounce.
Well, the said bounce occurred following a bout of risk-on sentiment stemming from positive US–China trade deal headlines over the weekend. Yet despite the rise in prices, the 1-month cumulative volume delta (CVD) shows that offers (sell orders) continue to far outweigh bids (buy orders) for Bitcoin. Combined with bearish clues on higher timeframes, I suspect Bitcoin’s bounce is corrective — and that fresh lows could await.

Bitcoin (BTC/USD) Technical Analysis: Bitcoin vs US Dollar
The daily chart shows a gap higher from the 200-day EMA, driven by positive US–China headlines. However, the one-day rally stalled around the 50-day EMA on Monday, forming a small-range session followed by a spinning-top doji — signalling a lack of bullish follow-through from Bitcoin bulls.
The one-month cumulative volume delta (CVD) has turned marginally higher from very low levels, but overall Bitcoin bears appear unfazed by the minor rally. The daily RSI (14) remains below 50 and no bullish divergence has formed. Ultimately, I suspect upside potential could be limited, and bears may look to fade into any short-term rallies while prices remain below the 120k handle.
Note that the October VPOC currently sits around 111,700 near gap support, which may tempt bulls in the near term for another leg higher.
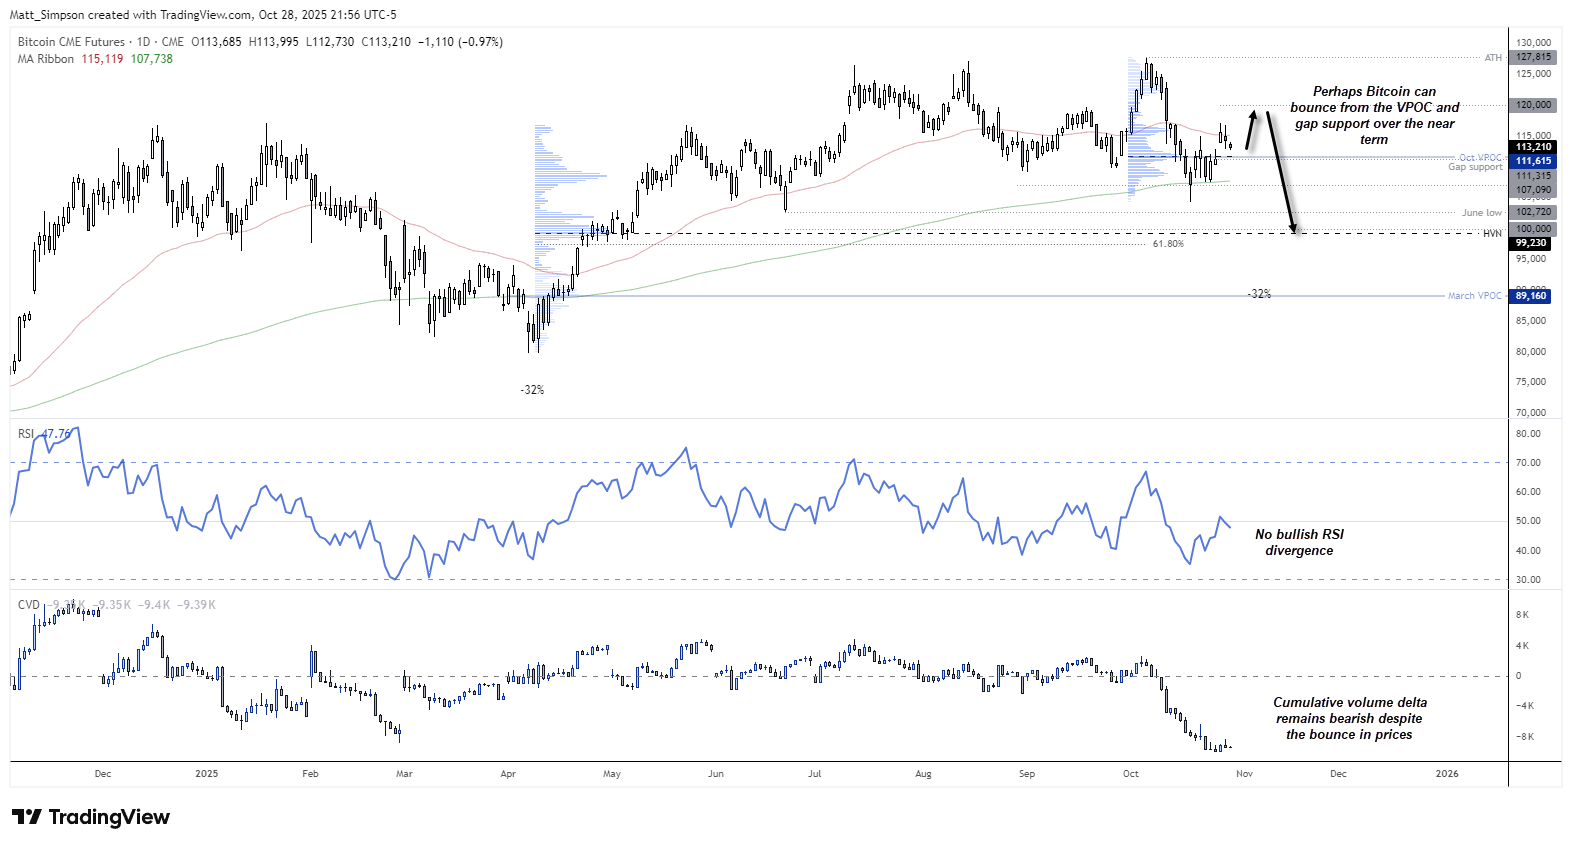
Chart analysis by Matt Simpson - data source: TradingView Bitcoin CME Futures (BTC1!)
Bitcoin’s Long-Term Charts Point to Fading Bull Momentum Below 120k
Price action on the higher timeframes suggests all is not well for Bitcoin bulls. While they clearly enjoyed a solid uptrend from the 2022 low to the 2025 high, the monthly chart shows increasingly choppy price action around the highs. In fact, we’re yet to see a monthly close above 120k, and Bitcoin futures are now on track to form a volatile spinning-top doji. To me, this favours bears looking to fade into false rallies within the upper wicks of the monthly chart.
The weekly chart shows that trading volumes have been trending lower as the bullish trend matured — another sign of bulls losing momentum. However, volumes spiked during the sell-off three weeks ago, suggesting bears are beginning to regain control.
The small inside week last week, combined with the fragile bullish bounce so far this week, also suggests bears may be waiting to fade into higher prices below 120k.
For comparison, a 32% decline from the record high would be in line with the prior two corrections, which implies a potential downside target near the March VPOC at 89,160. The 100k and 90k handles make logical interim targets for bearish traders.
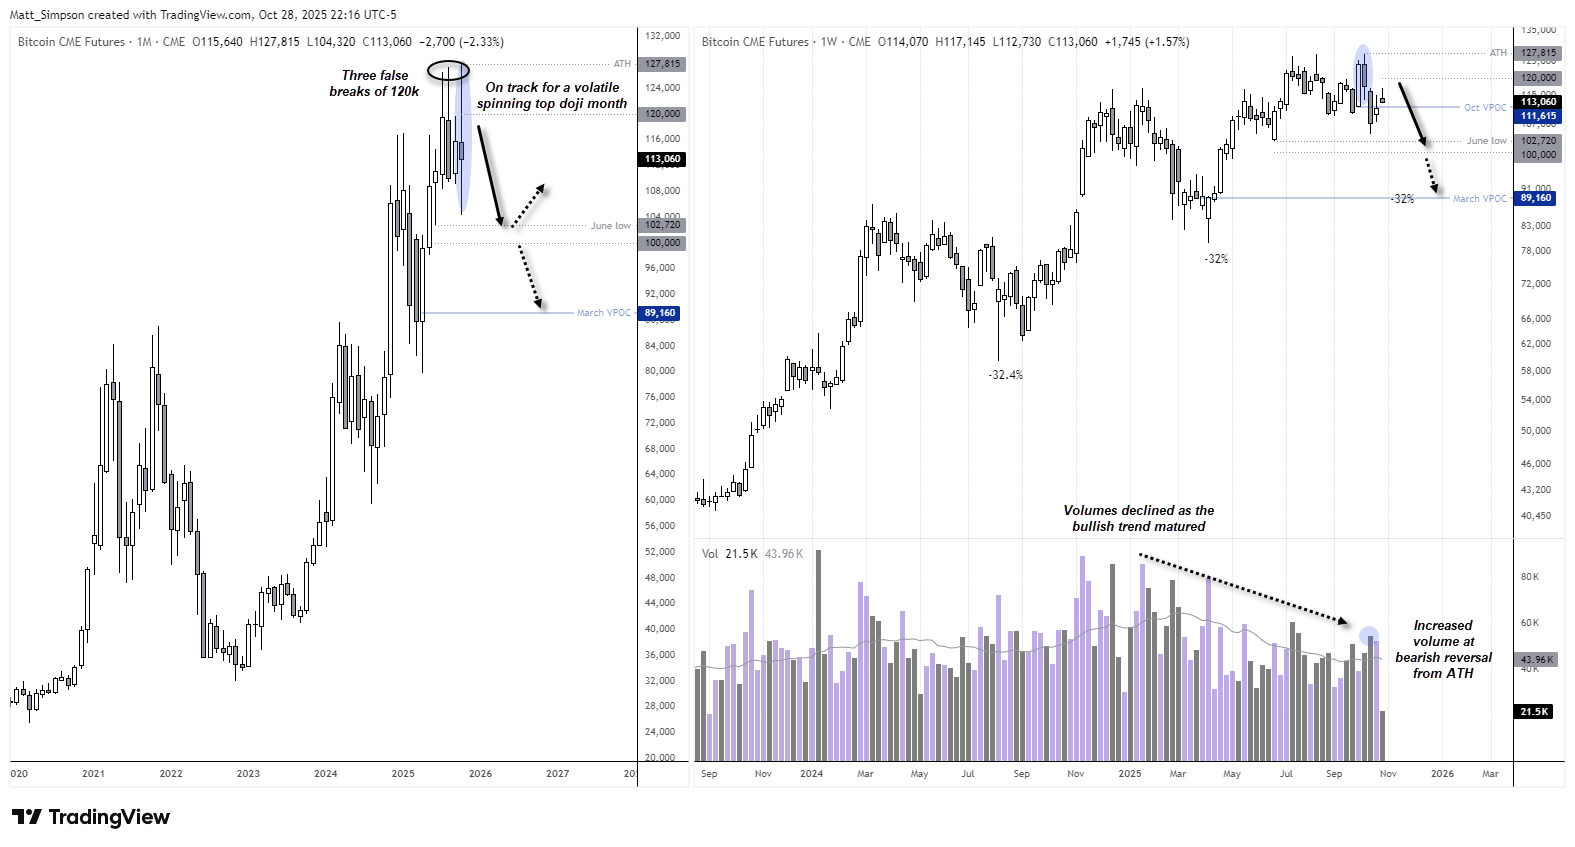
Chart analysis by Matt Simpson - data source: TradingView Bitcoin CME Futures (BTC1!)

Crypto Correlations and Bearish Reversal Signals Across Major Altcoins
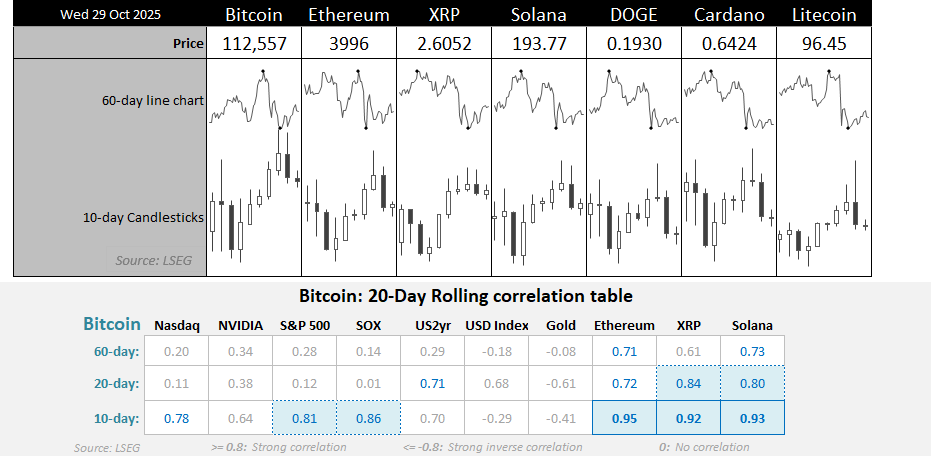
Looking at related crypto spot markets also points towards a lack of bullish appetite among traders.
- Ethereum (ETH) has formed a 3-day bearish reversal (dark cloud cover) pattern around 4,200.
- XRP remains in a tight consolidation range, with two inverted hammer candles rejecting the September low as resistance.
- Solana (SOL) has also produced a dark cloud cover pattern near 200, forming a lower high beneath 210.
- Dogecoin (DOGE) shows an evening star formation on the daily chart, suggesting a potential bearish continuation.
- Litecoin (LTC) posted a bearish outside day and shooting star candle on Tuesday, closing back below 100.
Source: LSEG.
View the full economic calendar
-- Written by Matt Simpson
Follow Matt on Twitter @cLeverEdge
How to trade with City Index
You can trade with City Index by following these four easy steps:
- Open an account, or log in if you’re already a customer
• Open an account in the UK
• Open an account in Australia
• Open an account in Singapore
- Search for the market you want to trade in our award-winning platform
- Choose your position and size, and your stop and limit levels
- Place the trade
Related tags:







Web Trader platform
Our sophisticated web-based platform is packed with features.
Open an account today
Experience award-winning platforms with fast and secure execution.
Economic calendar
Related articles

Bitcoin Forecast: BTC/USD Back to $80K Ahead of Warsh’s Jackson Hole Speech
After surging over $15,000 in the past 10 days alone, there is risk of a near-term pullback if Warsh says anything remotely hawkish at Jackson Hole - what are the levels to watch from here?


Bitcoin’s failed breakouts are becoming hard to ignore
Three failed breakout attempts and fading momentum have put Bitcoin bulls on notice. Another rejection could open the door lower just as attention swings back towards NVIDIA and the AI trade.


US Dollar, Gold & Bitcoin Weekly Technical Outlook 8 24 2026
Key levels on active technical setups in DXY, Gold, and Bitcoin heading into the start of the week.
