


Bitcoin Forecast BTC remains weak ahead of Fed decision
One of the main short-term developments in BTC has been the lack of clear direction in recent price action. Over the last two trading sessions, Bitcoin is down around -1.60%, showing that demand has still not stabilized in a consistent way.
Written by
Julian Pineda
Market Analyst
One of the main short-term developments in BTC has been the lack of clear direction in recent price action. Over the last two trading sessions, Bitcoin is down around -1.60%, showing that demand has still not stabilized in a consistent way.
This lack of direction is partly related to the recent decline in Bitcoin network activity and to the market waiting for the Federal Reserve decision. If the central bank signals a more aggressive short-term stance, caution could return to risk assets such as Bitcoin and lead to more pronounced weakness over the coming sessions.

BTC waits for the central bank
The Federal Reserve is expected to announce its interest rate decision today. So far, markets are pricing in a probability close to 99.6%, according to CMEGROUP, that the Fed will keep rates unchanged at the current 3.75% reference level. For now, the main expectation is that the central bank will remain on hold.
However, markets will pay close attention to the comments that follow the decision, as the rate outlook could change if the Fed confirms a more aggressive stance for the rest of the year. This would be especially relevant in an environment where recent inflation pressures in the United States remain a concern for markets.
In this context, the lack of activity in Bitcoin has become increasingly evident. The cryptocurrency can be affected by changes in US monetary policy, both through their impact on confidence and appetite for risk assets, and through their effect on the bond market, which has at times acted as a substitute market for BTC.
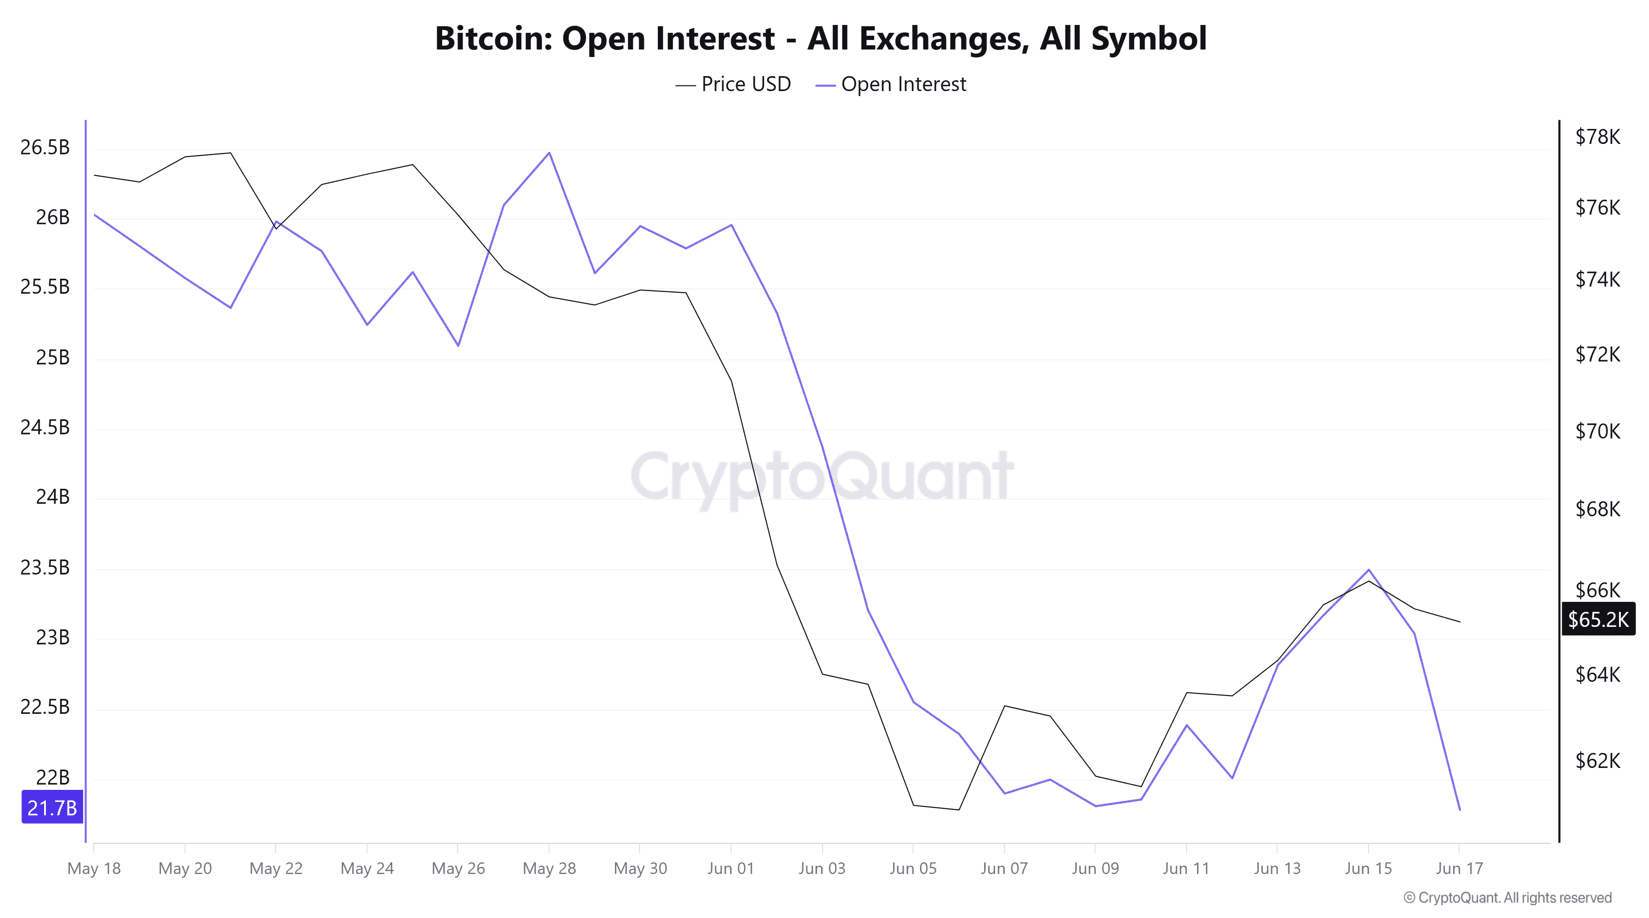
This drop-in activity can be seen in Bitcoin Open Interest, which has fallen toward the 21.7 billion-dollar area in open positions over the last two trading sessions. With this move, the indicator returned to June lows after last week’s attempted recovery. The decline suggests that both long and short positions have started to leave the market, reflecting greater caution ahead of the central bank decision.
Since this decline in Open Interest has happened alongside a mild drop in price, it may also suggest that long positions are once again leaving the market in the short term. This reinforces the idea of weaker demand in a market that is still waiting for clearer signals from the Federal Reserve.
Source: Cryptoquant
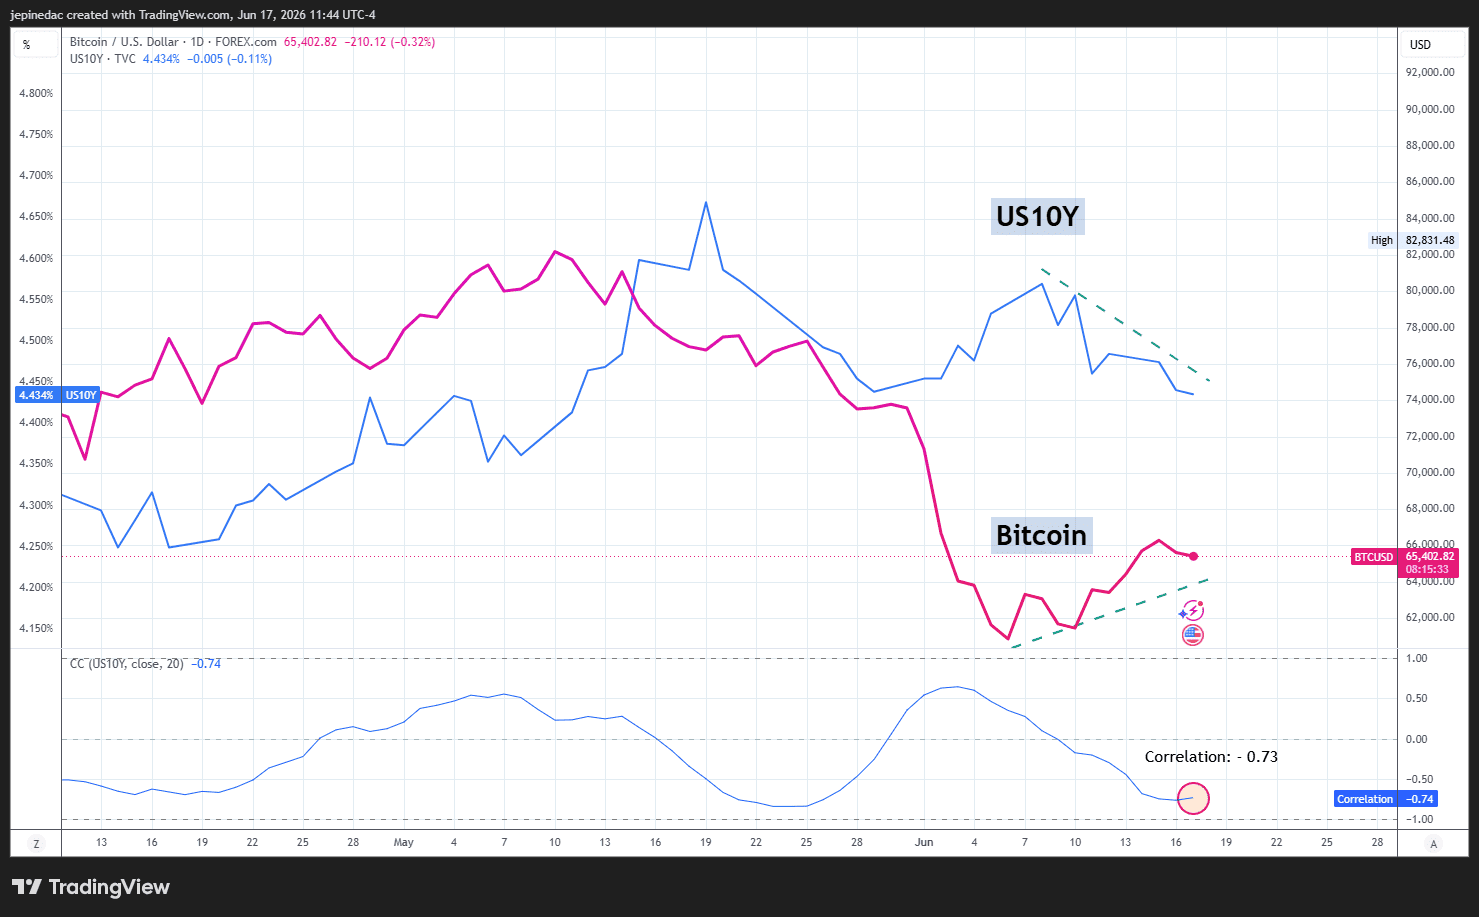
Following this dynamic, it is also important to consider the relationship between Bitcoin price movements and the US 10-year Treasury yield. Over recent sessions, both markets have maintained a relevant inverse relationship, with a correlation coefficient close to -0.73. This means that bond yield movements have shown an important inverse relationship with BTC price action. It is important to remember that correlation coefficients can change over time.
Source: StoneX, TVC, Tradingview
This relationship shows that when bond yields have fallen, Bitcoin has managed to post relevant recoveries. By contrast, when yields have risen consistently, BTC has tended to weaken. For this reason, the bond market remains important, as higher yields in fixed income can increase the appeal of those instruments and reduce demand for risk assets such as Bitcoin.
The Federal Reserve decision is therefore key for BTC. If the central bank’s comments point to a more aggressive monetary policy stance, with higher rates over the coming months, the environment could become less favorable for risk assets. This would not only increase borrowing costs and limit available liquidity but could also push bond yields higher and reduce Bitcoin’s appeal in the short term. That is why markets remain focused on a possible scenario that could generate more consistent weakness in BTC over the coming sessions.
Confidence has not fully recovered
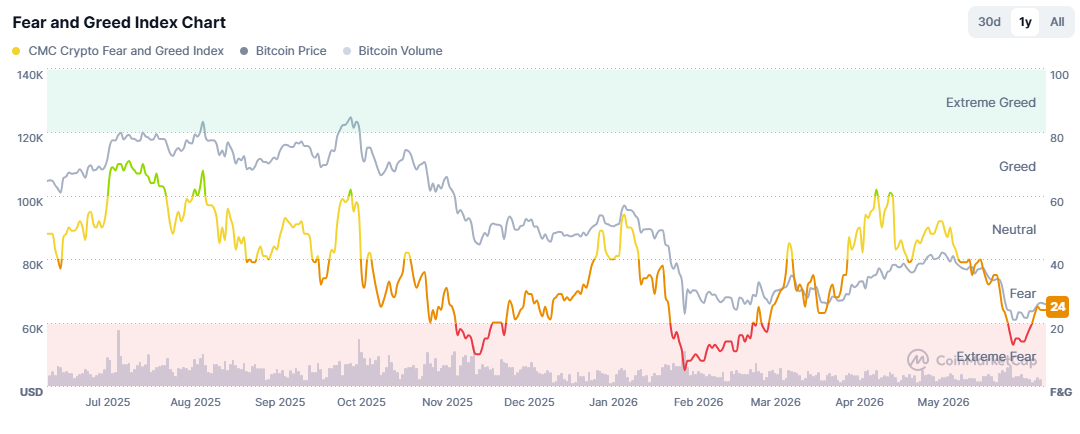
Looking at the Crypto Fear and Greed Index, the indicator has returned to the 24-point area during the session. What stands out is that the index remains stuck in “fear” territory, which does not yet reflect a consistent recovery in crypto market confidence.
Source: Coinmarketcap
This behavior is important because, while sentiment remains in negative territory, it will be difficult to build a favorable environment for consistent crypto demand over the coming sessions. If the index continues to fall, it could suggest that market participants’ perception is still deteriorating, affecting the possibility of a short-term demand recovery and keeping possible selling pressure on BTC.
Technical outlook for Bitcoin
Source: StoneX, Tradingview
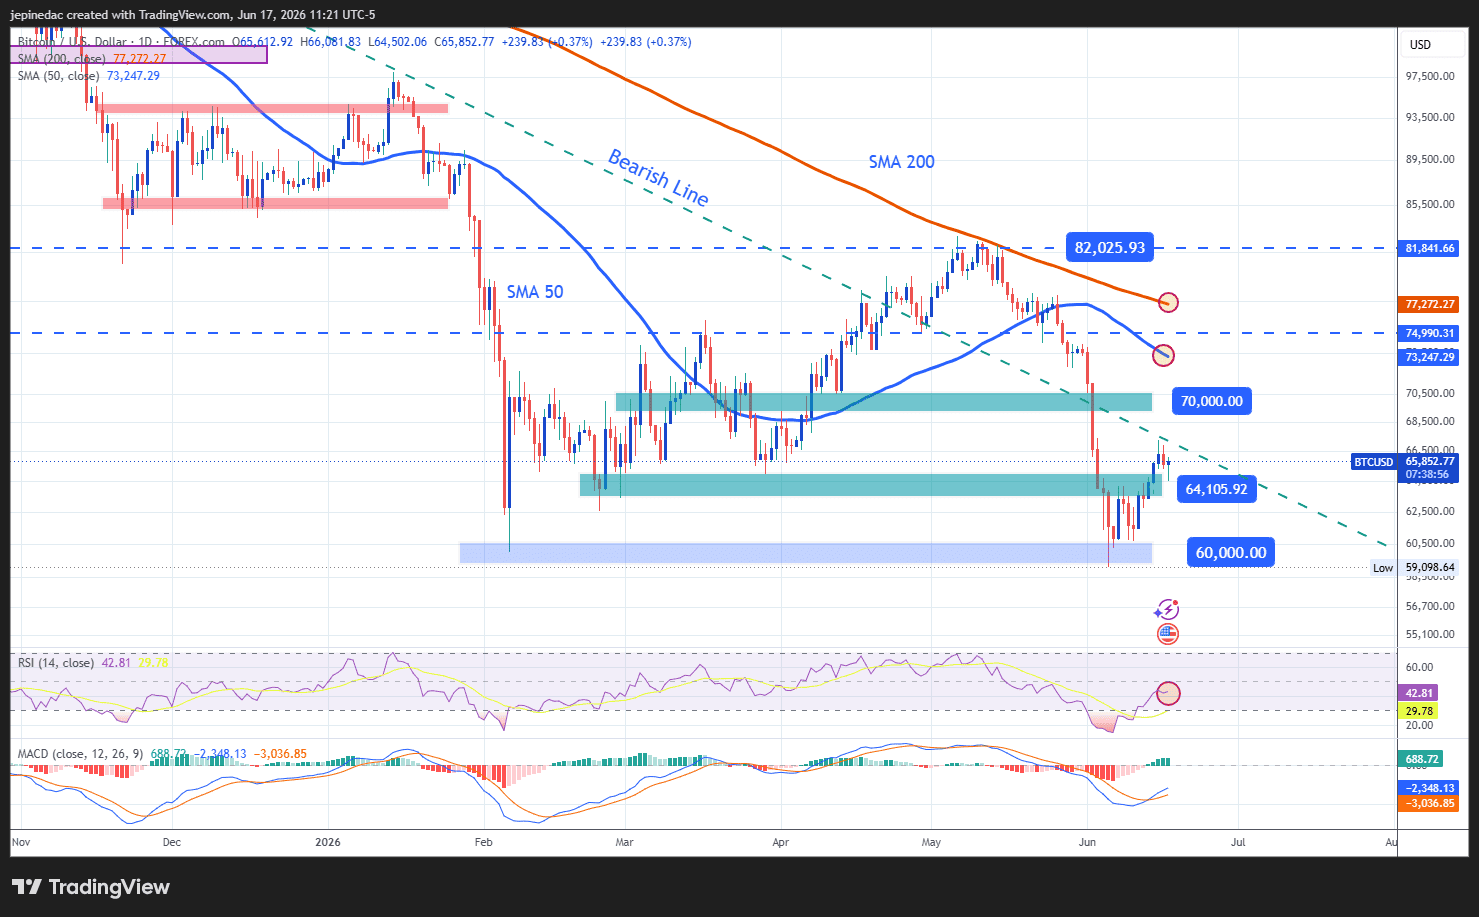
- The major bearish trendline remains relevant: Now, the dominant technical pattern on the BTC daily chart remains the major bearish trendline that has shaped price action over the last few months. For now, given the lack of relevant bullish corrections, this structure remains the most important technical pattern to monitor. If selling pressure strengthens again, the bearish trend could continue to extend over the coming weeks.
- MACD: Now, the MACD indicator has started to show a consistently flat histogram. This reflects that the average strength of short-term moving averages has lost relevance and could be opening the door to a more consistent neutral phase.
- RSI: RSI Line shows a similar setup, as the indicator remains around the 50 level. This reflects a balance between buying and selling impulses in the short term. If this behavior continues, it could also reinforce a phase of indecision on the chart.
Key levels:
- 70,000 – Important resistance: Relevant high area located around an important psychological level for the market. Price action that manages to recover this zone would not only put the major bearish trendline at risk but could also begin to show a relevant buying bias for the coming weeks.
- 64,100 – Near-term barrier: Short-term neutral level. If the price does not move too far away from this area, a more relevant phase of indecision could start to form, with the possibility of a sideways range on the chart.
- 60,000 – Definitive support: Low area not seen since 2024 and the main psychological support level to watch now. Price action below this barrier could extend the dominance of the selling bias and give continuity to the major bearish trendline over the coming trading sessions.
Written by Julian Pineda, CFA, CMT – Market Analyst
Follow him on: @julianpineda25
Related tags:








Web Trader platform
Our sophisticated web-based platform is packed with features.
Open an account today
Experience award-winning platforms with fast and secure execution.
Economic calendar
Related articles

Bitcoin Forecast: BTC/USD Back to $80K Ahead of Warsh’s Jackson Hole Speech
After surging over $15,000 in the past 10 days alone, there is risk of a near-term pullback if Warsh says anything remotely hawkish at Jackson Hole - what are the levels to watch from here?


Bitcoin’s failed breakouts are becoming hard to ignore
Three failed breakout attempts and fading momentum have put Bitcoin bulls on notice. Another rejection could open the door lower just as attention swings back towards NVIDIA and the AI trade.


US Dollar, Gold & Bitcoin Weekly Technical Outlook 8 24 2026
Key levels on active technical setups in DXY, Gold, and Bitcoin heading into the start of the week.