


Bitcoin Forecast Is Risk Appetite Making a Comeback?
Over the last three trading sessions, Bitcoin has posted a gain of nearly 2.00%, bringing a short-term bullish bias back into focus. Buying pressure has held steady as confidence in risk assets rebounds, driven by relative stability in the Middle East.
Written by
Julian Pineda
Market Analyst
Over the last three trading sessions, Bitcoin has posted a gain of nearly 2.00%, bringing a short-term bullish bias back into focus. Buying pressure has held steady as confidence in risk assets rebounds, driven by relative stability in the Middle East. This favorable backdrop is now spilling over into the crypto market. If this renewed wave of confidence holds, it could continue to fuel meaningful buying pressure for BTC in the sessions ahead.

Is Demand Sentiment Stabilizing?
The past few sessions have been pivotal for financial markets, largely thanks to signs of diplomatic progress around the Strait of Hormuz. The United States halted major strikes against Iran, shifting focus to negotiations starting Monday. Today, Qatar, acting as a mediator, noted concrete progress, while US officials emphasized that a deal could be within reach if talks continue.
This shift has had a direct impact on market confidence. With geopolitical uncertainty easing, WTI crude has slipped below the $80 mark, helping to dial back fears of global inflation. This, in turn, eases concerns about aggressive central bank rate hikes, clearing the way for risk appetite to recover. As a risk-on asset, BTC stands to benefit directly from this dynamic, which could help stabilize demand in the near term.
This rebound in confidence is already showing up in broader sentiment gauges like CNN's Fear and Greed Index. The gauge has climbed to 59 points, crossing into "greed" territory for the first time in weeks. This marks a significant sentiment recovery, likely fueled by optimistic Middle East developments, and signals that the appetite for risk assets might be making a consistent return.
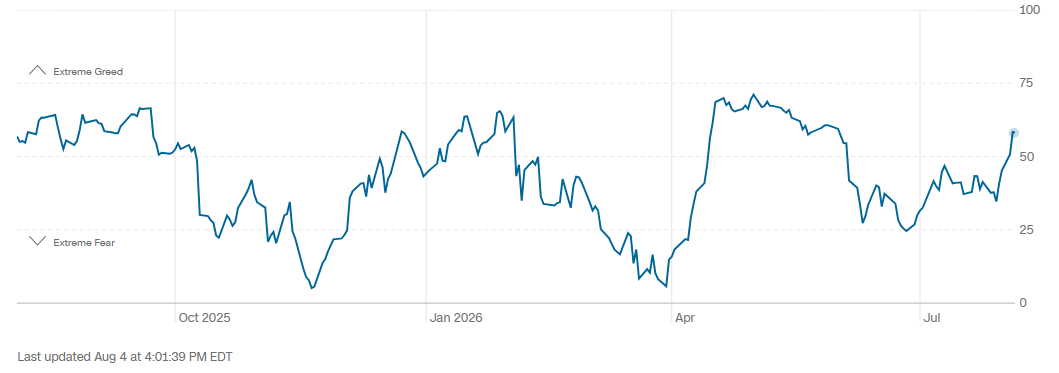
Source: CNN
A similar, albeit smaller, shift is visible in the crypto market's confidence index. While it hasn't quite hit "greed" yet, it has posted solid gains, climbing to 38 points and edging closer to "neutral" territory. This shows that the confidence rebound isn't just confined to traditional stock markets; it's starting to bleed into the crypto ecosystem, which could help anchor demand in the short term.
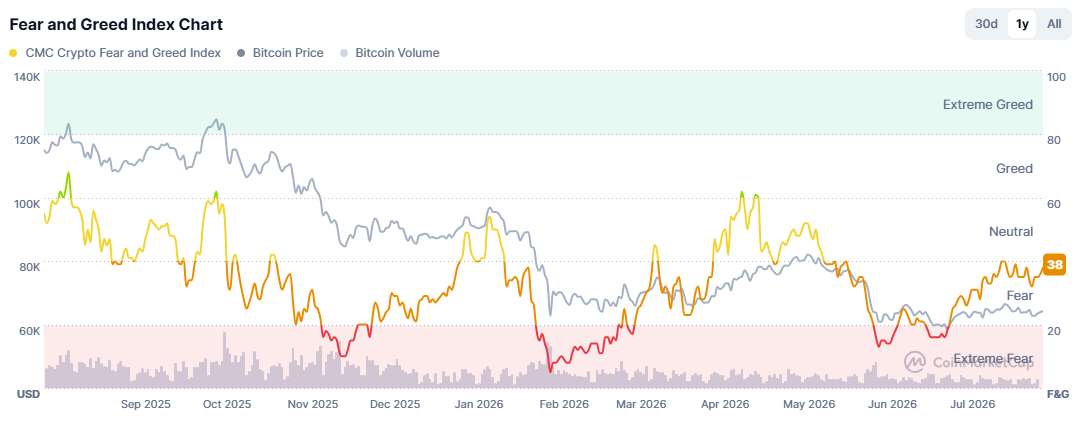
Source: Coinmarketcap
This environment has also sparked a noticeable pickup in Bitcoin activity over the last few days. Open Interest, which tracks the total number of outstanding long and short positions across exchanges, has been trending higher, approaching the $23 billion mark and signaling fresh capital entering the market. When paired with BTC's recent price gains, this suggests the surge in activity is largely driven by new long positions, pointing to a stabilization in demand.
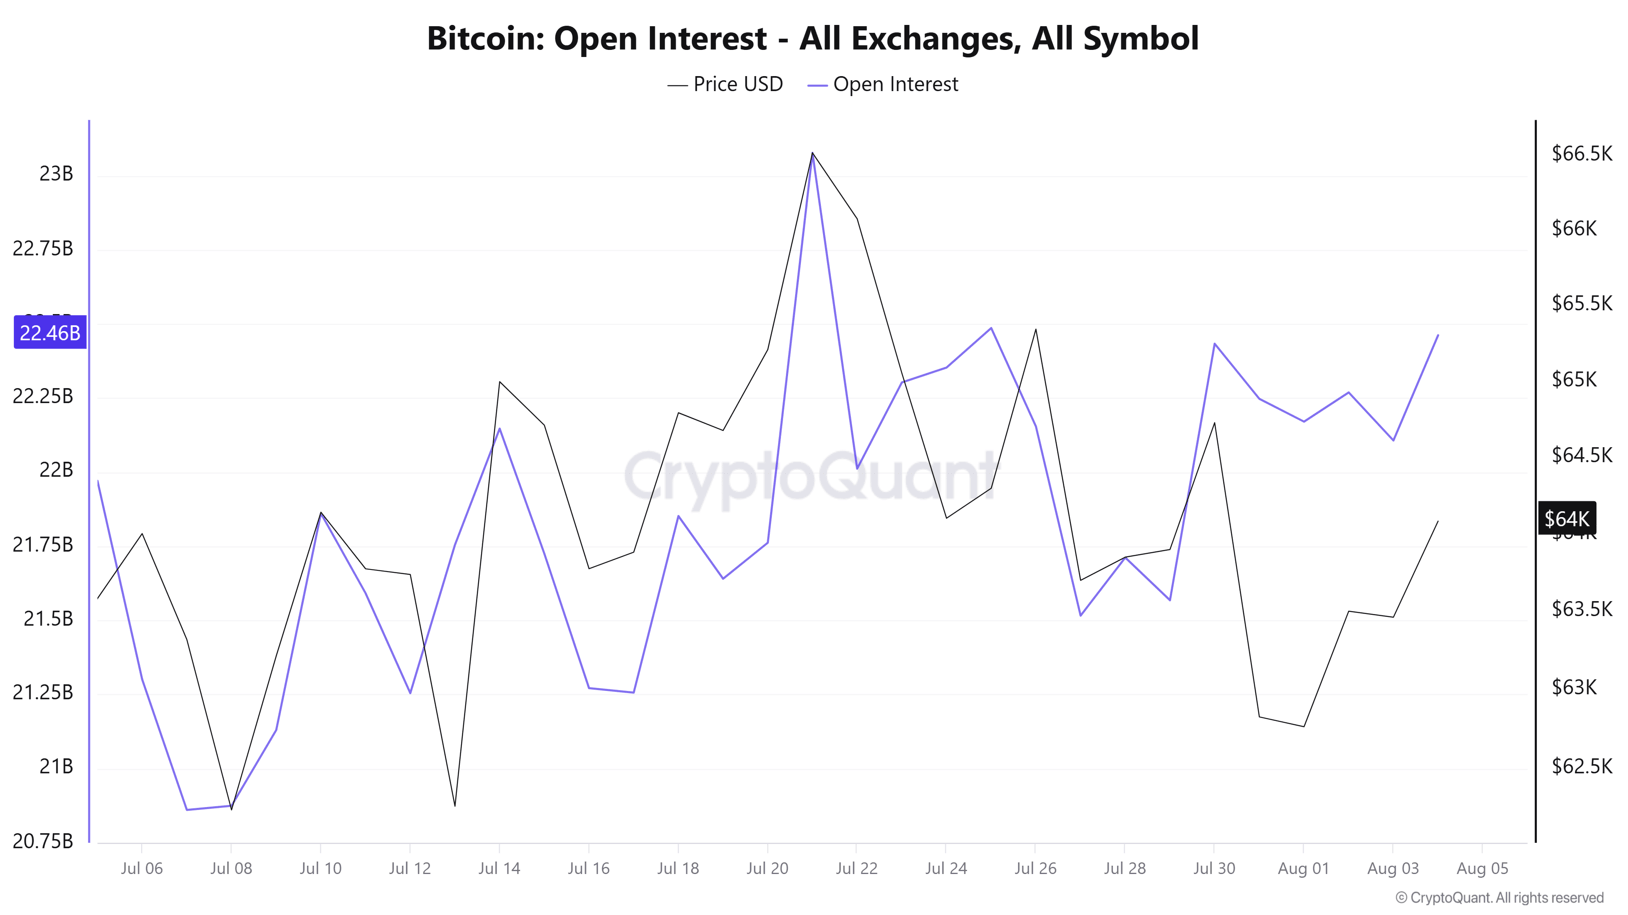
Source: CryptoQuant
Ultimately, the recent optimism surrounding the Middle East could prove crucial. Sustained confidence would provide an ideal environment for demand in cryptos like BTC to gain traction. If this backdrop holds, it could drive significant buying pressure in BTC price action over the short term. That said, the current calm remains fragile. If diplomatic agreements stall, a fresh wave of indecision could easily return to the Bitcoin market in the coming weeks.
Bitcoin Technical Outlook
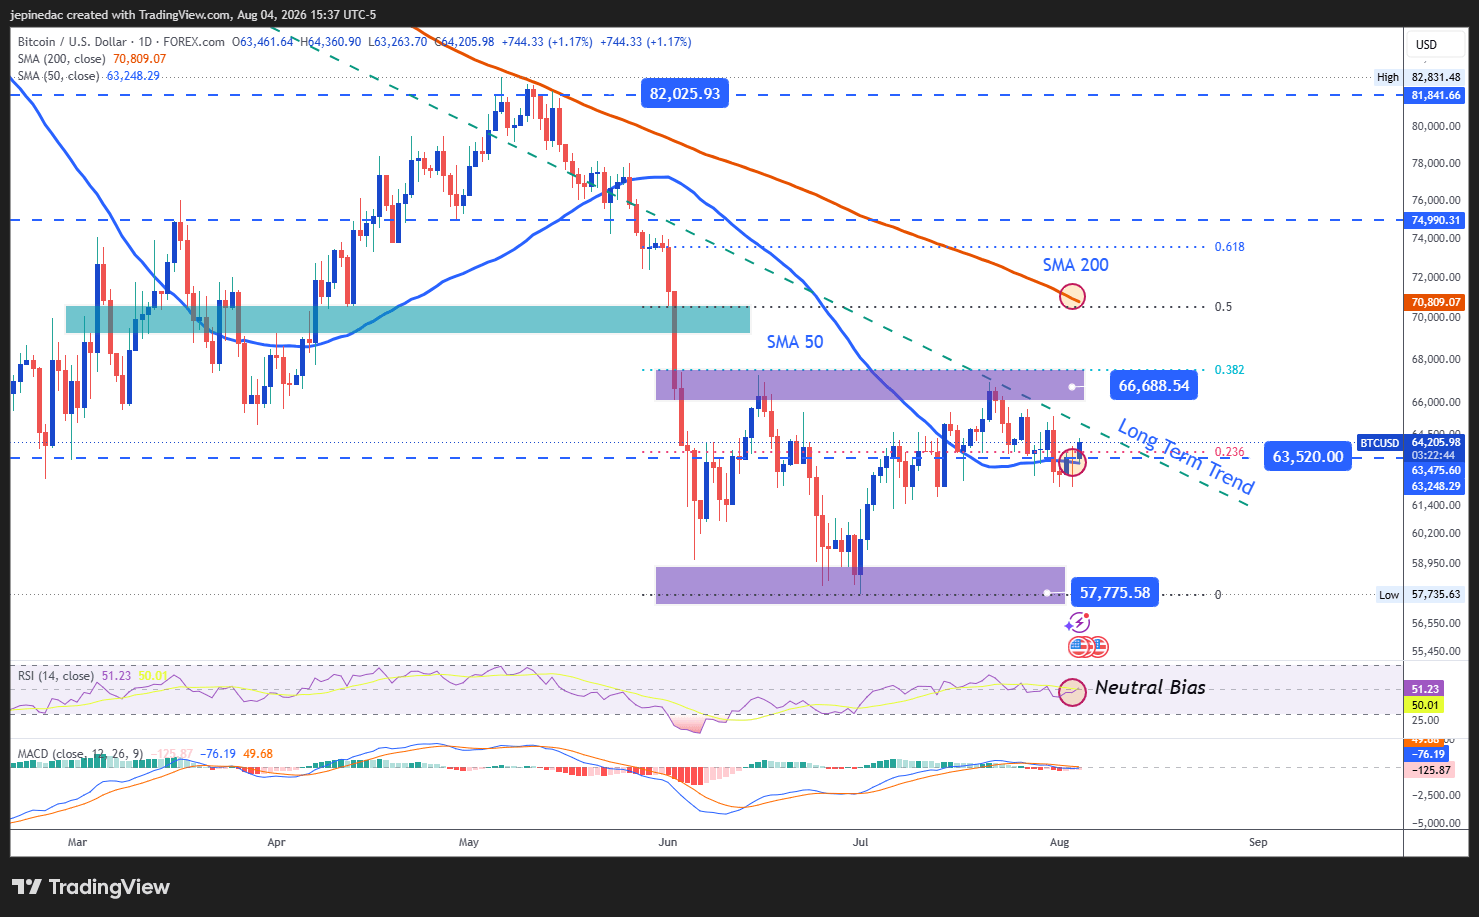
Source: StoneX, Tradingview
- Price continues to battle major downtrend line: Despite a meaningful price recovery in recent sessions, bullish momentum still falls short of breaking the long-standing downtrend line that has dominated the chart for months. Until buying pressure fully consolidates, this technical structure could remain the dominant pattern to watch in the weeks ahead.
- MACD: The MACD histogram is hovering near the neutral 0 line, suggesting a balance in short-term moving average momentum. If this behavior persists, it could reflect an increasingly relevant phase of indecision on the chart.
- RSI: The RSI is showing a similar dynamic, with the indicator line sitting near the neutral 50 level. This reflects a tug-of-war between bullish and bearish momentum over the last 14 sessions, reinforcing the likelihood of a lingering indecision phase despite the recent price bounce.
Key Levels:
- 66,700 (Key Resistance): A major bullish barrier aligning with the chart's most relevant 38.2% Fibonacci retracement and recent weekly highs. A sustained move above this level could shatter the dominant downtrend line, paving the way for a stronger bullish bias and a potential structural shift in the coming weeks.
- 63,500 (Nearby Barrier): A crucial neutral zone where the 23.6% Fibonacci retracement converges with the 50-period simple moving average. If price action fails to break cleanly away from this level, it could cement a more consolidated phase of short-term indecision.
- 57,700 (Ultimate Support): A major support zone matching recent and 2026 lows. A breakdown below this level could reinforce a dominant bearish bias and open the door for a significant extension of the multi-month downtrend.
Written by Julian Pineda, CFA, CMT – Market Analyst
Follow him on: @julianpineda25
Related tags:







Web Trader platform
Our sophisticated web-based platform is packed with features.
Open an account today
Experience award-winning platforms with fast and secure execution.
Economic calendar
Related articles

Bitcoin Forecast: BTC/USD Back to $80K Ahead of Warsh’s Jackson Hole Speech
After surging over $15,000 in the past 10 days alone, there is risk of a near-term pullback if Warsh says anything remotely hawkish at Jackson Hole - what are the levels to watch from here?


Bitcoin’s failed breakouts are becoming hard to ignore
Three failed breakout attempts and fading momentum have put Bitcoin bulls on notice. Another rejection could open the door lower just as attention swings back towards NVIDIA and the AI trade.


US Dollar, Gold & Bitcoin Weekly Technical Outlook 8 24 2026
Key levels on active technical setups in DXY, Gold, and Bitcoin heading into the start of the week.
