


Crypto Technical Analysis Mixed behavior returns to the market
The second week of July is coming to an end, and the cryptocurrency market is once again showing mixed behavior. For now, only the main cryptocurrencies, such as BTC and ETH, have managed to maintain some stability in the short term, while the rest of the market continues to reflect weakness.
Written by
Julian Pineda
Market Analyst
The second week of July is coming to an end, and the cryptocurrency market is once again showing mixed behavior. For now, only the main cryptocurrencies, such as BTC and ETH, have managed to maintain some stability in the short term, while the rest of the market continues to reflect weakness.
The short-term bearish bias has tried to return to the market and has started to erase part of the recovery attempts seen in recent weeks. In this scenario, the broader market could be facing a decline in demand confidence, creating a lack of direction and potentially maintaining a phase of indecision over the next few sessions.

Performance of the main cryptocurrencies
Source: Data - StoneX, Tradingview
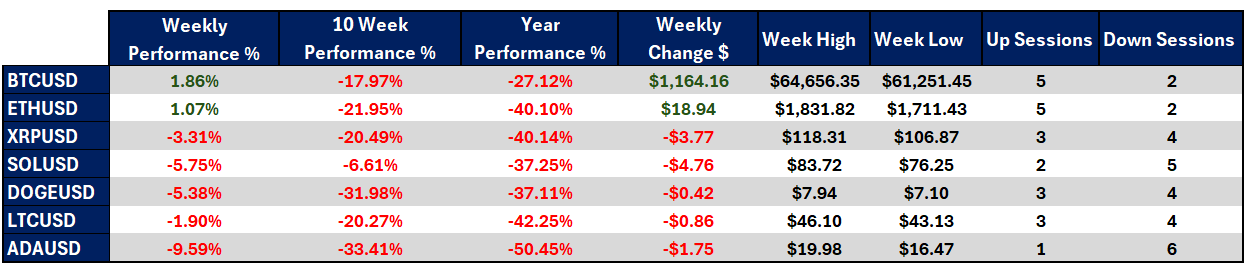
- During the week, a bias of indecision was once again observed across the main cryptocurrencies. The market has not managed to establish a clear short-term direction. In this scenario, Bitcoin has been one of the cryptocurrencies that has held up better, ending the week with a gain of more than 1.8%. However, other assets such as Cardano have shown relevant weakness, with a loss of -9.59%, showing that BTC’s relative stability has not spread to the rest of the market.
- Over the last 10 weeks on average, weakness remains relevant across the main cryptocurrencies. All of them continue to show significant declines, indicating that medium-term selling pressure has not fully disappeared. In this regard, Solana stands out with a decline of only -6.61%, positioning it as one of the most stable cryptocurrencies compared to previous weeks. In contrast, Cardano remains one of the most affected, with a decline of -33.41%, reflecting that its accumulated weakness is still considerable.
- Year to date, the market still faces an important challenge. None of the main cryptocurrencies has managed to move above its 2026 opening price, and the recent recovery still does not appear strong enough to drastically change the annual dynamic. Cardano remains the weakest asset over this period, with a decline of -50.45%. Meanwhile, Bitcoin has tried to maintain greater relative stability, with a decline of -27.12%, although it has still failed to deliver a positive performance for the year.
- Bitcoin has tried to maintain strength, but the move has not been enough to restore confidence. The cryptocurrency has gained close to one thousand dollars during the week, but it remains far from showing movements near the 65k reference area, highlighting significant indecision in the market’s benchmark cryptocurrency.
- Overall, the market has not managed to maintain last week’s confidence and continues to show weakness and indecision. In addition, Bitcoin has failed to pull the rest of the market higher, maintaining a sense of broad weakness that could continue to affect the recovery attempts seen in previous weeks over the next few trading sessions.
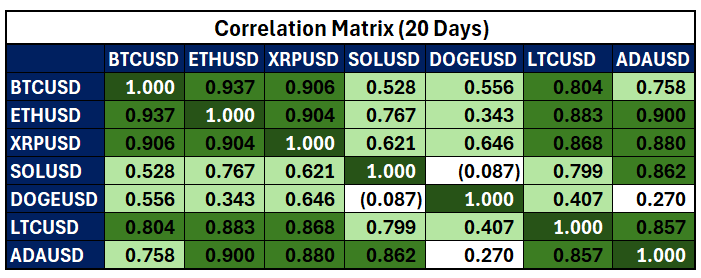
Colors from red to green – Red for negative correlations and green for positive correlations
Source: Data - StoneX, Tradingview
From a correlation standpoint, some cryptocurrencies are showing a decline in their coefficient relative to Bitcoin. Although a strong positive correlation above 0.8 remains in assets such as Litecoin, ETH, and XRP, in the case of ADA, Solana, and Dogecoin, coefficients have already moved below this area and are even approaching 0.5.
This shows that, although positive correlation still exists, it is becoming less strong relative to Bitcoin’s short-term behavior.
This behavior indicates that the crypto market, in general, has started to detach from Bitcoin’s dynamic. For now, many cryptocurrencies are failing to match the relative stability maintained by the market’s main asset, reflecting weaker appetite for less relevant cryptocurrencies.
In this scenario, short-term movements appear to be concentrated in the largest assets, showing exposure to individual cryptocurrencies rather than to the crypto market as a whole. This highlights the lack of appeal that has started to appear in the short term and could continue to affect demand over the next few sessions.
Bitcoin slows demand strength
Source: StoneX, Tradingview
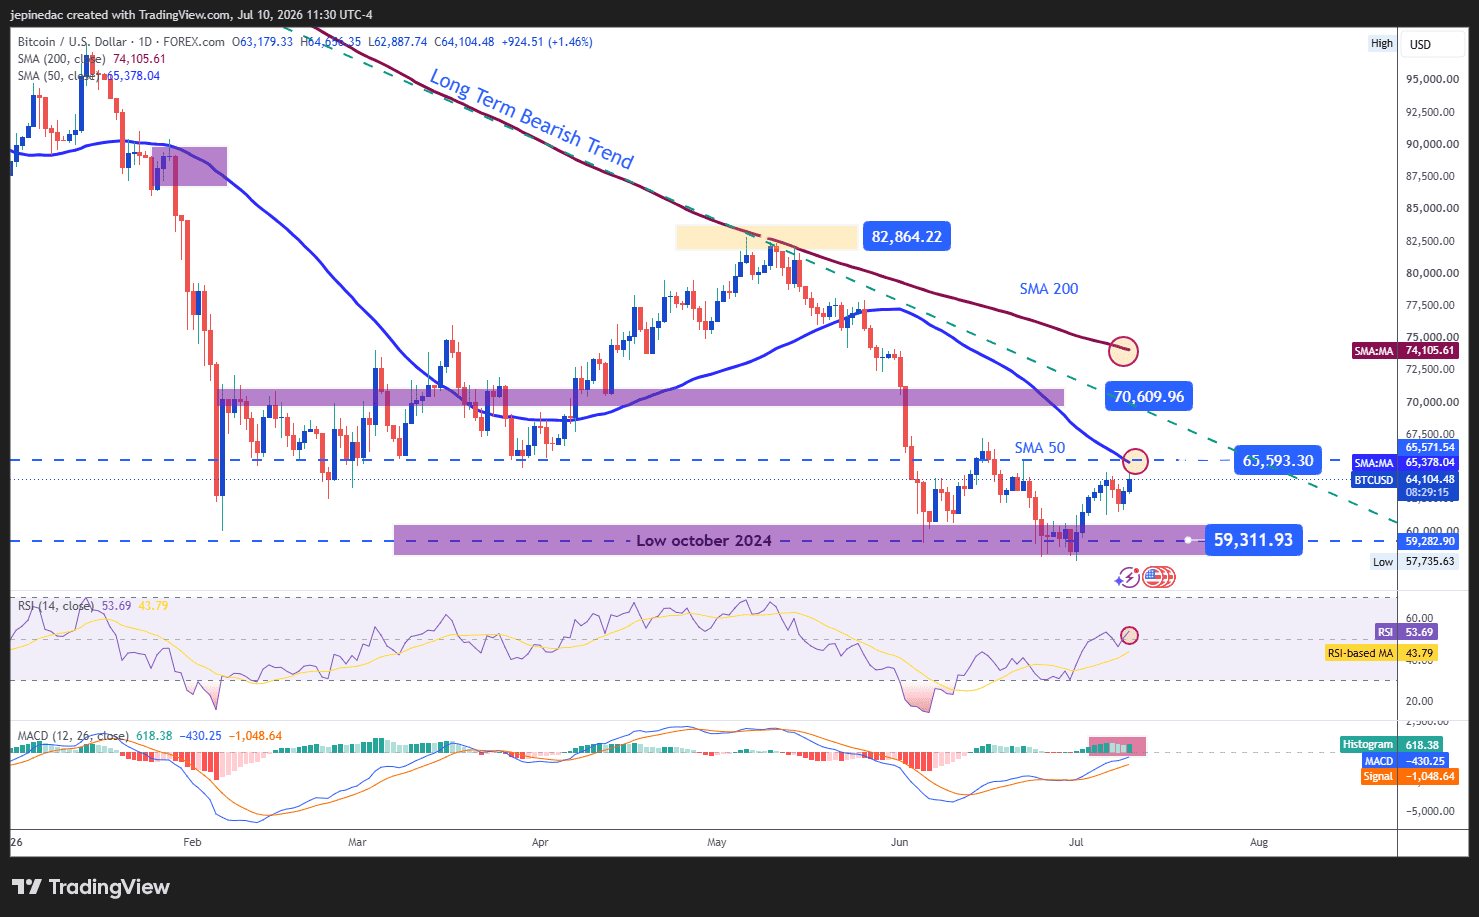
Bitcoin has been one of the few cryptocurrencies trying to maintain relative stability in its price movements. However, the recovery has not been strong enough to break key barriers that could put at risk the long bearish trend line that has remained in place for several months. For this reason, this remains the most relevant technical structure to watch and could continue to dominate Bitcoin price movements over the next few sessions.
Indicators:
- At the moment, the RSI remains very close to the 50 level, while the MACD histogram shows consistent flattening slightly above the neutral 0 area. Both movements indicate a balance between buying and selling impulses in the short term, as well as a loss of bullish strength in short-term moving averages. This points to a phase of indecision that remains present on the chart and could continue over the next few sessions.
Key levels:
- 70,600 USD – Important resistance: This recent high zone is positioned as the most relevant bullish barrier and coincides with the base marked by the long bearish trend line. Moves toward this level could reactivate the buying bias and start to put the bearish structure at risk over the coming weeks.
- 65,500 USD – Near-term barrier: This neutral chart level aligns with the 50-period simple moving average. Price movements too close to this level could continue to highlight a phase of indecision and even open room for the formation of a short-term sideways range.
- 59,300 USD – Definitive support: This area represents the October 2024 low and is close to important psychological levels. For now, it remains the most relevant bearish barrier. Consistent moves below this point could reactivate the selling bias from previous weeks and extend the bearish trend line as the dominant structure over the coming trading weeks.
Ethereum keeps trying to fight the long trend line
Source: StoneX, Tradingview
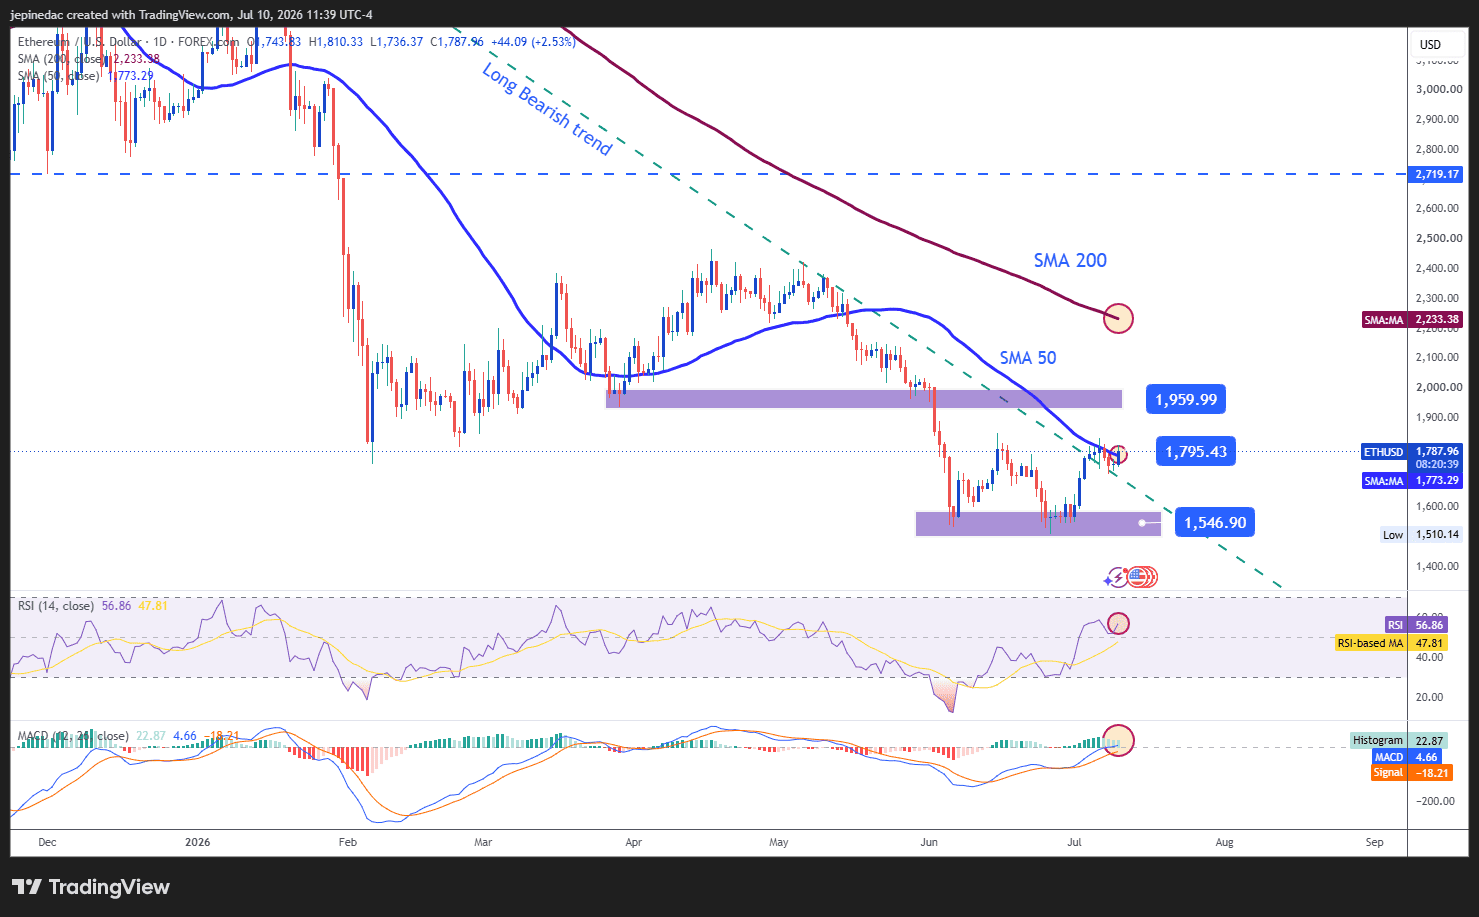
Ethereum was the only other cryptocurrency in the market that attempted to maintain stability during the trading week. For now, the most relevant technical event on its daily chart is that price is facing the long bearish trend line, which has been the dominant structure for several months. If more relevant buying pressure manages to stabilize in the short term, this dynamic could start to put that trend line at risk and open room for a stronger buying bias over the next few sessions.
Indicators:
- Now, both the RSI and the MACD histogram remain above their neutral zones of 50 and 0, respectively. This suggests that a relevant average of buying impulses remains in place, along with some bullish strength in short-term moving averages. If this behavior continues, a potential buying bias could remain relevant in price movements.
Key levels:
- 1,959 – Important resistance: This relevant high level coincides with barriers from previous weeks and could act as a structural turning point. Price movements above this level would end the long bearish structure from previous months and could open room for a new bullish structure over the coming weeks.
- 1,795 – Near-term barrier: This relevant level coincides with the bearish trend line and the 50-period moving average. Price movements too close to this level could highlight a more important phase of indecision and open room for the formation of a sideways range over the next few sessions.
- 1,546 – Main support: This level corresponds to the relevant 2026 lows and is considered the most important bearish barrier. Moves toward this area could call the recent recovery into question and reactivate a relevant selling bias, with room to extend the long bearish trend line over the coming weeks.
Written by Julian Pineda, CFA, CMT – Market Analyst
Follow him on: @julianpineda25







Web Trader platform
Our sophisticated web-based platform is packed with features.
Open an account today
Experience award-winning platforms with fast and secure execution.
Economic calendar
Related articles

Bitcoin Forecast: BTC/USD Back to $80K Ahead of Warsh’s Jackson Hole Speech
After surging over $15,000 in the past 10 days alone, there is risk of a near-term pullback if Warsh says anything remotely hawkish at Jackson Hole - what are the levels to watch from here?


Bitcoin’s failed breakouts are becoming hard to ignore
Three failed breakout attempts and fading momentum have put Bitcoin bulls on notice. Another rejection could open the door lower just as attention swings back towards NVIDIA and the AI trade.


US Dollar, Gold & Bitcoin Weekly Technical Outlook 8 24 2026
Key levels on active technical setups in DXY, Gold, and Bitcoin heading into the start of the week.
