


Dow Jones Futures (YM) Outlook: August Seasonality and Key Levels
Dow Jones Futures show weak August seasonality and key support at 43,500. Traders weigh shallow pullback vs trend continuation toward new highs.
Written by
Matt Simpson
Market Analyst
August is typically a dull month for Dow Jones Futures (YM), with flat average returns and lower volatility driven by summer trade. That said, a 61% win rate suggests a slight bullish bias. From a technical perspective, YM has pulled back to a key support zone after a 22% rally. With price action showing mixed signals, traders are watching 43,500 closely to determine whether a swing low forms—or whether deeper support levels come into play.
View related analysis:
Dow Jones (YM) Traders Eye 43,500 as August Seasonality Turns Soft
Dow Jones Futures (YM) Seasonality Analysis
August has not historically been the most exciting month for Dow Jones Futures traders, based on 23 years of seasonality data. As it’s the peak of holiday season, liquidity and volatility tend to drop—resulting in average returns for August that are flat overall. That said, the optimist could point to a 61% win rate, suggesting a slight bullish bias.
Perhaps the most important takeaway for Dow Jones (YM) traders is that in the absence of a strong seasonal pattern—and in the context of thinner summer trade—the Dow could move in either direction. In these conditions, traders may prefer to keep profit targets modest, unless a clear macro catalyst emerges to provide stronger directional conviction.
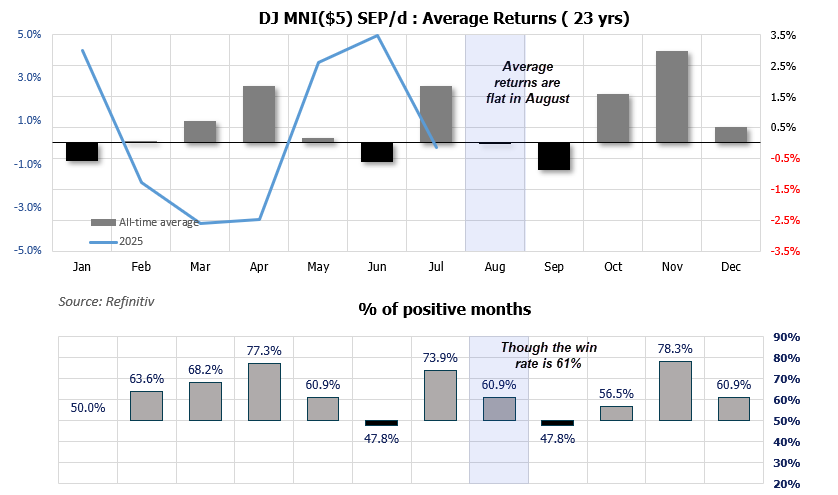
Chart analysis by Matt Simpson, Source: TradingView, CBOT Futures, Dow Jones E-mini Futures, LSEG
Dow Jones Futures (YM) Technical Analysis
The weekly chart shows Dow Jones Futures (YM) rallied 22% from the April low. But with barely a pullback during that advance, perhaps one is now due.
Last week’s bearish engulfing candle drove price back to the 50-week EMA and the June 9 high, making 43,500 a pivotal near-term level. A break below this zone brings the high-volume node (HVN) at 42,688 into focus, with a 38.2% Fibonacci retracement aligning near the 42,000 handle as a broader support area.
Given the strength of the underlying uptrend, the bias still favours new highs for the Dow Jones and Wall Street indices more broadly.
However, on the daily chart, a bullish engulfing candle printed Monday at the confluence of the 200-day and 50-day SMAs, just one day after RSI (2) reached its most oversold reading since 8 April.
- Bulls may seek dips within Monday’s range and retain a near-term bullish bias while price holds above 43,600, targeting a move toward 45,000.
- Bears may be eyeing a failed breakout above 45,000, a level that has proven difficult to hold, for a potential swing lower toward 42,688 HVN or 42,000.
- At that point, I’d reassess the Dow’s potential to form a swing low and resume its broader uptrend on the weekly chart.
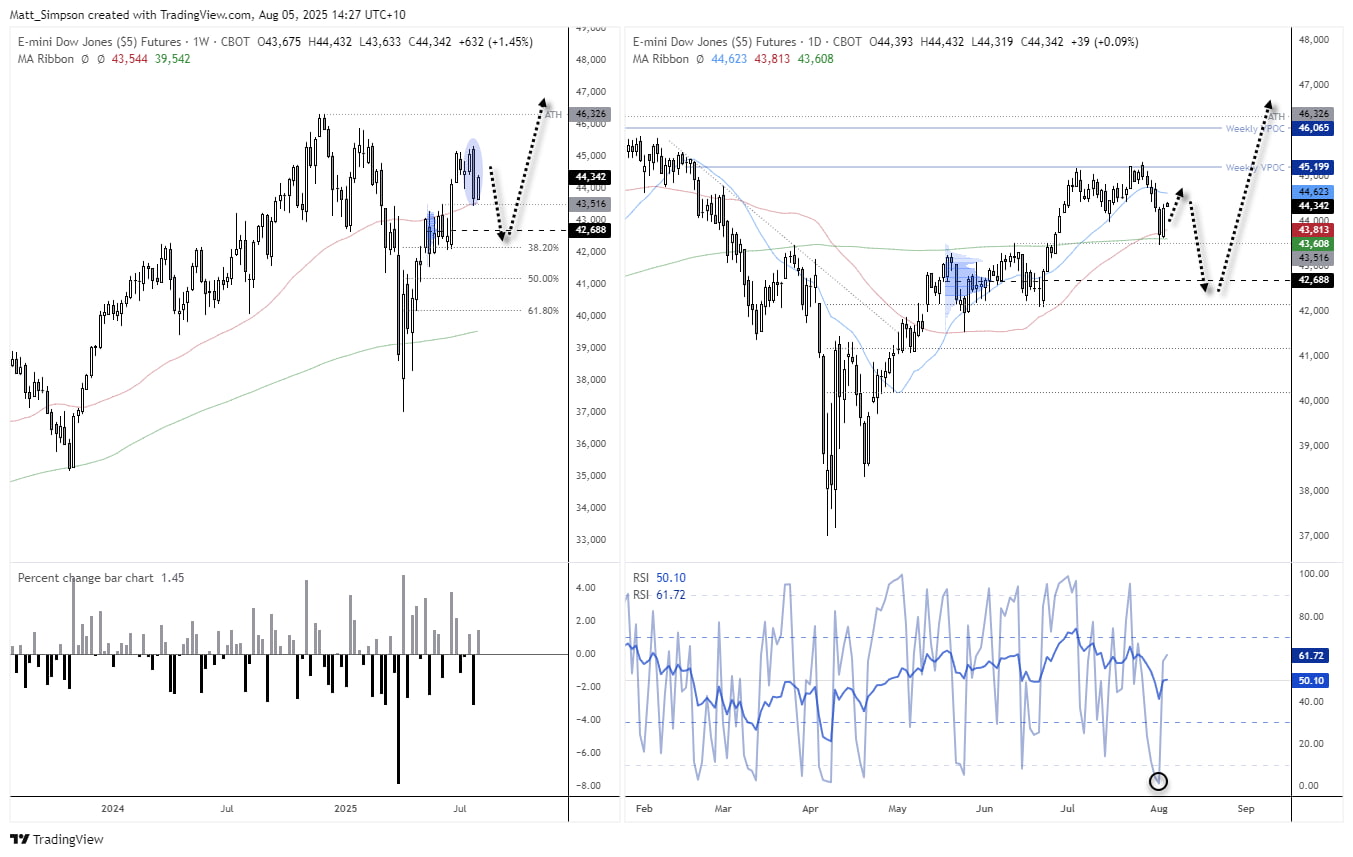
Chart analysis by Matt Simpson, Source: TradingView, CBOT Futures, Dow Jones E-mini Futures
View the full economic calendar
-- Written by Matt Simpson
Follow Matt on Twitter @cLeverEdge
How to trade with City Index
You can trade with City Index by following these four easy steps:
- Open an account, or log in if you’re already a customer
• Open an account in the UK
• Open an account in Australia
• Open an account in Singapore
- Search for the market you want to trade in our award-winning platform
- Choose your position and size, and your stop and limit levels
- Place the trade
Related tags:







Web Trader platform
Our sophisticated web-based platform is packed with features.
Open an account today
Experience award-winning platforms with fast and secure execution.
Economic calendar
Related articles