



AUD/USD Weekly Outlook: Fed Bets Boost Aussie as US Data Weakens
AUD/USD eyes a rebound as weak US data revives Fed cut bets, though RBA expectations and key US services data will shape direction this week.
Written by
Matt Simpson
Market Analyst
AUD/USD rebounded on Friday after a run of weak US data triggered renewed bets for Federal Reserve rate cuts. While this snapped a five-day losing streak for the Aussie, it still closed the week lower against the greenback. Traders now turn their attention to this week’s ISM services data and RBA meeting, with both central banks' policy paths expected to steer AUD/USD’s next move.
View related analysis:

Charts prepared by Matt Simpson - Data source: LSEG
AUD/USD Rebounds on Weak US Data but Faces Key Tests from RBA and ISM Services
US yields were lower alongside the US dollar on Friday on renewed bets of a September cut from the Federal Reserve (Fed).
Money markets are now implying that the Federal Reserve (Fed) will cut interest rates by 25bp in September, following weak data from Friday’s Nonfarm Payrolls (NFP) and PMI reports. This is despite the FOMC minutes pouring cold water on such a move earlier in the week, but the data set is hard to ignore.
Only 73k jobs were added to the economy in July – well below the 106k expected – but perhaps more alarming was the sharp revision to June’s figures, down from 147k to just 14k. While unemployment remained relatively low and flat at 4.2%, June’s data is uncomfortably close to signalling contraction. The US manufacturing sector also contracted for a fifth month in June, according to the latest PMI figures, with the employment index falling to a one-year low of 43.4. New orders contracted for a sixth consecutive month.
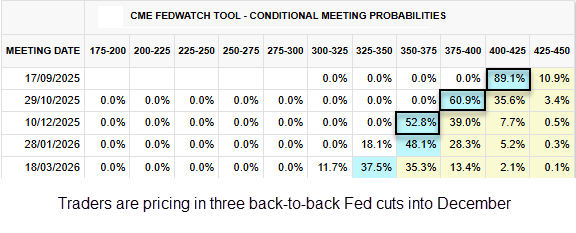
Chart Source: CME Group
This week’s ISM services report will be closely scrutinised, as any further signs of weakness will only bolster expectations for the Fed to act. And that could still be a bullish cue for AUD/USD traders, despite renewed expectations that the RBA will cut next week.
Quarterly inflation figures likely pave the way for the RBA to ease by 25bp, though I suspect they’ll refrain from being too dovish and will continue to emphasise caution in the outlook. Meanwhile, with money markets trying to price in three back-to-back cuts by December, the US dollar may have further to fall in relative terms than the Australian dollar – putting AUD/USD back on bullish breakout watch.
AUD/USD technical analysis
We have contrasting signals on the weekly and daily charts of AUD/USD. The weekly chart suggests the Australian dollar is finally topping out, while the daily chart has presented a bullish signal in the near term.
The daily RSI(2) was extremely oversold on Wednesday and Thursday ahead of Friday’s rebound, which saw a bullish engulfing candle form part of a three-bar bullish reversal (morning star pattern) just above the high-volume node (HVN) at 0.6414. AUD/USD now appears to be heading for the 65c level, with potential to break above its 50-day EMA (0.6509) and 20-day EMA (0.6523).
Whether it can make a run for 66c likely depends on whether the US ISM services report signals further weakness in the US economy—particularly if prices paid fall fast enough to lower inflation expectations. However, if the report delivers another set of solid figures, upside for AUD/USD could be capped and the US dollar may regain some bullish attention.
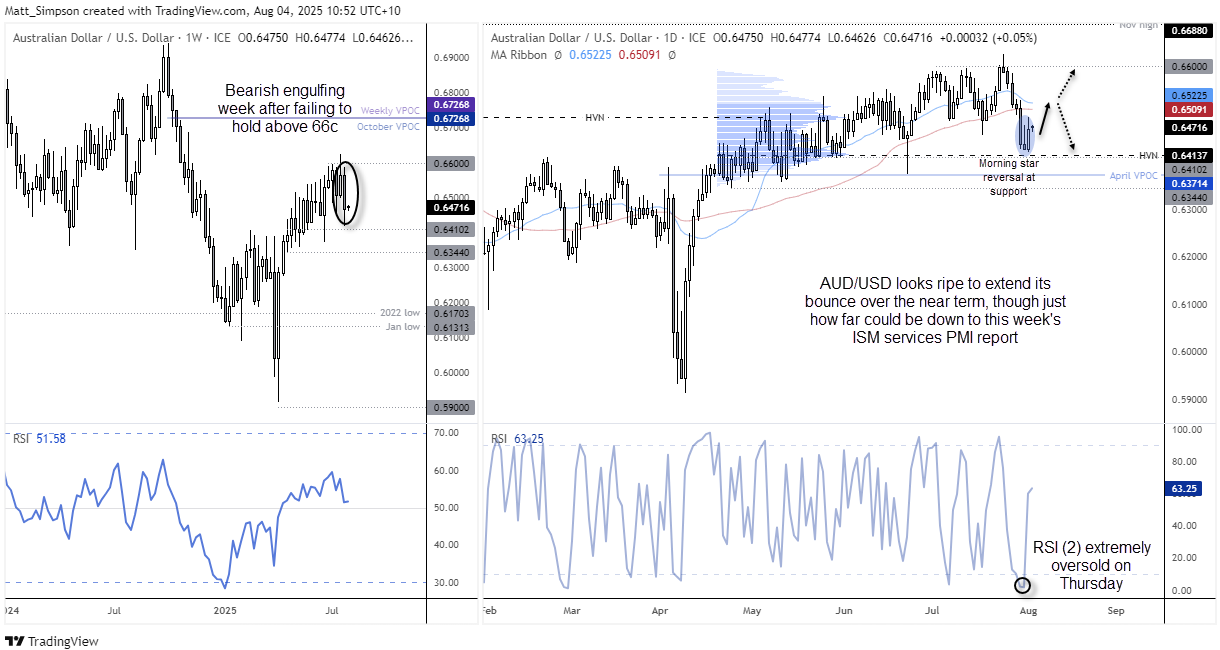
Chart analysis by Matt Simpson - Data source: TradingView, ICE AUD/USD
AUD/USD correlations:
Most market moves can be traced back to Fed monetary policy expectations, which means the US dollar tends to track US yields higher or lower—and AUD/USD shares a strong inverse correlation with both. The 20-day rolling correlation between the US dollar index and AUD/USD has risen to a very high level of 0.96, indicating an almost perfect relationship.
While the correlations between AUD/USD and NZD/USD and the Chinese yuan are even stronger—at 0.98 and 0.97 respectively—these, too, can largely be traced back to the US dollar, yields, and Fed policy expectations.

Charts prepared by Matt Simpson - Data source: LSEG
View the full economic calendar
-- Written by Matt Simpson
Follow Matt on Twitter @cLeverEdge
How to trade with City Index
You can trade with City Index by following these four easy steps:
- Open an account, or log in if you’re already a customer
• Open an account in the UK
• Open an account in Australia
• Open an account in Singapore
- Search for the market you want to trade in our award-winning platform
- Choose your position and size, and your stop and limit levels
- Place the trade







Web Trader platform
Our sophisticated web-based platform is packed with features.
Open an account today
Experience award-winning platforms with fast and secure execution.
Economic calendar
Related articles

Euro Short-term Outlook: EUR/USD Pullback Nears Pivotal Uptrend Support 8 28 2026
Warsh's comments accelerated the EUR/USD selloff, raising the stakes as buyers look to stabilize the broader recovery.


EUR/USD forecast: All eyes on Warsh at Jackson Hole - Forex Friday
For much of this week, the EUR/USD has been edging lower with the US dollar regaining some ground after last week’s sell-off that was triggered, in part, by the bond market worries. Investors have been unwilling to bet further against the US dollar so far this week ahead of Kevin Warsh’s keynote speech at the Jackson Hole summit, due later today.


AUD/CAD breakout puts the Bradman barrier in sight
A bullish breakout has pushed AUD/CAD to its highest level since early 2021. Whether it can clear 0.9994 may determine if the move extends well above parity.
